1. Introduction
Since the Industrial Revolution, the intervention of human activities on the earth’s environment has become increasingly significant, the global temperature has been rising, and extreme events have occurred frequently. In parallel with the rapid development of industrial and economy, CO2 emissions and global temperature are also rapidly increasing which also produced an invisible influence on the global biological system and human social society. In recent years, the impact of global warming is becoming increasingly apparent. Climate warming intensifies the instability of the climate system and is an important background for the frequent occurrence of extreme weather and climate events. For the first time, the IPCC alone provides a comprehensive and systematic assessment of changes in extreme events in Chapter 11 of AR6 Synthesis Report: Climate Change 2023 [1]. Climate change caused by human activities has affected many extreme events in various regions of the world, including extreme temperatures, heavy precipitation, droughts, tropical cyclones, wildfires, complex events, etc. Future changes in extreme events are related to the magnitude of global warming, and even small global warming will exacerbate changes in the frequency and intensity of extreme events.
There is a mounting recognition of the significant impact of CO2 emissions, particularly those stemming from fossil fuels and industrial activities, on global warming. Empirical data indicates a substantial surge in annual carbon dioxide emissions from fossil fuels and industry, escalating from 1.95 to 37.12 billion tons from 1900 to 2021. Notably, the absolute change in average temperature anomaly from 1900 to 2023 stands at 1.08 degrees Celsius, exhibiting an apparent upward trajectory. Consequently, numerous nations have instituted policies aimed at curtailing carbon dioxide emissions to align with the United Nations’ Net-zero carbon emission targets, thereby seeking to strike a delicate balance between carbon emissions and economic growth.
At present, the Intergovernmental Panel on Climate Systematization (IPCC) has published six assessment reports (AR6). It is reported in AR6 that global surface temperature was around 1.1°C above 1850-1900 in 2011-2020, with larger increases over land (1.59 [1.34 to 1.83]°C) than over the ocean (0.88 [0.68 to 1.01]°C), while the global surface temperature in 2001–2020 was 0.99 [0.84 to 1.10]°C higher than 1850-1900, which shows that the global temperature is still continuing to rise.
With the gradual increase of the influence, the study of global temperature variability has been paid more and more attention by more and more governments and research institutions and has become an important topic in the study of climate variability. The global climate system model of the current stage is an important tool for modelling the climate of the current generation and predicting the climate change under different discharge conditions. The climatological models can be used to model and predict upcoming temperature changes, and its reliability has long been concerned by the authorities. The Coupled Model Intercomparison Project Phase (CMIP) [4], organized by the World Climate Research Program, aims to perform a multimode comparison under a uniform frame.
The main focus of this paper is to provide an overview of the past climate change with carbon dioxide emission and the simulation projections of the 21st century RCP scenarios to provide estimates of carbon emissions on global climate change and impacts on economics globally and in China and the US. By correlating the historical data and the projections, the study tries to elucidate the correlations between the carbon emission and the policy assignment. It is proposed in this paper that each country should develop their own short-term and long-term strategies to guide economies aiming to reconcile economic aspirations with environmental prudence, ensuring that future growth does not come at the expense of ecological integrity. It is even more important to stimulate public awareness of the balance between industrial development and ecological sustainability, as well as intergovernmental consensus on economic prosperity and environmental sustainability.
2. Data and methods
2.1. Observational data
Global annual temperature anomaly data is obtained from the Ourworldindata Archive (link: www.ourworldindata.org) [1], including upper and lower bound (95% confidence interval) from 1990 to 2021. Annual change of CO2 concentration and emission data globally are downloaded from https://carbonmonitor.org/ (Table 1).
Table 1. Data of global temperature anomalies with CO2 concentration and emission.
Year | Temperature Anomaly/℃ | Upper bound (95% confidence interval) | Lower bound (95% confidence interval) | CO2 concentration / ppm | CO2 emission / billion t |
1990 | 0.36 | 0.40 | 0.32 | 354.05 | 22.76 |
1991 | 0.34 | 0.37 | 0.30 | 355.39 | 23.24 |
1992 | 0.12 | 0.16 | 0.09 | 356.09 | 22.58 |
1993 | 0.17 | 0.20 | 0.13 | 356.83 | 22.81 |
1994 | 0.23 | 0.27 | 0.20 | 358.33 | 22.97 |
1995 | 0.38 | 0.41 | 0.34 | 360.17 | 23.46 |
1996 | 0.28 | 0.31 | 0.24 | 361.93 | 24.16 |
1997 | 0.42 | 0.45 | 0.39 | 363.05 | 24.30 |
1998 | 0.58 | 0.61 | 0.54 | 365.70 | 24.21 |
1999 | 0.32 | 0.36 | 0.29 | 367.80 | 24.73 |
2000 | 0.33 | 0.36 | 0.30 | 368.96 | 25.45 |
2001 | 0.49 | 0.52 | 0.46 | 370.57 | 25.67 |
2002 | 0.54 | 0.57 | 0.51 | 372.59 | 26.28 |
2003 | 0.54 | 0.58 | 0.51 | 375.15 | 27.65 |
2004 | 0.47 | 0.50 | 0.43 | 376.95 | 28.64 |
2005 | 0.61 | 0.64 | 0.58 | 378.98 | 29.61 |
2006 | 0.57 | 0.60 | 0.54 | 381.15 | 30.59 |
2007 | 0.59 | 0.62 | 0.56 | 382.90 | 31.51 |
2008 | 0.47 | 0.50 | 0.43 | 385.02 | 32.09 |
2009 | 0.60 | 0.63 | 0.57 | 386.50 | 31.56 |
2010 | 0.68 | 0.71 | 0.65 | 388.76 | 33.36 |
2011 | 0.54 | 0.57 | 0.51 | 390.64 | 34.49 |
2012 | 0.58 | 0.61 | 0.54 | 392.65 | 35.01 |
2013 | 0.62 | 0.66 | 0.59 | 395.40 | 35.32 |
2014 | 0.67 | 0.71 | 0.64 | 397.35 | 35.58 |
2015 | 0.83 | 0.86 | 0.79 | 399.65 | 35.56 |
2016 | 0.93 | 0.96 | 0.90 | 403.06 | 35.52 |
2017 | 0.85 | 0.88 | 0.81 | 405.22 | 36.10 |
2018 | 0.76 | 0.79 | 0.73 | 407.61 | 36.83 |
2019 | 0.89 | 0.93 | 0.86 | 410.07 | 37.08 |
2020 | 0.92 | 0.96 | 0.89 | 412.44 | 35.26 |
2021 | 0.76 | 0.80 | 0.73 | 414.70 | 37.12 |
Table 2. Data of China temperature anomaly, CO2 emission, population, and GDP.
Year | Temperature Anomaly/ ℃ | CO2 emission /billion t | population / million | GDP /10^12 USD |
1990 | 0.67 | 2.48 | 1150 | 0.36 |
1991 | 0.52 | 2.61 | 1170 | 0.38 |
1992 | 0.39 | 2.73 | 1180 | 0.43 |
1993 | 0.00 | 2.92 | 1200 | 0.44 |
1994 | 0.46 | 3.10 | 1210 | 0.56 |
1995 | 0.63 | 3.36 | 1220 | 0.73 |
1996 | -0.01 | 3.50 | 1230 | 0.86 |
1997 | 0.39 | 3.51 | 1240 | 0.96 |
1998 | 1.26 | 3.36 | 1250 | 1.03 |
1999 | 0.75 | 3.55 | 1260 | 1.09 |
2000 | 0.99 | 3.64 | 1260 | 1.21 |
2001 | 0.78 | 3.72 | 1270 | 1.34 |
2002 | 0.95 | 4.11 | 1280 | 1.47 |
2003 | 0.99 | 4.83 | 1290 | 1.66 |
2004 | 0.86 | 5.22 | 1300 | 1.96 |
2005 | 1.15 | 5.88 | 1300 | 2.29 |
2006 | 1.02 | 6.49 | 1310 | 2.75 |
2007 | 1.14 | 6.98 | 1320 | 3.55 |
2008 | 0.21 | 7.50 | 1330 | 4.59 |
2009 | 0.40 | 7.89 | 1340 | 5.10 |
2010 | 0.69 | 8.62 | 1350 | 6.09 |
2011 | 0.53 | 9.53 | 1360 | 7.55 |
2012 | 1.45 | 9.78 | 1370 | 8.53 |
2013 | 0.61 | 9.96 | 1380 | 9.57 |
2014 | 0.50 | 10.00 | 1390 | 10.48 |
2015 | 1.53 | 9.87 | 1390 | 11.06 |
2016 | 2.22 | 9.76 | 1400 | 11.23 |
2017 | 1.43 | 10.01 | 1410 | 12.31 |
2018 | 1.27 | 10.35 | 1420 | 13.89 |
2019 | 1.03 | 10.74 | 1420 | 14.28 |
2020 | 1.33 | 10.96 | 1420 | 14.69 |
2021 | 1.17 | 11.47 | 1430 | 17.73 |
Table 3. Data of US temperature anomaly, CO2 emission, population, and GDP.
Year | Temperature Anomaly / ℃ | CO2 emission / billion t | population / million | GDP / 10^12 USD |
1990 | 0.85 | 5.12 | 248 | 5.96 |
1991 | 0.51 | 5.06 | 252 | 6.16 |
1992 | 0.11 | 5.18 | 255 | 6.52 |
1993 | 0.27 | 5.27 | 259 | 6.86 |
1994 | 0.72 | 5.37 | 262 | 7.29 |
1995 | 0.56 | 5.43 | 266 | 7.64 |
1996 | 0.20 | 5.62 | 269 | 8.07 |
1997 | 0.72 | 5.69 | 272 | 8.58 |
1998 | 1.25 | 5.74 | 276 | 9.06 |
1999 | 1.21 | 5.81 | 279 | 9.63 |
2000 | 0.55 | 6.02 | 282 | 10.25 |
2001 | 1.02 | 5.91 | 285 | 10.58 |
2002 | 1.11 | 5.95 | 288 | 10.93 |
2003 | 0.80 | 6.02 | 291 | 11.46 |
2004 | 1.09 | 6.12 | 294 | 12.22 |
2005 | 1.02 | 6.14 | 297 | 13.04 |
2006 | 1.21 | 6.06 | 300 | 13.82 |
2007 | 1.51 | 6.14 | 303 | 14.47 |
2008 | 1.06 | 5.92 | 306 | 14.77 |
2009 | 1.31 | 5.48 | 309 | 14.48 |
2010 | 0.94 | 5.68 | 311 | 15.05 |
2011 | 0.76 | 5.55 | 314 | 15.60 |
2012 | 0.60 | 5.35 | 317 | 16.25 |
2013 | 1.05 | 5.48 | 319 | 16.84 |
2014 | 1.04 | 5.53 | 322 | 17.55 |
2015 | 1.28 | 5.38 | 325 | 18.21 |
2016 | 1.31 | 5.25 | 327 | 18.70 |
2017 | 1.57 | 5.21 | 330 | 19.48 |
2018 | 1.35 | 5.38 | 332 | 20.53 |
2019 | 1.41 | 5.26 | 334 | 21.37 |
2020 | 1.64 | 4.72 | 336 | 20.89 |
2021 | 1.71 | 5.01 | 337 | 23.00 |
2.2. RCP scenarios
The Representative Concentration Pathway (RCP) [5] is a simulation used to describe the impact of human activities on the atmospheric environment in the future. RCP refers to the influence of different greenhouse gas concentrations on global mean temperature change and is currently used as a benchmark scenario in the international climate simulation. The RCPs consists of one high-emission scenario (8.5, RCP8.5), two moderate-emission scenarios (6.0, RCP6.0), and one low-emission scenario (2.6, RCP2.6). RCP8.5 causes the largest temperature rise, followed by RCP6.0, RCP4.5, and RCP2.6 has the least impact on global warming.
This study collected the temperature anomaly, concentration, and annual emissions of carbon dioxide (measured in tons), the real GDP per capita (measured in current US dollars) and population of each country and listed in tables and combine into curves, as shown in the figures. The data of carbon emissions is adapted from https://ourworldindata.org/grapher/co-emissions-per-capita. The GDP and population data are downloaded from https://data.worldbank.org/indicator/NY.GDP.MKTP.CD [6].
3. Results and discussion
3.1. Historical change of climate and carbon emissions
Figure 2 shows the temperature anomaly and carbon emission of the past three decades in globally. The carbon dioxide concentration has been rising with temperature anomaly fluctuating upward.
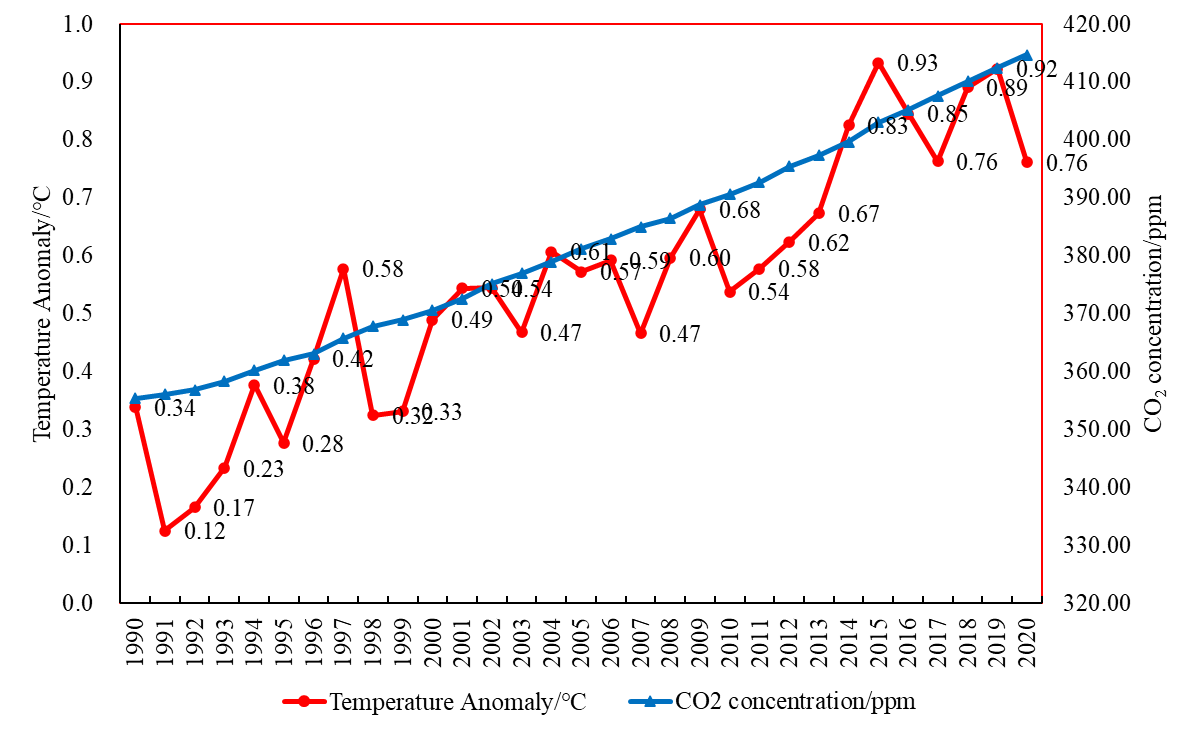
Figure 1. Global change of surface temperature anomalies and carbon concentration from 1990 to 2021. All the time series have been standardized.
Fig.2 shows the temperature anomaly and carbon emission of the past three decades in US and China, respectively. The carbon emissions in the US are constant with temperature increases below 1.5 ℃. Before year 2005, the carbon emission in China is lower than the US, and a sharp increase happened after that period which reflects the rapid industrial development contributed largely to the carbon emission.
As shown in Fig. 2(d), the economic growth of China and the US has shown comprehensive changes during the past 30 years since 1990. China’s GDP has thrived the most during this period. While the GDP per capita will not show much increase due to the rising population of about 200 million as shown in Fig.2(c). As a contrary, America’s GDP also experiences massive elevation of 20000 billion and the GDP per capita also boomed especially since 2000, given that the population of the United States only expanded less than 100 million, half of that in China.
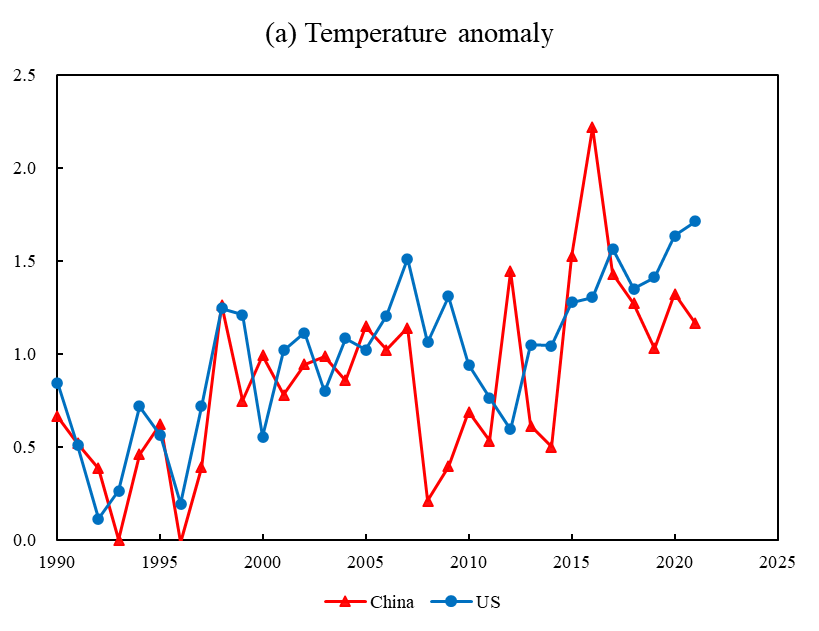
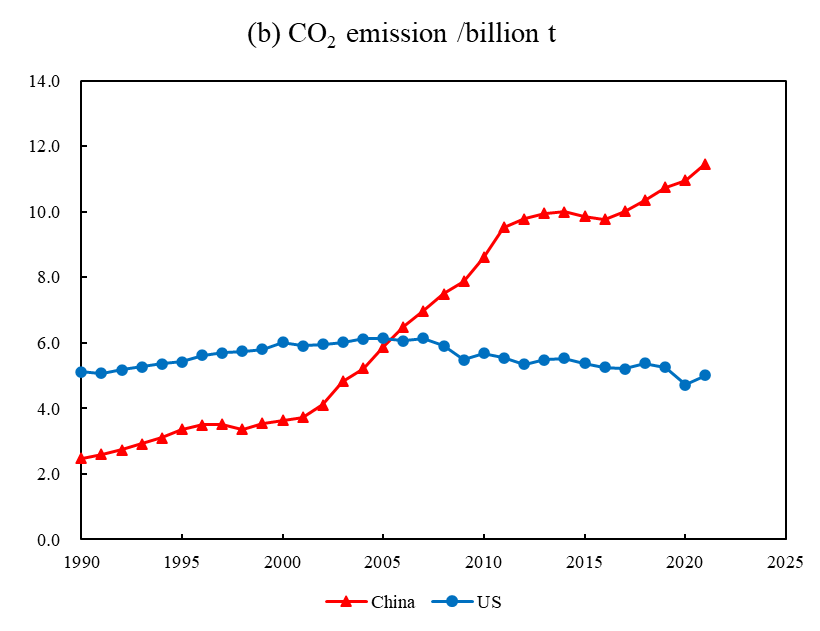
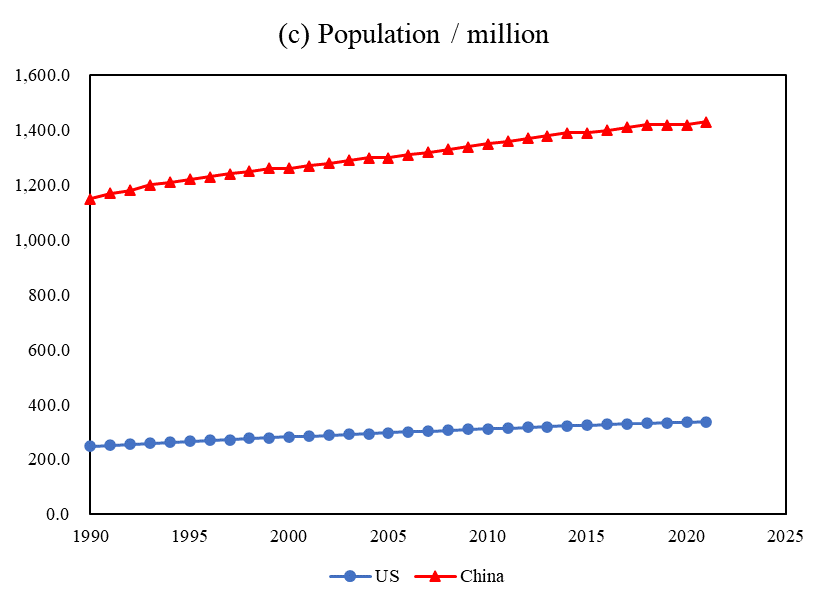
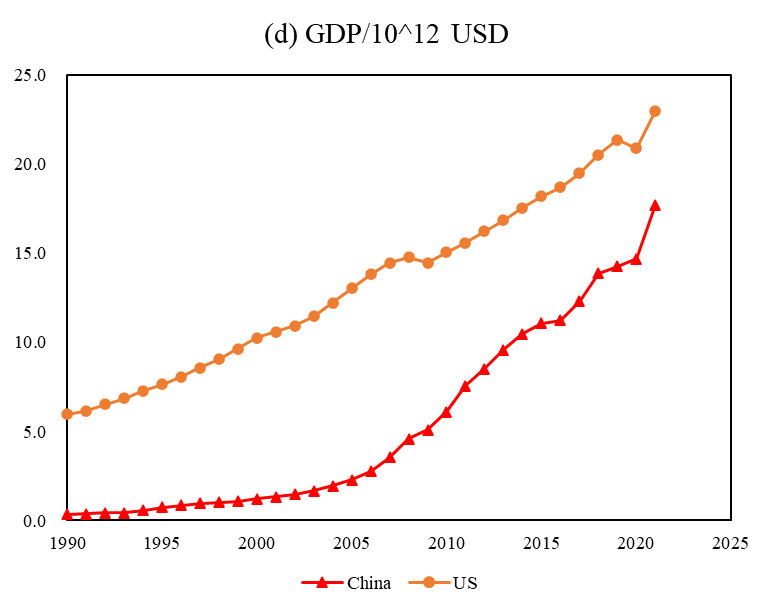
Figure 2. US-China Comparison in terms of (a) Temperature anomaly; (b) CO2 emission; (c) Population; (d) GDP.
3.2. Contribution of carbon emission from different sectors
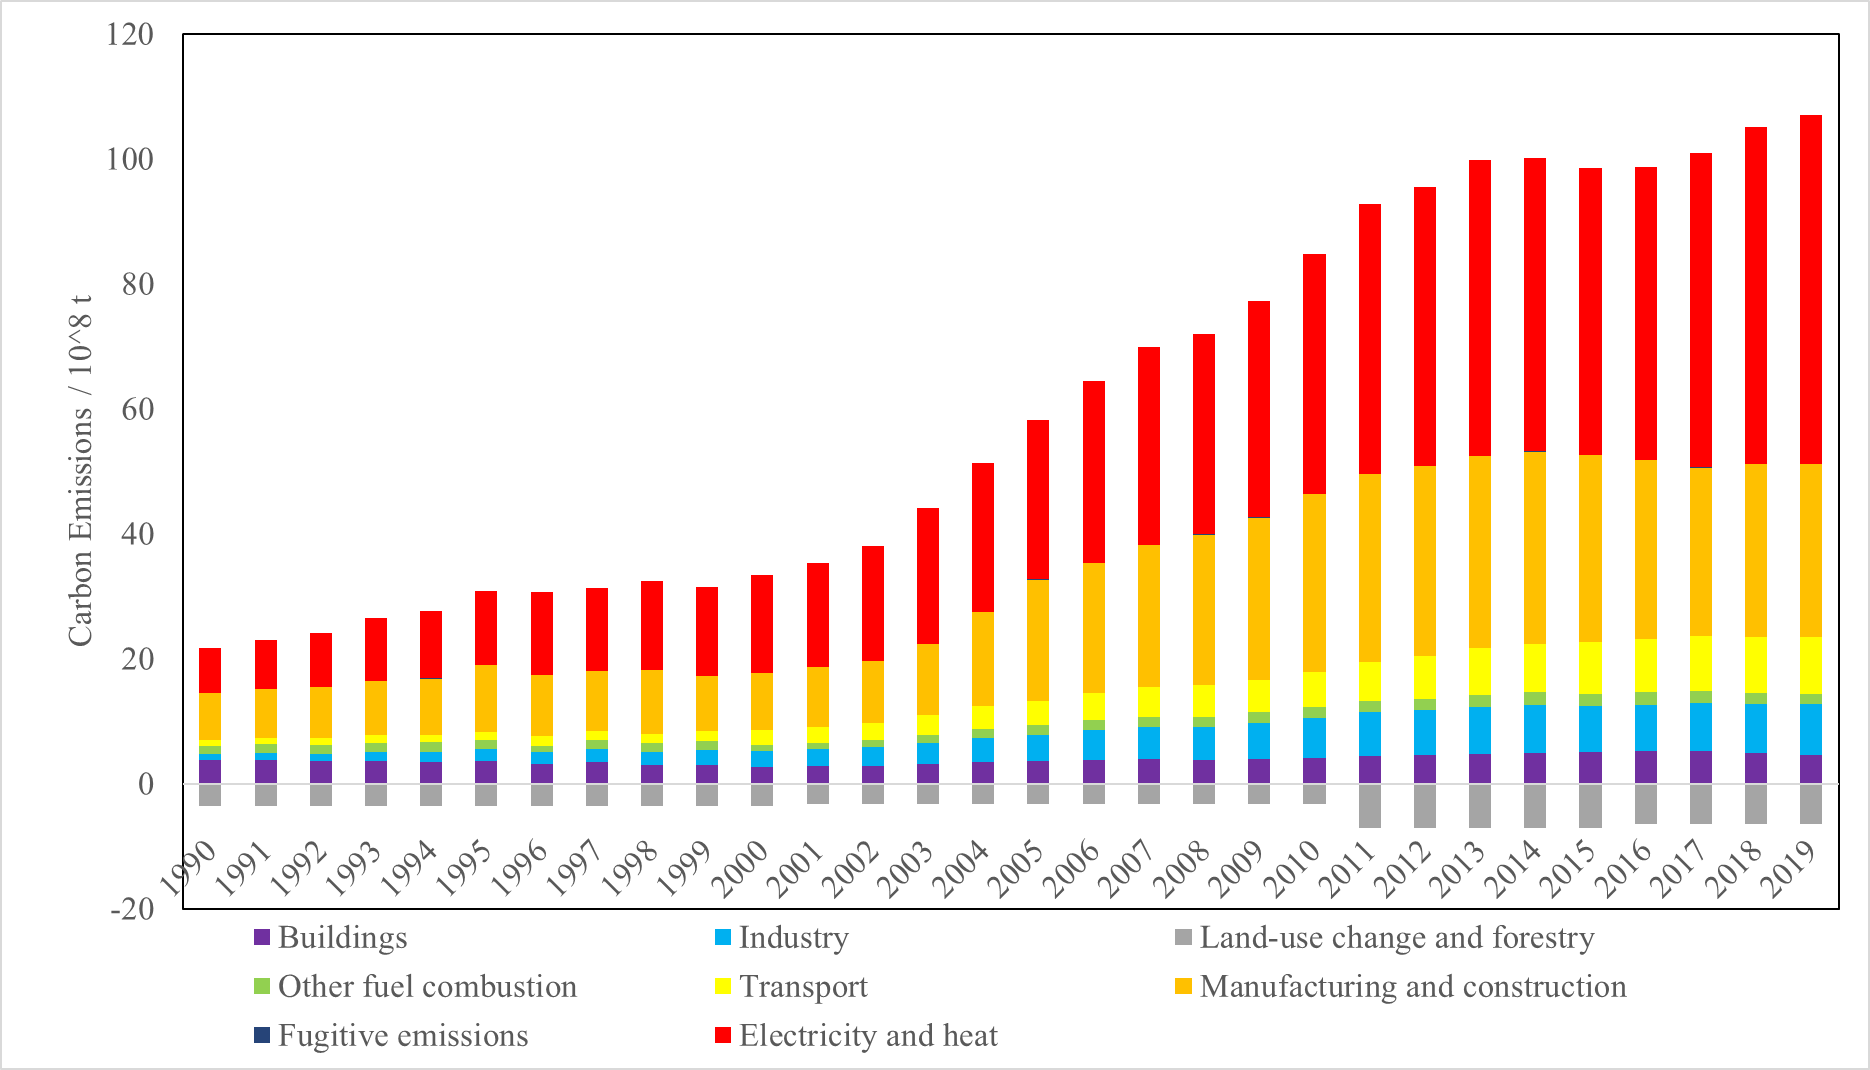
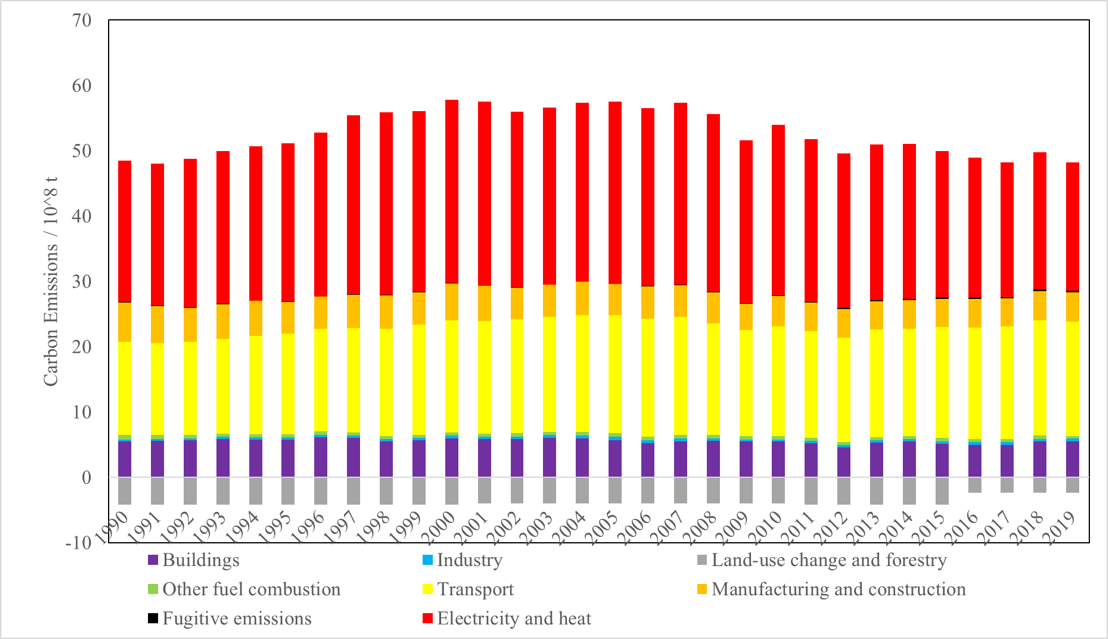
As shown in Fig. 3, CO2 emission variations in 2019 to 2021 are different from each origin both in China and United States. Overall, China shows continuing upward changing in CO2 emissions in the past decades, while CO2 emissions in the US are more stable along time. The CO2 emissions in China underwent a surge since 2002 and reached the highest in 2013, which due to the increasingly number of car ownership and the consumption of electricity and power along with the rapid economic development. The United States has relatively stabilized their carbon emissions during 1990 to 2020, while there is a considerable gap between the total amount of their emissions.
|
|
Figure 3. Carbon emissions by sectors from 1990 to 2021 in (a) China and (b) United States.
3.3. Future global surface temperature and carbon concentration projections
Based on the CMIP5 long-term and short-term modelling experiments [5], future global carbon dioxide concentrations of and surface temperature relative to the average of year 1985-2005 under different Representative Concentration Pathways (RCPs) scenarios from year 2000 to 2300 are shown in Fig. 4 [7].
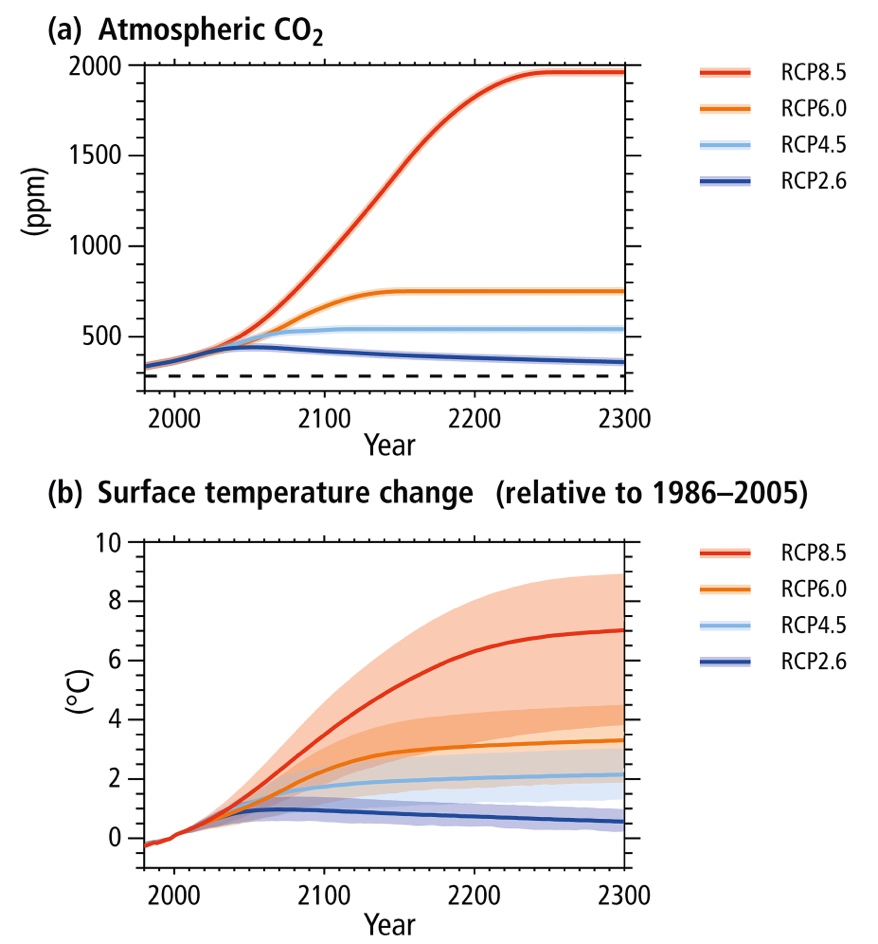
Figure 4. Future CO2 concentrations and global surface temperature change under different RCP scenarios [7].
It can be seen from Fig. 4 that the simulated global surface temperature changes are between 0.9 and 1.3 ℃ between 1990 and 2021, while the observed temperature changes are between 0.12 and 0.93 ℃ shown in Fig. 1. If governments do not take efficient measures to limit the emission of greenhouse gases such as carbon dioxide, carbon concentration on Earth will reach alarming levels around 2050. But the government’s efforts to limit greenhouse gas emissions would, at best, peak in 2050 and then gradually begin to decline (RCP2.6). In the RCP2.6 scenarios, the global surface temperature changes in all simulations stay below the 2 ℃ threshold till 2300. In the simulations under RCP4.5 and RCP6.0 scenarios, the average global surface temperature changes will be between 1.3 to 4.5 ℃ relative to 1986–2005 mean temperature. By the year 2300, the temperature change range will be 0.2-1.0, 1.2-2.0, 3.5-4.3 and 3.0-8.5 ℃ under RCP 2.6, 4.5, 6.0 and 8.5, respectively. The simulated global warming in all scenarios relative to the 1986-2005 mean temperature ranges from 0.4 to 2.0 ℃ in 2050. In the RCP2.6 scenario, the warming increases from 0.4 ℃ to peak 1.1 ℃ in 2050, then decreases to 0.2–1.0 ℃ by 2100. For RCP4.5 and RCP6.0 scenarios, the global mean surface temperature change increases and exceeds 1 ℃ in 2100. More seriously, the warming in RCP8.5 approaches 3.7 ℃ by 2100.
In Paris Agreements, temperature increase of 2 ℃ above the preindustrial surface air temperature was first proposed as the ‘‘dangerous’’ threshold of climate change [8]. It can be concluded from Fig.4 that only the global surface temperature changes under RCP2.6 is below 2 ℃ by the end of the 21st century for all the years in the future, which is achieved because of the CO2 emissions decreasing at the middle of the 21st century shown in Fig. 4(a). In the RCP4.5 scenario, the simulated warming in 21st century is close to the threshold, while the simulated surface temperature changes are between 2.5 and 4.5 ℃exceeding the threshold greatly.
4. Conclusion and Implication
Based on historical data and model-based climate projections, this paper analyzes and discusses the characteristics of carbon emissions and surface temperature anomaly both in China and the United States in the past 30 years. Then the sources of carbon emissions, surface temperature anomaly, the law of population and GDP growth were compared. The climate projections under different RCPs were simulated with CMIP5 to correlate between carbon emissions and surface temperature anomaly in the two countries in the future. The results suggest that simulated global surface temperature change warming that ranges from 0.9 to 1.3 between 1990 and 2021 agrees well with the observed temperature increase as 0.93℃. Only the simulated surface temperature anomalies relative to (1986–2005) mean temperature under RCP2.6 scenario are below 2 ℃ by the end of the 21st century. By the year 2300, the temperature change range will be 0.2-1.0, 1.2-2.0, 3.5-4.3 and 3.0-8.5 ℃ under RCP 2.6, 4.5, 6.0 and 8.5, respectively. This study also analyzed the relationship of economic growth and the carbon emissions of China and the US during the past 30 years. Though GDP of China and the US both thrived the most during this period, the GDP per capita of China will not show much increase due to almost twice the population growth than that of the US.
Keeping the global average temperature change to well below 2 °C above pre-industrial levels has been approved by countries throughout the world, many of them are taking actions to achieving the targets of net-zero emissions or neutrality [9]. It is agreed that limiting global warming to 1.5°C is safer for climate change and climate-related risks compared to the global warming of 2°C. However, IPCC’s Sixth Assessment Report points out that global warming will still exceed 2°C during the 21st century if no further sustained and effective CO2 emission reduction action take place in the coming decades. The pathways to net-zero that different countries implement influenced the goal achievement directly [10, 11]. Getting to net-zero emissions globally relies on the joint efforts of all counties because that positive and negative carbon emissions are balanced processes in the global atmosphere [12, 13]. In the face of the global climate challenge, countries are committing to get to carbon neutrality and emissions reductions, which represents a global move towards sustainable development and lays the foundation for future climate action.
Referencing to the results of this study also shows that there are many different aspects to the relationship between carbon emissions and economic growth. Economic growth and carbon emissions trends in China and the United States reflect the link between rising carbon emissions and economic growth, but China’s rapid economic growth has come at an environmental cost in the past. The timing in achieving net-zero and the opportunities of countries to contribute to reaching net-zero emissions are different. The US experience shows how important it is to enact smart policies and switch to cleaner energy sources in order to reduce carbon emissions and spur economic growth. For countries like China, it is imperative to maintain a balance between economic growth and environmental sustainability, reducing carbon emissions while achieving their economic goals. The practical way is to improve energy efficiency, invest in renewable energy and environmentally friendly industrial practices [14], such as green low-carbon energy transformation action, energy conservation, carbon reduction and efficiency improvement action, urban and rural construction and transportation green low-carbon transformation action, etc. Indicators such as energy consumption per unit of GDP, CO2 emissions per unit of GDP, proportion of non-fossil energy consumption, forest cover and forest stock should be used to measure progress towards carbon neutrality, which are more intuitive to reflect and detect the achievement of carbon neutrality.
References
[1]. IPCC, 2023: Sections. In: Climate Change 2023: Synthesis Report. Contribution of Working Groups I, II and III to the Sixth Assessment Report of the Intergovernmental Panel on Climate Change [Core Writing Team, H. Lee and J. Romero (eds.)]. IPCC, Geneva, Switzerland, pp. 35-115, doi: 10.59327/IPCC/AR6-9789291691647
[2]. Annual CO₂ emissions. (n.d.). Our World in Data. https://ourworldindata.org/grapher/annual-CO2-emissions-per-country?facet=none&country=~OWID_WRL
[3]. Climate Change Impacts Data Explorer. (n.d.). Our World in Data. https://ourworldindata.org/ explorers/climate-change?facet=none&country=OWID_WRL~ATA~Gulkana+Glacier~ Lemon+Creek+Glacier~OWID_NAM~South+Cascade+Glacier~Wolverine+Glacier&Metric=Temperature+anomaly&Long-run+series=false
[4]. Miller, R. L., et al. (2014), CMIP5 historical simulations (1850–2012) with GISS ModelE2, J. Adv. Model. Earth Syst., 6, 441–477, doi:10.1002/2013MS000266.
[5]. van Vuuren, D. P., et al. (2011a), The representative concentration pathways: An overview, Clim. Change, 109, 5–31, doi:10.1007/s10584-011-0148-z.
[6]. GDP per capita. (n.d.). Our World in Data. https://ourworldindata.org/grapher/gdp-per-capita-maddison?tab=chart&yScale=log&time=1950..latest&country=USA~JPN~KOR~POL~ROU~THA~BWA~CHN
[7]. IPCC, 2013: Annex II: Climate System Scenario Tables [Prather, M., G. Flato, P. Friedlingstein, C. Jones, J.-F. Lamarque, H. Liao and P. Rasch (eds.)]. In: Climate Change 2013: The Physical Science Basis. Contribution of Working Group I to the Fifth Assessment Report of the Intergovernmental Panel on Climate Change [Stocker, T.F., D. Qin, G.-K. Plattner, M. Tignor, S.K. Allen, J. Boschung, A. Nauels, Y. Xia, V. Bex and P.M. Midgley (eds.)]. Cambridge University Press, Cambridge, United Kingdom and New York, NY, USA.
[8]. Meinshausen, M., N. Meinshuasen, W. Hare, S. C. Raper, K. Frieler, R. Knutti, D. J. Frame, and M. R. Allen (2009), Greenhouse emission targets for limiting global warming to 2 ℃, Nature, 458, 1158–1163.
[9]. Paris Agreement (2015), Paris Agreements, https://treaties.un.org/pages/ViewDetails.aspx?src= TREATY&mtdsg_no=XXVII-7-d&chapter=27.
[10]. UNFCCC (2016), Decision 1/CP.21: Adoption of the Paris Agreement, Report of the Conference of the Parties on its twenty-first session, held in Paris from 30 November to 13 December 2015, Addendum, Part two: Action taken by the Conference of the Parties at its twenty-first session, UNFCCC Secretariat, Bonn, https://unfccc.int/resource/docs/2015/cop21/eng/10a01.pdf (accessed on 30 April 2021).
[11]. Sirini Jeudy-Hugo (OECD), Luca Lo Re (IEA) and Chiara Falduto (OECD). Understanding Countries’ Net-Zero Emissions Targets. Climate Change, Expert Group, Paper No.2021(3).
[12]. Foen, F. O. F. T. E. (n.d.). Long-term climate strategy to 2050. https://www.bafu.admin. ch/bafu/en/home/topics/climate/info-specialists/emission-reduction/reduction-targets/2050-target/climate-strategy-2050.html
[13]. Rogelj, J. et al. (2021), “Net-zero emissions targets are vague: three ways to fix”, Nature, Vol. 591/7850, http://dx.doi.org/10.1038/d41586-021-00662-3.
[14]. An energy sector roadmap to carbon neutrality in China-Analysis-IEA. (n.d.). IEA. https://www.iea.org/reports/an-energy-sector-roadmap-to-carbon-neutrality-in-china
Cite this article
Xue,L. (2024). Historical and Future global warming under different RCP emission scenarios. Applied and Computational Engineering,63,34-44.
Data availability
The datasets used and/or analyzed during the current study will be available from the authors upon reasonable request.
Disclaimer/Publisher's Note
The statements, opinions and data contained in all publications are solely those of the individual author(s) and contributor(s) and not of EWA Publishing and/or the editor(s). EWA Publishing and/or the editor(s) disclaim responsibility for any injury to people or property resulting from any ideas, methods, instructions or products referred to in the content.
About volume
Volume title: Proceedings of the 4th International Conference on Materials Chemistry and Environmental Engineering
© 2024 by the author(s). Licensee EWA Publishing, Oxford, UK. This article is an open access article distributed under the terms and
conditions of the Creative Commons Attribution (CC BY) license. Authors who
publish this series agree to the following terms:
1. Authors retain copyright and grant the series right of first publication with the work simultaneously licensed under a Creative Commons
Attribution License that allows others to share the work with an acknowledgment of the work's authorship and initial publication in this
series.
2. Authors are able to enter into separate, additional contractual arrangements for the non-exclusive distribution of the series's published
version of the work (e.g., post it to an institutional repository or publish it in a book), with an acknowledgment of its initial
publication in this series.
3. Authors are permitted and encouraged to post their work online (e.g., in institutional repositories or on their website) prior to and
during the submission process, as it can lead to productive exchanges, as well as earlier and greater citation of published work (See
Open access policy for details).
References
[1]. IPCC, 2023: Sections. In: Climate Change 2023: Synthesis Report. Contribution of Working Groups I, II and III to the Sixth Assessment Report of the Intergovernmental Panel on Climate Change [Core Writing Team, H. Lee and J. Romero (eds.)]. IPCC, Geneva, Switzerland, pp. 35-115, doi: 10.59327/IPCC/AR6-9789291691647
[2]. Annual CO₂ emissions. (n.d.). Our World in Data. https://ourworldindata.org/grapher/annual-CO2-emissions-per-country?facet=none&country=~OWID_WRL
[3]. Climate Change Impacts Data Explorer. (n.d.). Our World in Data. https://ourworldindata.org/ explorers/climate-change?facet=none&country=OWID_WRL~ATA~Gulkana+Glacier~ Lemon+Creek+Glacier~OWID_NAM~South+Cascade+Glacier~Wolverine+Glacier&Metric=Temperature+anomaly&Long-run+series=false
[4]. Miller, R. L., et al. (2014), CMIP5 historical simulations (1850–2012) with GISS ModelE2, J. Adv. Model. Earth Syst., 6, 441–477, doi:10.1002/2013MS000266.
[5]. van Vuuren, D. P., et al. (2011a), The representative concentration pathways: An overview, Clim. Change, 109, 5–31, doi:10.1007/s10584-011-0148-z.
[6]. GDP per capita. (n.d.). Our World in Data. https://ourworldindata.org/grapher/gdp-per-capita-maddison?tab=chart&yScale=log&time=1950..latest&country=USA~JPN~KOR~POL~ROU~THA~BWA~CHN
[7]. IPCC, 2013: Annex II: Climate System Scenario Tables [Prather, M., G. Flato, P. Friedlingstein, C. Jones, J.-F. Lamarque, H. Liao and P. Rasch (eds.)]. In: Climate Change 2013: The Physical Science Basis. Contribution of Working Group I to the Fifth Assessment Report of the Intergovernmental Panel on Climate Change [Stocker, T.F., D. Qin, G.-K. Plattner, M. Tignor, S.K. Allen, J. Boschung, A. Nauels, Y. Xia, V. Bex and P.M. Midgley (eds.)]. Cambridge University Press, Cambridge, United Kingdom and New York, NY, USA.
[8]. Meinshausen, M., N. Meinshuasen, W. Hare, S. C. Raper, K. Frieler, R. Knutti, D. J. Frame, and M. R. Allen (2009), Greenhouse emission targets for limiting global warming to 2 ℃, Nature, 458, 1158–1163.
[9]. Paris Agreement (2015), Paris Agreements, https://treaties.un.org/pages/ViewDetails.aspx?src= TREATY&mtdsg_no=XXVII-7-d&chapter=27.
[10]. UNFCCC (2016), Decision 1/CP.21: Adoption of the Paris Agreement, Report of the Conference of the Parties on its twenty-first session, held in Paris from 30 November to 13 December 2015, Addendum, Part two: Action taken by the Conference of the Parties at its twenty-first session, UNFCCC Secretariat, Bonn, https://unfccc.int/resource/docs/2015/cop21/eng/10a01.pdf (accessed on 30 April 2021).
[11]. Sirini Jeudy-Hugo (OECD), Luca Lo Re (IEA) and Chiara Falduto (OECD). Understanding Countries’ Net-Zero Emissions Targets. Climate Change, Expert Group, Paper No.2021(3).
[12]. Foen, F. O. F. T. E. (n.d.). Long-term climate strategy to 2050. https://www.bafu.admin. ch/bafu/en/home/topics/climate/info-specialists/emission-reduction/reduction-targets/2050-target/climate-strategy-2050.html
[13]. Rogelj, J. et al. (2021), “Net-zero emissions targets are vague: three ways to fix”, Nature, Vol. 591/7850, http://dx.doi.org/10.1038/d41586-021-00662-3.
[14]. An energy sector roadmap to carbon neutrality in China-Analysis-IEA. (n.d.). IEA. https://www.iea.org/reports/an-energy-sector-roadmap-to-carbon-neutrality-in-china


