


1. Introduction
As the second largest inland basin in China, the Heihe River Basin plays a crucial role in the ecosystem, agricultural irrigation and human life in the region. The uneven distribution of water resources and the irrational water use structure in the Heihe River Basin have been mitigated only in recent years through anthropogenic regulation, thus confirming its pivotal role in combating climate change [1].
Currently, there are two main ways to estimate surface evapotranspiration (ET) on a regional scale using remote sensing: one is to use the remotely sensed surface radiation temperature in combination with the air temperature and a series of impedance equations to derive the sensible heat flux, and then express the ET through the residual term of the energy balance, e.g., Su [1] Proposed surface energy balance models SEBS, SEBAL model [3];The second is based on the Penman-Monteith formula [4]. The surface conductance GS in the P-M formula is calculated by, for example, calculating the ground temperature-vegetation index, and the calculation of evapotranspiration is carried out directly (surface impedance Rs = 1/Gs) [5].
However, the successful application of the Penman-Monteith model in specific geographical contexts requires consideration of region-specific climatic, topographic and land-use characteristics in order to improve the accuracy and feasibility of monitoring. In addition, the development of modern technologies provides new opportunities for intelligent monitoring, including the use of remote sensing techniques and automatic weather stations, which can greatly improve the efficiency and accuracy of surface evapotranspiration monitoring. Therefore, the improvement of the PM-based model to enhance the applicability of the model in different surface ET inversions is of great theoretical significance for expanding the research scope of regional surface ET and improving the systematic composition of the regional surface energy balance [2].
The aim of this study is to explore the temporal and spatial changes of surface evapotranspiration (ET) in the Heihe River Basin based on the SE-PM dual-source model using atmospheric-driven data and Landsat data, and to provide more accurate information and support for water resource management in the basin. Since there is no evapotranspiration inversion model that can better monitor the temporal trend of surface evapotranspiration over decades, we used quantitative remote sensing techniques combined with the improved SE-PM model based on the P-M model [6]. Through the in-depth study of the model, we can better understand the spatial and temporal dynamics of evapotranspiration in the Heihe River Basin, which will help us to improve the efficiency of water resources, reduce the pressure on water resources, and promote the ecological balance and sustainable development of the society.
In recent years, due to the intensification of human activities[8,9], the ecological environment of the Heihe River Basin has continued to degrade.Land desertification and soil secondary salinisation are serious in the middle and lower reaches of the river, therefore, the study in this paper to estimate the evapotranspiration of the Heihe River Basin is of great significance to alleviate the desertification of the Heihe River Basin and to help ecological protection and environmental restoration of the Heihe River Basin.
2. Study area and data
2.1. Overview of the study area
The Heihe River basin is located in the Hexi Corridor, with geographical coordinates between 38°30’~41°50’N and 98°00’~101°00’E. The total area is about 142,900 square kilometres, of which about 80 per cent is located in Gansu Province, and the rest is distributed in Qinghai and Ningxia, making it one of the important inland river basins in China. Within the basin, under the influence of the westerly wind circulation and the polar cold air masses, the winters are cold and long, the summers are hot and short, the annual precipitation is small and concentrated, and the evaporation is large, presenting obvious arid characteristics, and the vegetation is mainly distributed in the grassland, scrub, and desert plants, which have a strong diversity of arid adaptability.
The Heihe River Basin is divided into upper, middle and lower reaches, with the upper reaches located in the Qilian Mountain area, the middle reaches in the Hexi Corridor and the lower reaches in the Ejina Plain. The main study area in the paper is the middle and lower reaches of the Heihe River Basin, which accounts for about 60% of the entire Heihe River Basin, and has relatively flat terrain, with the valley plains dominating the area, fertile soils, and long history of development of farming activities in the basin.
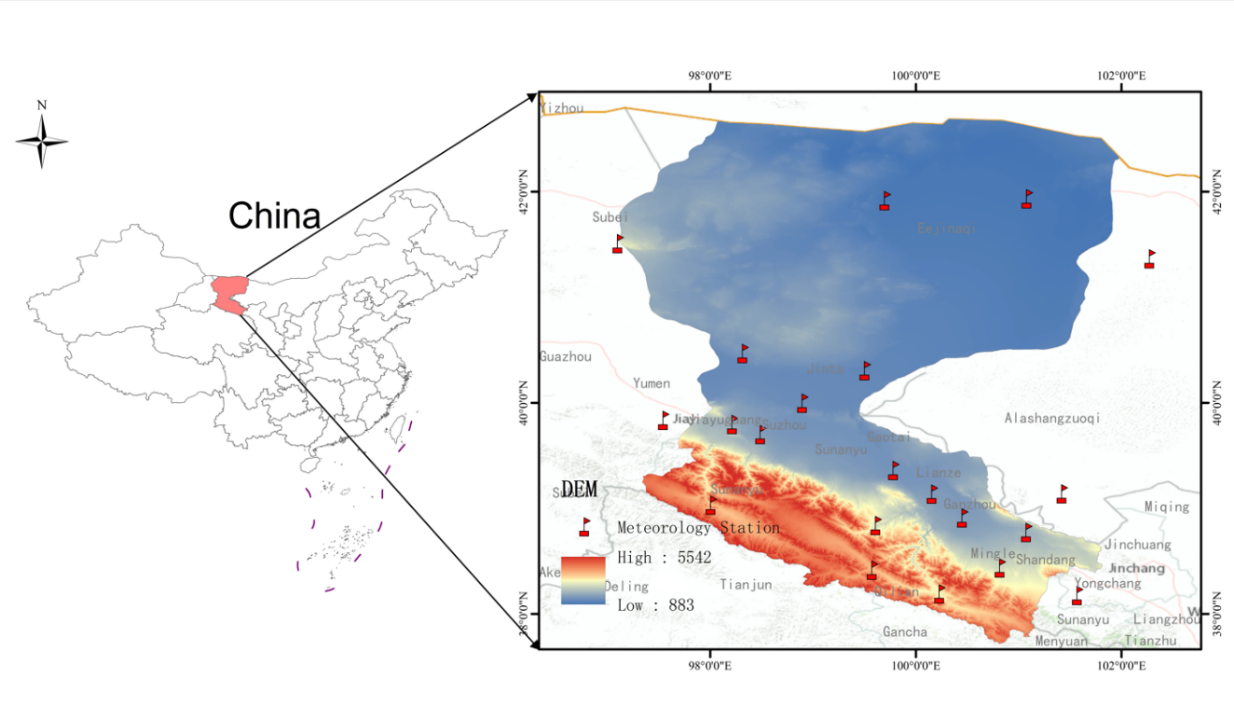
Figure 1. Schematic diagram of the Heihe River Basin and the location of the stations.
2.2. Data sources
2.2.1. Regional reanalysis data. The Black River Basin atmospheric drive data set (2000-2021) was selected. The near-surface atmospheric driving data of the Heihe River Basin is the driving data of the near-surface atmospheric elements such as hour-by-hour 0.05°× 0.05° including 2m air temperature, surface air pressure, 2m water-vapour mixing ratio, radiation, 10m wind field, and cumulative precipitation in the Heihe River Basin, which is prepared by using the Weather Research and Forecasting (WRF) model. By validating the data with day-by-day observations from 15 China Meteorological Administration (CMA) conventional automatic weather stations (CMA) stations and hour-by-hour observations from stations of the two phases of the Joint Experiment on Integrated Remote Sensing Observation of Ecological-Hydrological Processes in the Heihe River Basin (WATER and HiWATER) at different time scales, the following conclusions are drawn: 2m surface air temperature, surface air pressure and relative humidity are relatively plausible, especially the 2m surface The correlation coefficients of 2m surface air temperature, surface air pressure and relative humidity are more reliable, especially for 2m surface air temperature and surface air pressure, the average errors are very small and the correlation coefficients reach more than 0.96; the correlation between the downward short-wave radiation and the observation data of WATER reaches more than 0.9; the precipitation data are verified by the two phases, namely, rainfall and snowfall, with the observation data at different time and space scales, and the rainfall and the observation data match very well at the yearly, monthly, daily and hourly scales. The correlation coefficients with observations on the monthly scale are as high as 0.94 and 0.84; the correlation between snowfall and observations on the monthly scale reaches 0.78, which matches quite well with the spatial distribution of the MODIS remote sensing products of snow cover and the peak distribution is also consistent.
Pan, S. D.. (2020). Black River Basin Atmosphere-Driven Dataset (2000-2021). Spatio-Temporal Tripolar Environmental Big DataPlatform.
(https://doi.org/10.11888/Meteoro.tpdc.271245. ,https://cstr.cn/18406.11.Meteoro.tpdc.271245.)
2.3. Raw image data
The Landsat 8 OLI C2 L1 level product data were downloaded from the USGS website from 01 January 2013 to 30 December 2013, with cloudiness selected from 0% to 100%, and then inverted terrestrial Normalised Vegetation Indices (NVI) were selected for times when there was less cloudiness.
2.4. Data preprocessing and methodology
For the reanalysis data, the nc file was read using python to see all its variable and time storage formats and methods. Since the nc file takes time-by-time data storage, python reads the part of the nc file with variables needed to calculate ET for each day and converts the data into tif format so as to facilitate the calculation of ET. For the reanalysed data, a series of pre-processing is applied at the same time, such as projection transformation, re-sampling, cropping, and so on, of which, the projection is uniformly converted into WGS 1984 UTM zone 47N.For the data after Landast inversion, the same data pre-processing is done as above. For the Landast inversion data, the same data preprocessing was done as above.
3. Modelling mechanisms
3.1. PM two-source model
The PM model, developed by Wang et al. in 2010 [7], aims to address the current lack of inverse models that can effectively monitor temporal trends in surface evapotranspiration over decades. The model is based on the Penman-Monteith formula and introduces wind speed as a kinetic factor for calculating aerodynamic impedance. In addition, the SE-PM model combines meteorological data, remotely sensed data and field observation data, and introduces empirical coefficients to form a semi-physical and semi-empirical model for estimating surface ET.
The model successfully estimated global land surface evapotranspiration for the period 1982-2002.The SE-PM model divides the surface evapotranspiration into two main components: the energy control component (ETE) and the atmosphere control component (ETA). The model uses several meteorological factors, including shortwave radiation, air temperature, wind speed, vapour pressure inverse, relative humidity inverse, and satellite-inverted Normalised Vegetation Index (NDVI), to estimate surface ET at the global scale. By introducing dynamical factors such as wind speed and the combined use of multi-source data, the SE-PM model is able to take into account the influencing factors of surface evapotranspiration in a more comprehensive way, thus improving the accuracy of surface evapotranspiration and the ability to monitor the time-varying trend. This model is of great significance for the study of the Earth’s water cycle, climate change and water resource management.
\( E{T_{E}}=\frac{Δ}{Δ+γ}\cdot {R_{s}}\cdot [al+a2\cdot NDVI+RHD\cdot (a3+a4\cdot NDVI)]\ \ \ (1) \)
\( E{T_{A}}=\frac{γ}{Δ+γ}\cdot WS\cdot VPD\cdot [a5+RHD\cdot (a6+a7\cdot NDVI)]\ \ \ (2) \)
\( ET=a8\cdot (E{T_{E}}+E{T_{A}})+a9\cdot {(E{T_{E}}+E{T_{A}})^{2}}\ \ \ (3) \)
where NDVI is the normalised vegetation index obtained from satellite inversion, WS is the mean daily wind speed, RHD is the mean daily relative humidity deficit, R is the downward shortwave radiation, VPD is the water vapour pressure deficit, and al-a9 is the empirical coefficients derived from the observations of 64 flux sites around the globe in the order of:al=0.476,a2=0.284,a3=-0.654,a4-0.264,a5=3.06,a6=-3.86,a7=3.64,a8-0.819,a9=1.7x10。
The model is based on the PM formulation and takes into account the dynamical terms, has a certain physical mechanism, and has a high simulation accuracy. Compared with other complex physical models, the model is simple and easy to implement and takes into account different climatic conditions. The model also has some limitations in that wind speed, which is an important factor for the annual variation of ET, is considered, but it is not easy to obtain. The model performs well under different climatic conditions around the world, and has been validated at 64 global flux observation sites [8] [9], which can be used to monitor the time series changes of ET at the regional surface with good results, and is therefore selected as one of the models for estimating ET in the Heihe River Basin in our study.
3.2. Estimation of relevant parameters
The average daily temperature is the average of the day’s temperature, and in the paper the average temperature is the average of the day’s maximum and minimum temperatures:
\( {T_{mean}}=\frac{{T_{max}}+{T_{min}}}{2}\ \ \ (4) \)
\( T=t+273.16\ \ \ (5) \)
Where Tmean is the average daily air temperature (K), Tmax is the highest value of the day’s air temperature (K), and Tmin plus is the lowest value of the day’s air temperature (K). t is the Celsius temperature (°C), and T is the absolute temperature (K).
When air reaches equilibrium under specific temperature conditions, the water vapour in it is called saturated water vapour. The pressure of saturated water vapour is the partial pressure of water vapour in atmospheric pressure, i.e. water vapour pressure. The saturated water vapour pressure increases rapidly as the temperature rises. We can estimate the saturated water vapour pressure using the modified Magnus empirical formula. The specific formula is as follows:
\( {e_{s}}=0.6108×{e^{\frac{17.27t}{\overline{(t+237.3)}}}}\ \ \ (6) \)
In equation (6), es indicates the saturated water vapour pressure (KPa) at a specific temperature condition, and t is the Celsius air temperature (°C).
Relative humidity (RH) is the ratio of the actual water vapour pressure in the air to the saturated water vapour pressure at the same temperature condition, expressed as a percentage. The water vapour pressure deficit (DP) is the difference obtained by subtracting the saturated water vapour pressure from the actual water vapour pressure. Relative humidity deficit (RHD) is the result of subtracting 100 per cent from relative humidity expressed in absolute terms. Specific humidity (SH) is the ratio of the mass of water vapour contained in wet air to the total mass of air. Calculations are given in equations (7)--(9).
\( VPD=E-e\ \ \ (7) \)
\( RH=\frac{e}{E}×100\%=\frac{s}{S}×100°\ \ \ (8) \)
\( RHD=1-RH\ \ \ (9) \)
In the above equation, VPD indicates water vapour pressure deficit (Pa), saturated water vapour pressure (Pa) in the air under specific temperature conditions is indicated as E, e indicates actual water vapour pressure (Pa) under the same temperature conditions, RH indicates relative humidity (%), S indicates specific humidity (kg/kg), S indicates maximum specific humidity (kg/kg), RHD indicates relative humidity deficit (%), P indicates atmospheric pressure (Pa ). Therefore, the actual water vapour pressure can be calculated from the atmospheric pressure and specific humidity,see formula (10):
\( e=P×\frac{s}{0.622+0.378×s}\ \ \ (10) \)
The formula for calculating the slope of the saturated water vapour pressure curve at a given temperature is given in equation(11)。
\( Δ=\frac{4098×[0.6108×{e^{(\frac{17.27*t}{t+237.3})}}]}{{(t+237.3)^{2}}}\ \ \ (11) \)
In the above equation, Δ denotes the slope of the saturated water vapour pressure curve (kpa/°C) and t is the Celsius air temperature (°C).
In our study, we used a two-source model to estimate evapotranspiration (ET). The equations in this model calculate ET as an average value during the day, so it is necessary to calculate the average ET value for each day by taking into account the number of hours of sunshine and the time of day during a 24-hour period. However, the authors who developed the model note that this formula is typically applicable to large-area ET estimates on an inter-annual scale. The model does not work very well for the small regions in our present study and for short time series. Therefore, in our study, we have continually performed coefficient corrections for actual evapotranspiration for ET calculations to better fit our study population and time scales.
4. Result
4.1. Determination of model parameters
a9 is an empirical coefficient derived from observations at 64 flux sites around the globe, in the following order: al = 0.476, a2 = 0.284, a3 = 0.654, a4 = 0.264, a5 = 3.06, a6 = 3.86, a7 = 3.64, a8 = 0.819 and a9 = 1.7x10^(-3). Since the net radiation used in the calculations is the daily average during the day, the calculation of the daily average ET needs to be combined with the duration of sunshine and the 24-hour system. The empirical coefficients in the formula need to be modified and refined for the large region of the study area relative to the inter-annual time scale of the formula. The calculations are unified to modify only the empirical coefficients for calculating the actual ET to reduce the error.
4.2. Estimation and characterisation of actual ET
In this study, we hope to use the dual-source model formula to calculate the actual ET values in the small area of the oasis in the middle reaches of the Heihe River Basin, using Landsat 2013 data for four days respectively to represent the four seasons of a year, of which 09 April represents the daily actual ET value of a day in the spring, 21 July represents the daily actual ET value of a day in the summer, 09 October represents the daily actual ET value of a day in autumn, and 28 December represents the daily actual ET value of a day in the autumn. The actual ET values were obtained from the formula, where 09 April represents the daily actual ET values for a day in spring; 21 July represents the daily actual ET values for a day in summer; 09 October represents the daily actual ET values for a day in autumn; 28 December represents the daily actual ET values for a day in winter. Comparison of some images of actual ET obtained according to Eq. with the images at the same location of the day-by-day 100 m surface ET data (2010-2016) (HiTLL ET V1.0) in the Black River Basin, the maximum ET value on 09 April 2013 was 0.851691, while the maximum value of the product was 2.91186, which is obviously underestimated; the maximum ET value on 21 July 2013 was 8.05791, and the maximum value of the product was 2.91186, which is obviously underestimated. ET value is 8.05764, while the product ET maximum value is 10, again there is an underestimation; 09 October 2013 calculated ET maximum value is 4.04472, the product ET maximum value is 4.14679, there is an underestimation, but there is an overestimation in some areas; 28 December 2013 calculated ET maximum value is 0.233398, the product ET maximum value is 0.368902, relatively underestimated and with large errors. On a seasonal scale, ET values were highest in summer and lowest in winter.
4.3. Validation of model results
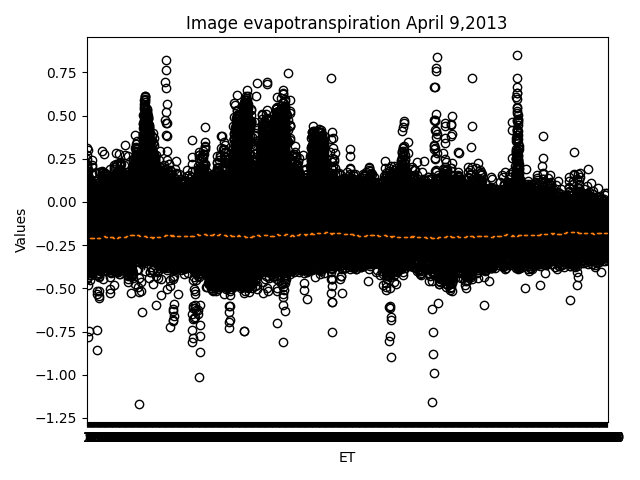
Figure 2. Bar chart comparing the true values of existing products as of April 9, 2013.
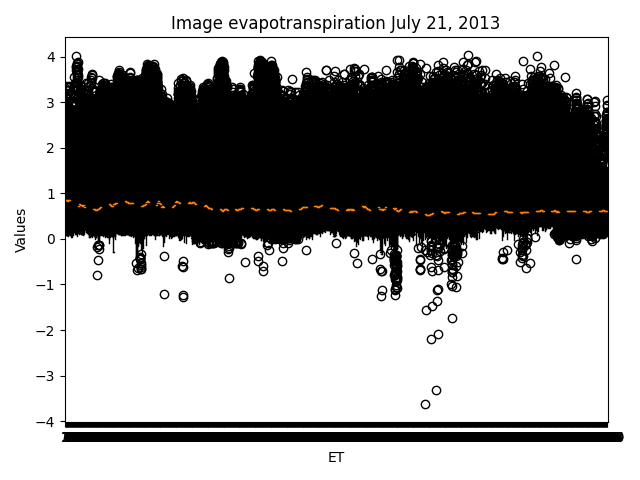
Figure 3. Bar chart comparing the true values of existing products as of July 21, 2013.
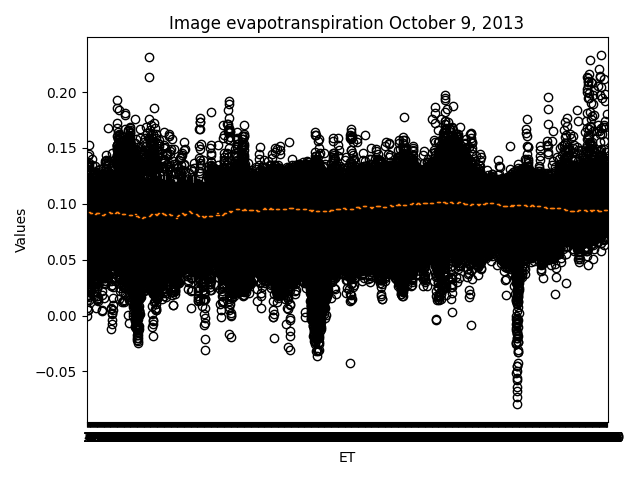
Figure 4.Bar chart comparing the true values of existing products as of October 9, 2013.
Validation of Model Results Figures 2, 3 and 4 show the contrasting values for different dates respectively, with outliers on 09/04. 21/07/2013 and 09/10/2013 have a better trend, but are still over- or under-estimated.
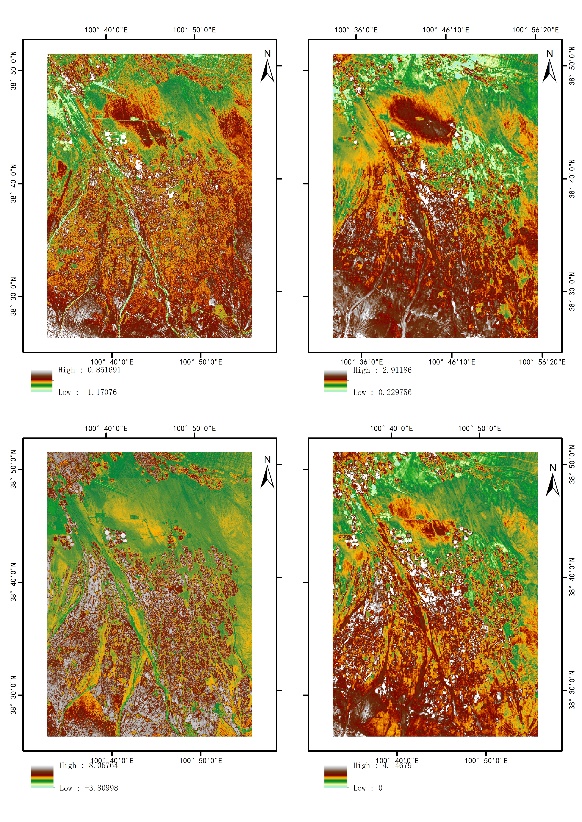
Figure 5. Comparison chart of calculations and actual values on April 9th and July 21st.
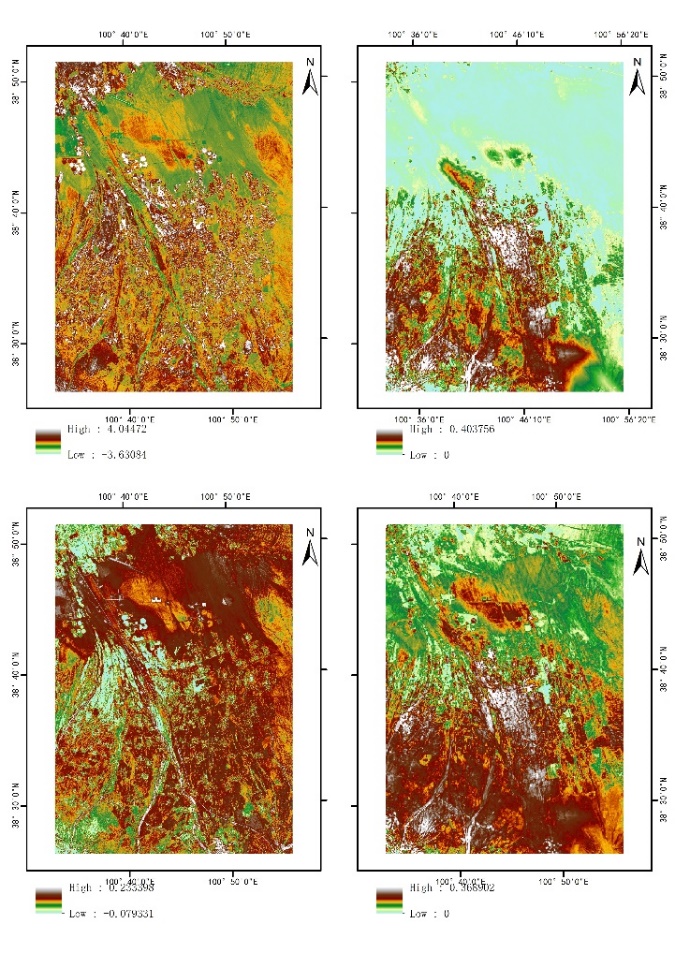
Figure 6. Comparison chart of calculations and actual values on October 9th and December 28th.
5. Conclusions
(1) Through comparative analyses, we find that the general trend of ET values calculated by the model is consistent with the actual observations. This indicates that the dual-source model has good consistency in simulating ET in this region, which provides a reliable numerical basis for an in-depth study of surface hydrological processes.
(2) In terms of seasonal variations, we observed that the ET is significantly higher in summer and autumn than in winter and spring, which is consistent with actual experience. This finding emphasises the effectiveness of the model in simulating seasonal hydrological processes, and provides a substantial reference basis for basin water resources management and planning.
(3) The results of this study indicate that the dual-source model has a good predictive effect of ET in a certain region. This provides a reliable tool and method for future hydrological modelling and meteorological prediction in the region.
(4) We should also note the limitations of the study. The accuracy of the model may be resounded by factors such as data quality and surface parameters. In future studies, the model parameters should be further optimised and combined with more observational data to improve the accuracy and applicability of the model.
In summary, this study provides a new perspective and empirical basis for the study of evapotranspiration in the oasis region in the middle reaches of the Black River Basin, and provides a useful reference for water resource management and sustainable development in the region. We expect more researchers in the future to further explore on this basis, continuously improve the model and its application, and promote the development of hydrological science.
6. Conclusion and outlook
Conclusion and Prospect Although the research in this paper has achieved good results in the prediction of evapotranspiration in the Black River Basin, there are still the following deficiencies:
(1) Uncertainty of data accuracy, on the one hand, the accuracy of the measuring instrument itself may have certain errors in practical application due to the influence of assumption conditions, on the other hand, the surface evapotranspiration process has many influencing factors and is affected by the weather, topography and other factors that are complex and variable, and the SE-PM model has high requirements for input data, which requires accurate meteorological data, such as temperature, humidity, wind speed, and so on.
(2) The accuracy of the model needs to be further studied. Some parameters in the SE-PM model need to be estimated, such as soil moisture, etc., and there is uncertainty in the estimation of these parameters; at the same time, the parameters and assumptions of the SE-PT model are established on the basis of specific environmental conditions, and it is impossible to accurately model some complex surface features and meteorological conditions when considering the energy balance, and its There are also differences in applicability, which may lead to differences between the model prediction results and the actual situation, and the practicality of the model in different regions and climatic conditions needs further verification and adjustment.
(3) The problem of scale effect of estimation, although this paper has achieved better inversion results on 30m resolution Landset data, the inversion effect on other spatial scales still needs further study, the SE-PM model is usually based on global scale prediction, and in the region, the spatial variations of the surface features and meteorological conditions are smaller, which requires more accuracy, and the application on the regional scale may have limitations, and therefore need to be properly adapted and improved for different scales.
References
[1]. CHAI Huixia, TAN Lihai,PAN Japeng. Characteristics of hydrology and water resources in the Heihe River Basin under the background of climate change[J/OL]. Water Resources and Hydropower Technology (in English and Chinese).1-9[2023-09-20].http://kns.cnki.net/kcms/detail/10.1746.TV.20230620.1044.008.html
[2]. Su.The Surface Energy Balance System forestimation of turbulent heat fluxes[J].Hydrology and Earth System Sciences, 2002, 6(1):85-99.
[3]. Bastiaanssen W G M , Menenti M , Feddes R A ,et al.A remote sensing surface energy balance algorithm for land (SEBAL). 1. Formulation[J].Journal of Hydrology, 1998, 212(1-4):198-212.DOI:10.1016/S0022-1694(98)00253-4.
[4]. Cleugh Helen A., Leuning Ray, Mu Qiaozhen, et al. Regional evaporation estimates from flux tower and MODIS satellite data[J]. Remote Sensing of Environment, 2007,106(3):285-304.
[5]. LI Hongxia,ZHANG Yongqiang,ZHANG Xinhua et al. Estimation of regional evapotranspiration by remote sensing Penman-Monteith model[J]. Journal of Wuhan University (Engineering Edition).2011,44(04):457-461.
[6]. Zhang Y. Research on quantitative remote sensing estimation of urban surface evapotranspiration based on improved Penman-Monteith model [D]. China University of Mining and Technology,2018.
[7]. Liu M. Research on remote sensing inversion of surface evapotranspiration based on machine learning techniques [D]. University of Chinese Academy of Sciences,2019.
[8]. Ma Z, Kang S, Zhang L, et al. Analysis of impacts of climate variability and human activity on streamflow for a river basin in arid region of northwest China [J]. Journal of Hydrology, 2008,352(3/4):239-249.
[9]. Jiang X H, Xia J, Huang Q, et al. Adaptability analysis of the Heihe River “97” water diversion scheme [J]. Acta Geographica Sinica, 2019, 74(1):103-116.
[10]. Feng, Fei,Chen, Jiquan,Li, Xianglan,.Validity of Five Satellite-Based Latent Heat Flux Algorithms for Semi-arid Ecosystems[J].Remote Sensing.2015,7(12).16733
[11]. YUNJUN YAO, SHUNLIN LIANG, XIANGLAN LI, et al. Bayesian multimodel estimation of global terrestrial latent heat flux from eddy covariance,meteorological, and satellite observations[J]. Journal of Geophysical Research, D. Atmospheres: JGR,2014,119(8):4521-4545. DOI:10.1002/2013JD020864.
[12]. W.G.M. Bastiaanssen,M. Menenti,R.A. Feddes,.A remote sensing surface energy balance algorithm for land (SEBAL). 1. Formulation[J].Journal of Hydrology.1998,212–213(1).198-212.
[13]. Ma, Yanfei, Liu, Shaomin. (2020). Day-by-day 100 m surface evapotranspiration data from the Heihe River Basin (2010-2016) (HiTLL ET V1.0). National Tibetan Plateau Science Data Centre. https://doi.org/10.11888/Hydro.tpdc.271081. https://cstr.cn/18406.11.Hydro.tpdc. 271081.
Cite this article
Pang,Z.;Su,K. (2024). Intelligent monitoring of surface evapotranspiration in the Heihe River Basin based on dual-source modelling. Applied and Computational Engineering,63,68-77.
Data availability
The datasets used and/or analyzed during the current study will be available from the authors upon reasonable request.
Disclaimer/Publisher's Note
The statements, opinions and data contained in all publications are solely those of the individual author(s) and contributor(s) and not of EWA Publishing and/or the editor(s). EWA Publishing and/or the editor(s) disclaim responsibility for any injury to people or property resulting from any ideas, methods, instructions or products referred to in the content.
About volume
Volume title: Proceedings of the 4th International Conference on Materials Chemistry and Environmental Engineering
© 2024 by the author(s). Licensee EWA Publishing, Oxford, UK. This article is an open access article distributed under the terms and
conditions of the Creative Commons Attribution (CC BY) license. Authors who
publish this series agree to the following terms:
1. Authors retain copyright and grant the series right of first publication with the work simultaneously licensed under a Creative Commons
Attribution License that allows others to share the work with an acknowledgment of the work's authorship and initial publication in this
series.
2. Authors are able to enter into separate, additional contractual arrangements for the non-exclusive distribution of the series's published
version of the work (e.g., post it to an institutional repository or publish it in a book), with an acknowledgment of its initial
publication in this series.
3. Authors are permitted and encouraged to post their work online (e.g., in institutional repositories or on their website) prior to and
during the submission process, as it can lead to productive exchanges, as well as earlier and greater citation of published work (See
Open access policy for details).
References
[1]. CHAI Huixia, TAN Lihai,PAN Japeng. Characteristics of hydrology and water resources in the Heihe River Basin under the background of climate change[J/OL]. Water Resources and Hydropower Technology (in English and Chinese).1-9[2023-09-20].http://kns.cnki.net/kcms/detail/10.1746.TV.20230620.1044.008.html
[2]. Su.The Surface Energy Balance System forestimation of turbulent heat fluxes[J].Hydrology and Earth System Sciences, 2002, 6(1):85-99.
[3]. Bastiaanssen W G M , Menenti M , Feddes R A ,et al.A remote sensing surface energy balance algorithm for land (SEBAL). 1. Formulation[J].Journal of Hydrology, 1998, 212(1-4):198-212.DOI:10.1016/S0022-1694(98)00253-4.
[4]. Cleugh Helen A., Leuning Ray, Mu Qiaozhen, et al. Regional evaporation estimates from flux tower and MODIS satellite data[J]. Remote Sensing of Environment, 2007,106(3):285-304.
[5]. LI Hongxia,ZHANG Yongqiang,ZHANG Xinhua et al. Estimation of regional evapotranspiration by remote sensing Penman-Monteith model[J]. Journal of Wuhan University (Engineering Edition).2011,44(04):457-461.
[6]. Zhang Y. Research on quantitative remote sensing estimation of urban surface evapotranspiration based on improved Penman-Monteith model [D]. China University of Mining and Technology,2018.
[7]. Liu M. Research on remote sensing inversion of surface evapotranspiration based on machine learning techniques [D]. University of Chinese Academy of Sciences,2019.
[8]. Ma Z, Kang S, Zhang L, et al. Analysis of impacts of climate variability and human activity on streamflow for a river basin in arid region of northwest China [J]. Journal of Hydrology, 2008,352(3/4):239-249.
[9]. Jiang X H, Xia J, Huang Q, et al. Adaptability analysis of the Heihe River “97” water diversion scheme [J]. Acta Geographica Sinica, 2019, 74(1):103-116.
[10]. Feng, Fei,Chen, Jiquan,Li, Xianglan,.Validity of Five Satellite-Based Latent Heat Flux Algorithms for Semi-arid Ecosystems[J].Remote Sensing.2015,7(12).16733
[11]. YUNJUN YAO, SHUNLIN LIANG, XIANGLAN LI, et al. Bayesian multimodel estimation of global terrestrial latent heat flux from eddy covariance,meteorological, and satellite observations[J]. Journal of Geophysical Research, D. Atmospheres: JGR,2014,119(8):4521-4545. DOI:10.1002/2013JD020864.
[12]. W.G.M. Bastiaanssen,M. Menenti,R.A. Feddes,.A remote sensing surface energy balance algorithm for land (SEBAL). 1. Formulation[J].Journal of Hydrology.1998,212–213(1).198-212.
[13]. Ma, Yanfei, Liu, Shaomin. (2020). Day-by-day 100 m surface evapotranspiration data from the Heihe River Basin (2010-2016) (HiTLL ET V1.0). National Tibetan Plateau Science Data Centre. https://doi.org/10.11888/Hydro.tpdc.271081. https://cstr.cn/18406.11.Hydro.tpdc. 271081.