


1. Introduction
Climate change and food insecurity are two of the most critical issues in the world. According to an estimation from the Intergovernmental Panel on Climate Change , limiting global warming to 1.5 °C will be beyond reach without immediate emissions reductions across all sectors. Meanwhile, as many as 828 million people faced hunger in 2021 globally, and nearly one in three, around 2.31 billion, were moderately or severely suffering from food insecurity . It’s also estimated that the global food system is responsible for about a third of greenhouse gas emissions [3]. It’s urgent to find a solution to address both problems.
Carbon fixation and starch synthesis have recently become hot research topics. In 2016, T. Schwander et al. first investigated the synthesis pathway of carbon dioxide by synthesizing it as malate via the CETCH cycle, which is a reaction network of 17 enzymes that converts carbon dioxide into organic molecules at a rate of 5 nmol CO2 min-1 mg -1 . In 2017, T. P. Korman et al. synthesized glucose in a cell-free environment as monoterpene, a common anti-cancer drug component comprising 27 enzymes for conversion. In the same year, A. Satanowski et al. generated 2PG pyruvate, a digestible glucose, by awakening a potential cycle in E. coli, achieving carbon sequestration while utilizing carbon [. In 2021, a clear and efficient pathway for synthesizing starch from CO2 was first attained . It has a very high potential to ease hunger and global warming.
The research goal of this project is to improve the yield of enzymatic steps in starch synthesis through computer design and database analysis. In the process, starch synthase is chosen as the enzyme to be improved. Starch synthase, or glycogen synthase, is a glycosyltransferase, the second enzyme in the glycogen biosynthesis pathway. It can catalyze the addition of a glucosyl unit from ADP-glucose to the non-reducing end of glycogen .
Generally, two main strategies to engineer proteins are directed evolution and rational design, which can be combined into semi-rational design or focused directed (designed) evolution . The directed evolution approach is a relatively stochastic optimization pathway that uses error-prone polymerase chain reaction (error-prone PCR) to provide selective power after random mutations are generated in the enzyme. However, a high-throughput screening or selection method is required for such a method, which limits the exploration of many enzymes. As a comparison, rational design is a rising engineering method as it provides better efficiency and the possibility of attaining a better protein structure. Protein mutation and molecular docking can be achieved using Autodock Vina, PyRosetta, and Protein-Indel-Maker.
Considering the limiting high-throughput screening method of starch synthase, this research applied rational design in the dry lab, where mutants are attained, simulated, and screened in silico (Figure 1). To realize this, IDMS, Iterating Docking Mutating Simulation, is developed to automatically simulate protein mutation using Rosetta and asses the mutant by Autodock Vina. After expressing the mutated and wild-type starch synthase in the wet lab, the catalytic activity was quantified and compared.
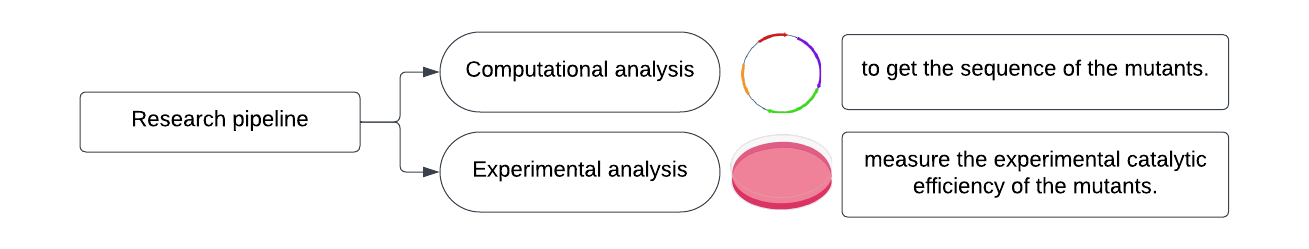
Figure 1. Flowchart of the research pipeline.
2. Materials and Methods
2.1. Computational analysis
Molecular docking software Autodock Vina can predict the binding modes between the proteins and their ligands by sampling possible conformations of a ligand inside the protein binding pocket. A scoring function is thereby used to estimate the quality of each binding pose, which is calculated based on the interactions. Autodock Vina performs a search algorithm with varying conformations of a given ligand. Eventually, through an affinity scoring function, a ΔG, binding free energy in kcal/mol, is estimated and employed to rank the candidate poses as the sum of several energetic contributions, including electrostatics, van der Waals, and desolvation. Python is used for scripting to automate the docking using Autodock Vina.
PyRosetta is used for molecular modeling using the Rosetta library by Python. It helps create custom molecular modeling algorithms with Rosetta sampling and scoring functions using Python scripting, further saving time. It makes the intricated Rosetta molecular modeling suite easier and simpler to access.
For each binding site, the Protein-Ligand Interaction Profiler (PLIP) algorithm considers the atoms from the protein and the ligand only if they lie within a certain distance cutoff. Once the potentially interacting protein and ligand atoms are identified, non-covalent interactions can be detected, such as hydrophobic interactions, hydrogen bonds, aromatic stacking, pi-cation interactions, salt bridges, water-bridged hydrogen bonds, and halogen bonds. They are defined using geometry rules, such as distance and angle thresholds. Using PLIP analysis, I can get information on the most activated bindings between the proteins and their ligands, thus better determining the mutation site in the next research step.
2.2. Experimental analysis
2.2.1. Plasmid Construction. A plasmid template is required to insert the gene of interest. This research chooses pET-24b (+) as it can allow protein overexpression using the T7 system in the E. coli BL21(DE3) strain. As the study aims to increase the yield of artificial starch synthesis by optimizing enzyme activity, the gene of interest here is glycogen synthase from E. coli. To facilitate protein expression and stabilize the plasmid, codon optimization is required to prevent using the original sequence to avoid recombination. The codon optimization tool from the IDT website is used. The glycogen synthase can be inserted between the NheI and XhoI restriction sites to minimize scar sequences on the pET-24b(+). Finally, a 6xHis-tag is fused to the C-terminal of the protein with a flexible GGS linker. The designed construction is ordered from Universe Gene Technology (Tianjin)Co. Bacterial strains and plasmids used in this study are listed.
The PCR reaction components are the 25.0 μL PrimeSTAR Max Premix (2×), 1.5 μL Forward primer (10 μM), 1.5 μL Reverse primer (10 μM), 1.0 μL Template (20ng/μL), and up to 50 μL water. Each reaction cycle involves the process of 98°C denaturation 10s, 55-70 °C annealing 15s, 72 °C eyes 130s, a total of 20 cycles.
In the 1% agarose gel electrophoresis, take 5 μL of the reaction product and add 5×DNA loading buffer, mix well, add samples to the gel wells of agarose gel, and perform electrophoretic detection in 1×TBE buffer. After electrophoresis, the results were observed in a gel imager. The PCR products were digested to remove the template plasmid from the reaction system, and 50 µl of the reaction system includes 44 μL PCR products, 5 μL 10×FastDigest Buffer, and 1 μL Dpn I.
The digested PCR products were digested for 2 hours at 37 °C under 50 µl of the digestive system, followed by purification of the digested PCR products using the PCR product purification kit. Ten microliters of purified samples were added to 100 microliters of E. coli BL21 (DE3) receptor cells and placed on ice for 30 min, then heat-excited for 90 s in a water bath at 42 °C and placed on ice for 3 min. 800 microliters of anti-resistant-free LB medium were added, placed into a shaker at 37 °C, and incubated for 1.5 h. After that, the culture solution was evenly spread on solid LB plates containing 50 μg/mL of Kanaa and incubated overnight in an inverted incubator at 37 °C to obtain single colonies containing the mutant gene. Three to five single clones were skipped from each plate and sent for sequencing to verify that the saturation mutant library was built correctly.
2.2.2. Expression. The pET-24b (+) allows for the inducible expression of the protein. A single colony of Escherichia coli containing the pET-24b(+) plasmid was resuspended in a liquid culture containing the appropriate antibiotic, Kanamycin, in this case, ensuring plasmid selection. The culture grew overnight until it reached a saturated cell density, serving as the starter culture. It was then inoculated into 1 liter of expression media supplemented with Kanamycin. The injection was carried out at a 1:100 dilution ratio. The main culture was subsequently incubated at 37 ºC with continuous shaking at 200 rpm until the optical density at 600 nm (OD600) reached the desired range of 0.4~0.8. The protein expression was induced using 0.5 mM IPTC (Isopropyl β-D-1-thiogalactopyranoside) for four hours at 37 ºC. The cultured cells were pelleted by subjecting them to centrifugation, separating the pellet, containing cells and proteins, from the supernatant comprising the spent media. The cell pellet was resuspended in a buffer solution containing 50 mM Tris-HCl at pH 9 and 150 mM NaCl. The resuspended cells were subjected to rapid freezing in liquid nitrogen.
2.2.3. Purification. A C-terminal His-tag has been added to the plasmid. It allows the His-tagged protein to be purified in one step by immobilized metal affinity chromatography (IMAC) on a nickel-nitrilotriacetic acid (Ni-NTA) column. Nitrilotriacetic acid (NTA) is a tetradentate chelating adsorbent developed by Roche Diagnostics GmbH. NTA occupies six ligand binding sites of the nickel ion, leaving two sites free for interaction with the His-6-tag. NTA binds metal ions tightly, allowing the use of stringent washes. Histidine residues on the tag, connected via a short linker, bind to the Ni-ions. The protein can be eluted by competitive displacement with imidazole.
Firstly, the bacterial cells are harvested by centrifugation at 3000r for 20 mins. Resuspend the cells in 50 ml of Equilibration. Add 8 mg lysozyme and incubate on ice for 30 minutes. Using a sonicator equipped with a microtip, sonicate the solution on ice using six 10-second bursts at high intensity with a ten-second cooling period between bursts. If the lysate is very viscous, add RNase A (10 μg/ml) and DNase I (5 μg/ml) and incubate on ice for 10–15 minutes.
Then, prepare the Ni-NTA column. Resuspend the Ni-NTA Agarose in its bottle by repeatedly inverting and gently tapping it. Pipet or pour 1.5 ml of the resin into a 10-ml Purification Column. Allow the resin to settle ultimately by gravity (5–10 minutes). Equilibrate the column with two resin-bed volumes of Equilibrium Buffer (20 mM sodium phosphate, 300 mM sodium chloride, 10 mM imidazole). Allow the buffer to drain from the column. Add the prepared lysate to the resin, then collect the flow-through in a tube. Wash resin with two resin-bed volumes of Wash Buffer (20 mM sodium phosphate, 300 mM sodium chloride, 40 mM imidazole), then collect the flow-through. Repeat this step using a new collection tube until the absorbance of the flow-through fraction at 280 nm approaches the baseline. Elute His-tagged proteins from the resin with two resin-bed volumes of Elution Buffer (20 mM sodium phosphate, 300 mM sodium chloride, 300 mM imidazole). Repeat this step twice, collecting each fraction in a separate tube.
2.2.4. Protein characterization and activity measurement. SDS Page is used to analyze the molar mass of the expressed proteins. The running buffer is Glycine and SDS solution under pH 8.3. The electrical current is applied for 40 minutes for each of the proteins. The catalytic activity of starch synthase is determined by monitoring the consumption of NADH. It is detected spectrophotometrically at 340 nm. The standard reaction contained 100 mM HEPES (pH 7.5), 100 mM NaCl, 5 mM Mg2+, 10 μM Zn2+, 1.5 mM NADH, 3mM PEP, 5 U/mL PK, LDH, 0.01 g/L dextrin, 1mM ADPG and starch synthase of wild type and mutants. A typical reaction was started at 30°C by the addition of ADPG. The specific activity of ss was calculated as the number of μmol ADP formed per min per milligram of ss protein.
3. Results and Discussion
3.1. Wild-type protein docking
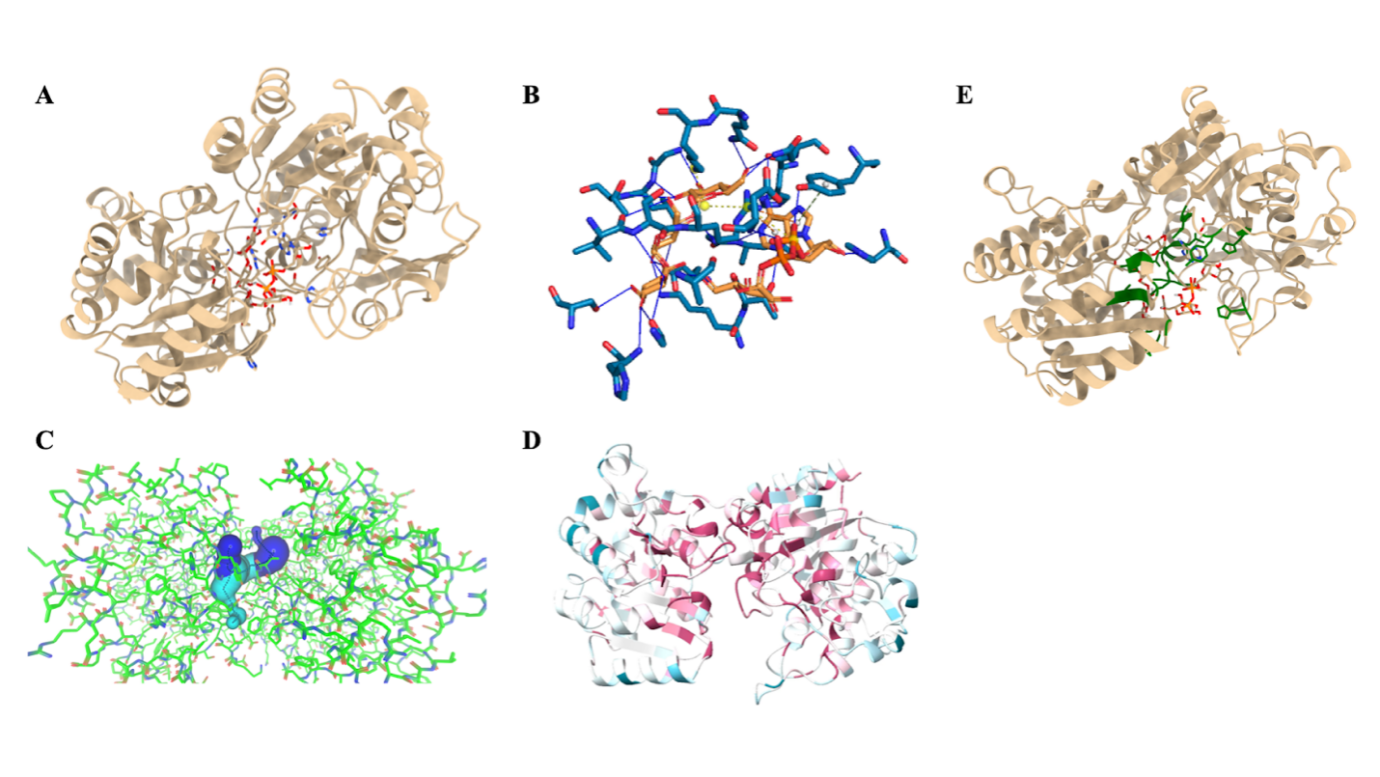
Figure 2. A. the docked structure of the starch synthase with ligands ADP-glucose and maltotriose . B. Interaction analysis using PLIP. C. Tunnel analysis of ligands in starch synthase. D. Consurf Analysis on evolution conservation scores of the wild-type protein. E. Selected sites marked on the wild-type protein.
As starch synthase plays one of the most significant roles in catalyzing glucose units into amylose chains, I selected starch synthase as the enzyme to be improved . Maltotriose was first chosen to be one of the ligands representing small starch fragments because of its relatively small size, which could help increase the efficiency of the computational calculation. The other ligand of starch synthase is ADP-glucose, which provides energy and glucose units in the reaction. The wild-type protein and its ligands are first docked to recognize the mutation site (Figure 2A).
Protein-Ligands Interaction Profiler, PLIP, is then used to analyze the interaction between the protein and the ligands. As the analysis shows, sites 15, 16, 18, 19, 21, 139, 161, 162, 165, 298, 299, 304, 329, 331, 534, and 356 interact with the ligands through hydrogen bonds; site 165 interacts with the ligands through pi-stacking; site 300 interacts with the ligands through pi-cation; and site 300 and 305 interact with the ligands through salt bridges . Caver analyzes the tunnel of the ligands in the protein to view the reaction process between proteins and the ligands (Figure 2C) .
Meanwhile, Consurf is used to determine the conservation scores of the wild-type protein (Figure 2D). The higher scores mean higher conservation degrees, leading to the increasing significance of the catalytic process. Sites with higher scores are favored for the mutation . The selected sites, 12P, 15K, 18G, 19L, 21D, 96 H, 139H, 161H, 162N, 165Y, 298V, 299S, 300R, 302T, 304Q, 305K, 331D, 354G, 356H, are presented on the wild-type protein.
The pipeline of wild-type protein analysis is summarized (Figure 3).
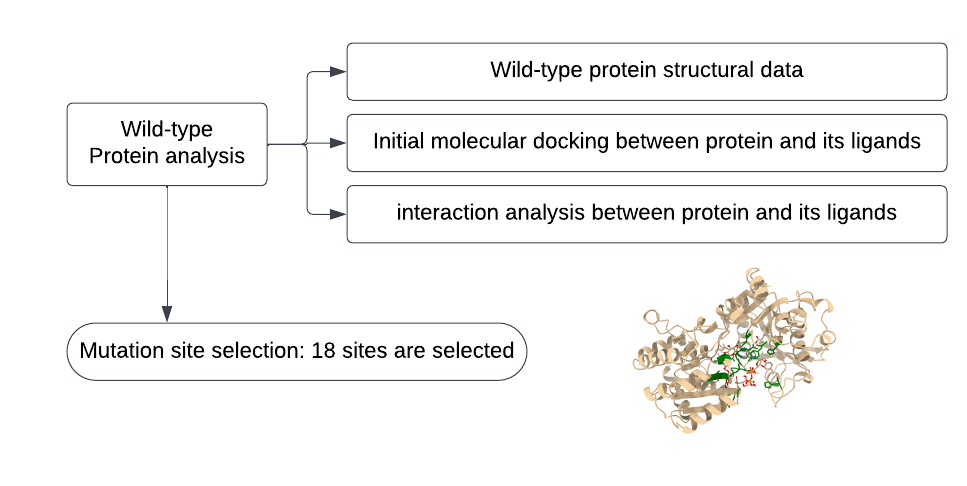
Figure 3. Flowchart of computational analysis of the wild-type.
3.2. Iterated Docking Mutating Simulation (IDMS)
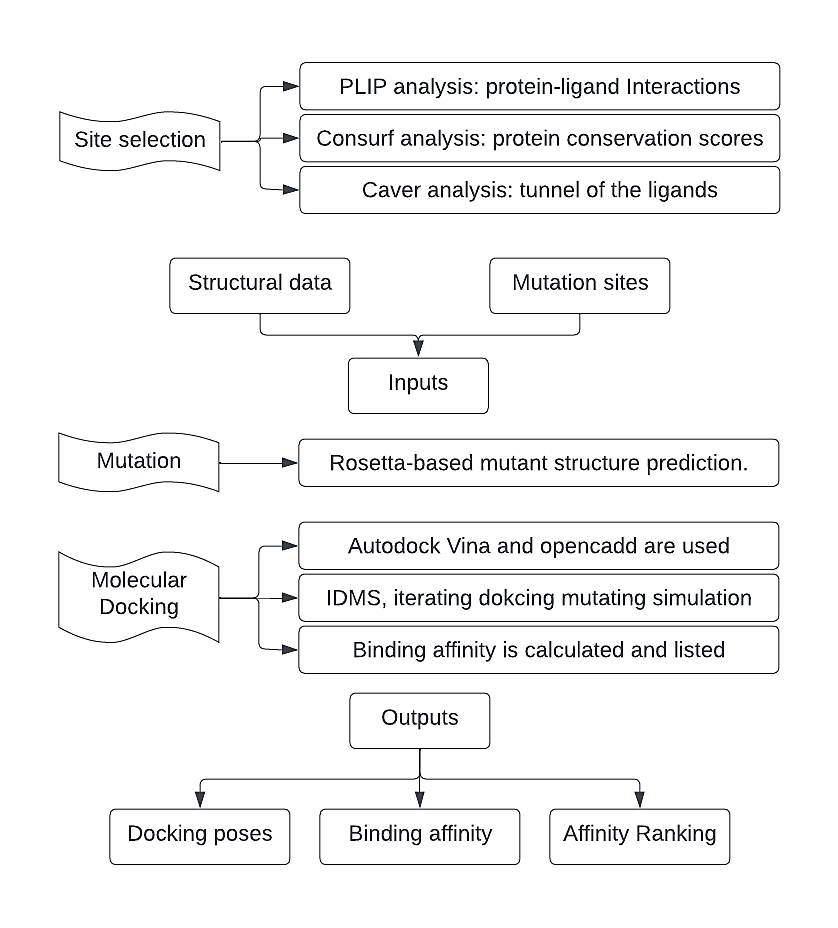
Figure 4. Flow chart of IDMS process.
In order to simulate the protein evolution, mutation prediction and activity screening are important. To address that, I developed an iterative process (IDMS) in silico to resemble the experimental protein-directed evolution (Figure 4). The input of IDMS consists of two parts: structural data and mutation sites. Firstly, the Rosetta library is used to predict the structures of the mutants and calculate the protein stability after mutation. Afterward, molecular docking is conducted using Autodock Vina based on the predicted structure. The binding affinities between the protein and the ligand are calculated. In the catalytic process of starch synthase, the product is added one glucosyl. Therefore, the strategy to improve the catalytic efficiency of protein is to reduce the binding affinity between the protein molecule and its ligands. The outputs contain the docking poses, binding affinity, and the rankings of the binding affinities.
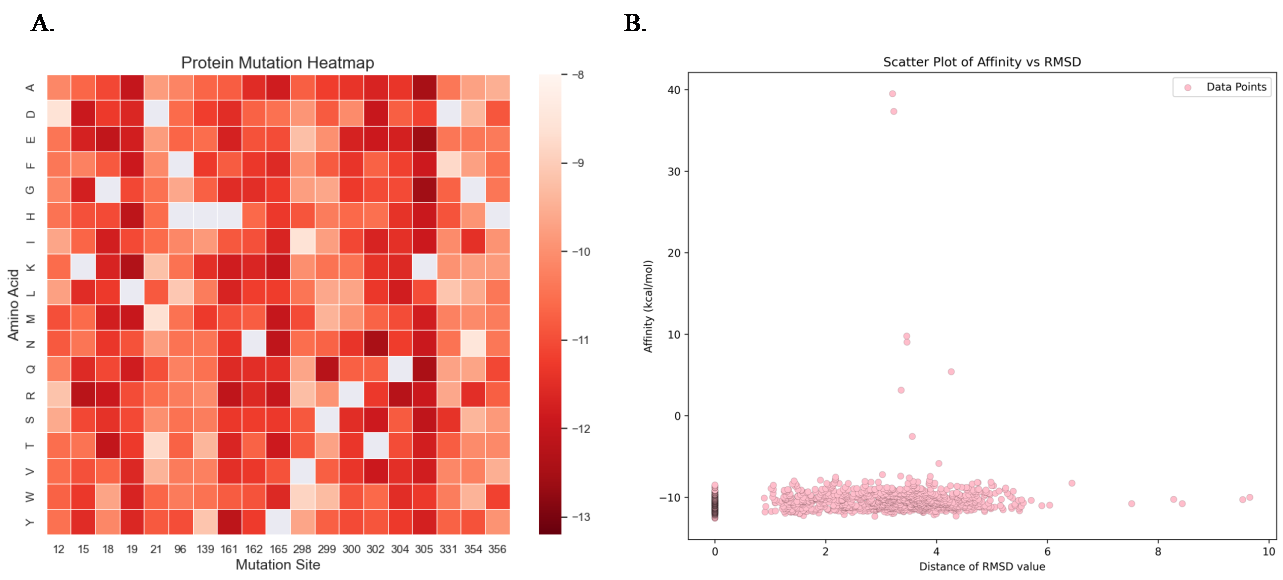
Figure 5. A. The heatmap for single site mutation. The reddest represents the lower energy of affinity, showing a more stable structure in the calculation. The blank space represents the repeated meaningless mutation. The sites with bolded borders represent the selected sites in the double-site mutations. B. The RMSD graph over all the single site mutants’ docking.
Based on the combined analysis results of wild-type proteins from Consurf and PLIP, I selected a total of 19 residues for mutagenesis studies. The original amino acids at these positions are as follows: 12 P, 15 K, 18 G, 19 L, 21 D, 96 H, 139 H, 161 H, 162 N, 165 Y, 298 V, 299 S, 300 R, 302 T, 304 Q, 305 K, 331 D, 354 G, and 356 H. I first deleted some of the 20 different amino acids by analysis based on chemistry principles. Amino acid C has an unstable C-S bond so that C could be excluded; amino acid P has a five-membered nitrogen-containing ring, so P could also be excluded from mutations. Therefore, I have a total of 18 amino acid alternatives for each position to mutate, and the alternatives are presented in (Figure 5A). All the possible mutants are constructed, and 324 cycles are finished. The RMSD graph in (Figure 5B) shows the accuracy and confidence of the docking results, and only the results with the lowest RMSD, as well as the double-site mutation, are selected to be further considered in the heatmap.
The sequential approach is adopted to investigate the impact of double-site mutations on the affinity energy of interactions between enzymes and ligands. Initially, I selected the top-performing single-site mutations, representing Pool 1, based on the results in single-site mutations. This set of mutations from Pool 1 was the foundation for generating double-point mutants.
Considering the effect of pervasive epistasis, if two sites with higher affinity energy are selected and combined, a relatively favored result might be formed. Therefore, I selected a second group of mutations, characterized by slightly lower individual performance, to gather a more comprehensive dataset, forming Pool 2. Subsequently, I utilized this new pool of mutations from Pool 2 to create another set of double-point mutants. The two-phase approach allowed for a comparative analysis of double-point mutants, aiming to assess whether mutations from Pool 2 would yield unexpectedly favorable results, thereby contributing to a more comprehensive understanding of the influence of the mutational landscape on the affinity energy of enzymatic interactions with ligands. In all, 121 double-site mutations were done. Heat maps of two pools are shown in (Figure 6A and B), and the RMSD graph, with affinity over all double-site mutations, is shown in (Figure 6C).
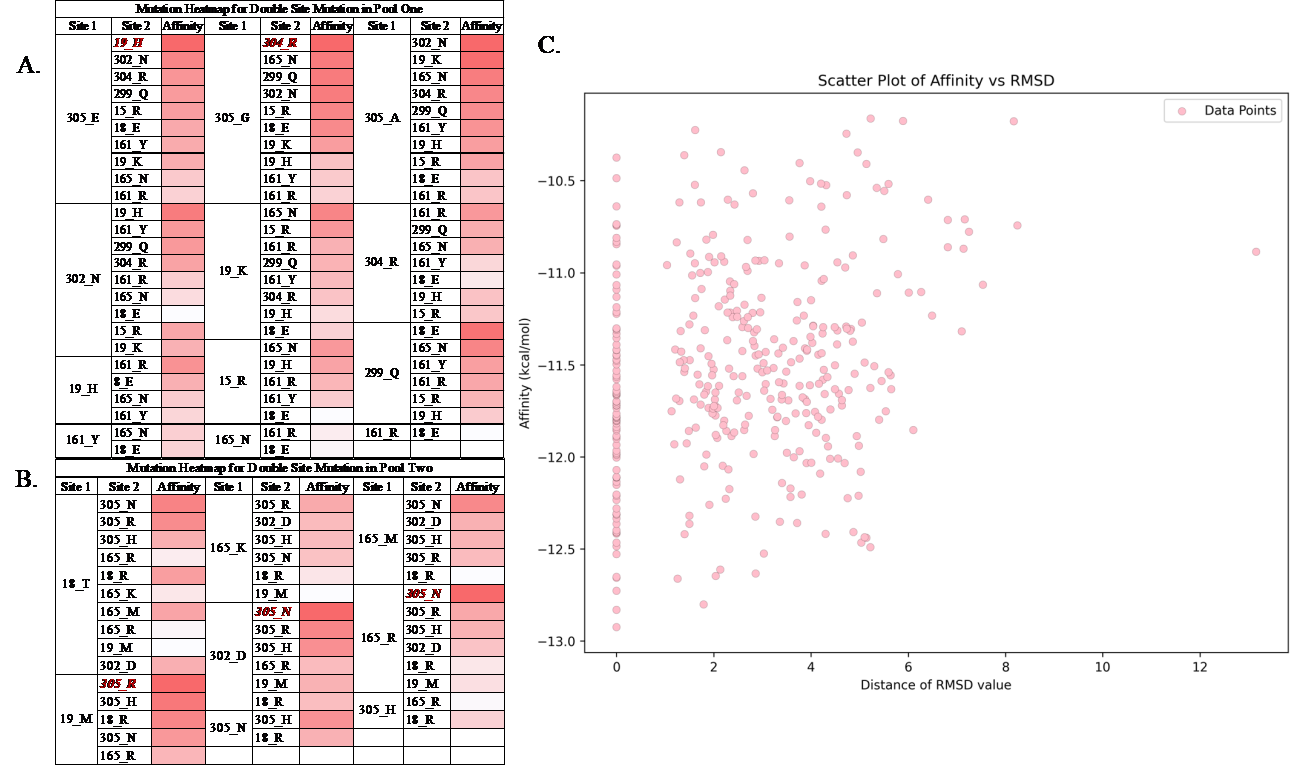
Figure 6. A. The heatmap for double site mutation in pool one. B. The heatmap for double site mutation in pool two. The sites marked red and bolded in italics are the five selected lowest affinity energy results. C. The RMSD graph over all the double site mutants’ docking.
As a result, the top five best results are selected, and they come from both Pool 1 and Pool 2. Therefore, the possibility exists that even though the result of single-site mutation is not that favored, the combination of the two sites could perform better in double-site mutation results.
3.3. Plasmid construction and experiment result
LacI is used to repress the transcription in the plasmid construction of the protein, which is favored in the expression in E. coli and this plasmid. The 6x-histidine tag is added to the plasmid to prepare for purification. The construction of plasmids for the mutants involves the site-mutagenesis in the sequence of starch synthase. The construction of the plasmid is shown in (Figure 7).
After expression for 16 hours, the proteins are purified. The SDS PAGE result first indicates that all the mutants are successfully expressed, as shown in (Figure 8A). Then, ImageJ is used to determine the expression levels of these proteins. (Figure 8B) shows that mutants B, C, and E have notably better protein expression levels. Mutant C showed approximately 3.3-fold more expression. It’s noted that this variation in expression rate is only a trend since the slight operation difference in the expression process may also influence the real expression rate. The relative activity of the mutants is calculated using the well-established enzyme assay shown in (Figure 8C). In the first hour, mutant E appears to be similar to the wild-type, and after two hours, the wild-type protein seems to react with the highest relative activity. Mutant E also has an approximately 2.5-fold expression rate. The increased expression rate can help improve the enzyme yield, another progress.
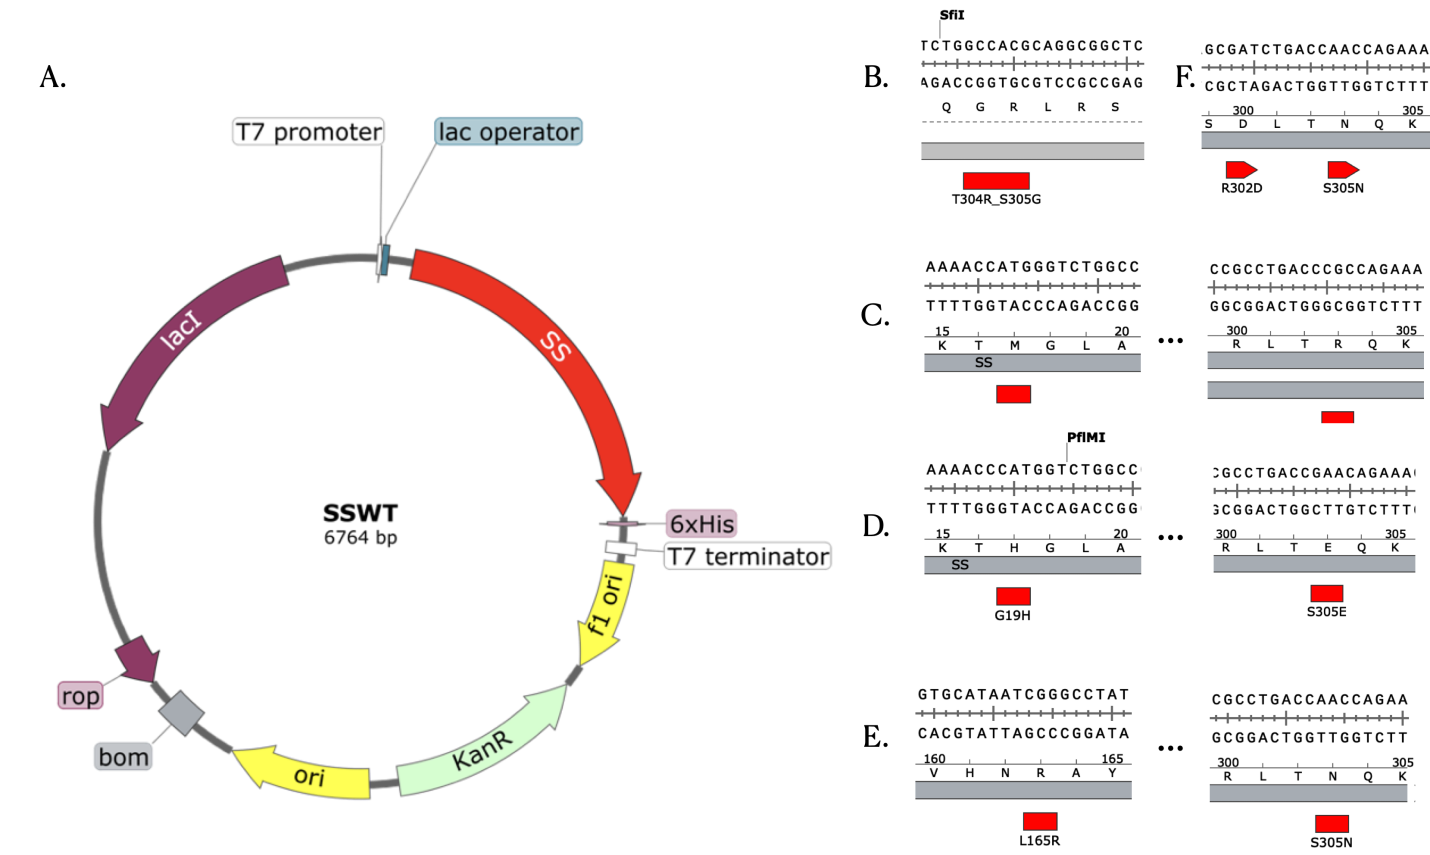
Figure 7. A. In the Plasmid map for wild-type starch synthase, the mutation sites in the sequence of starch synthase were marked red. B. Mutant A. C. Mutant B. D. Mutant C. E. Mutant D. F. Mutant E.
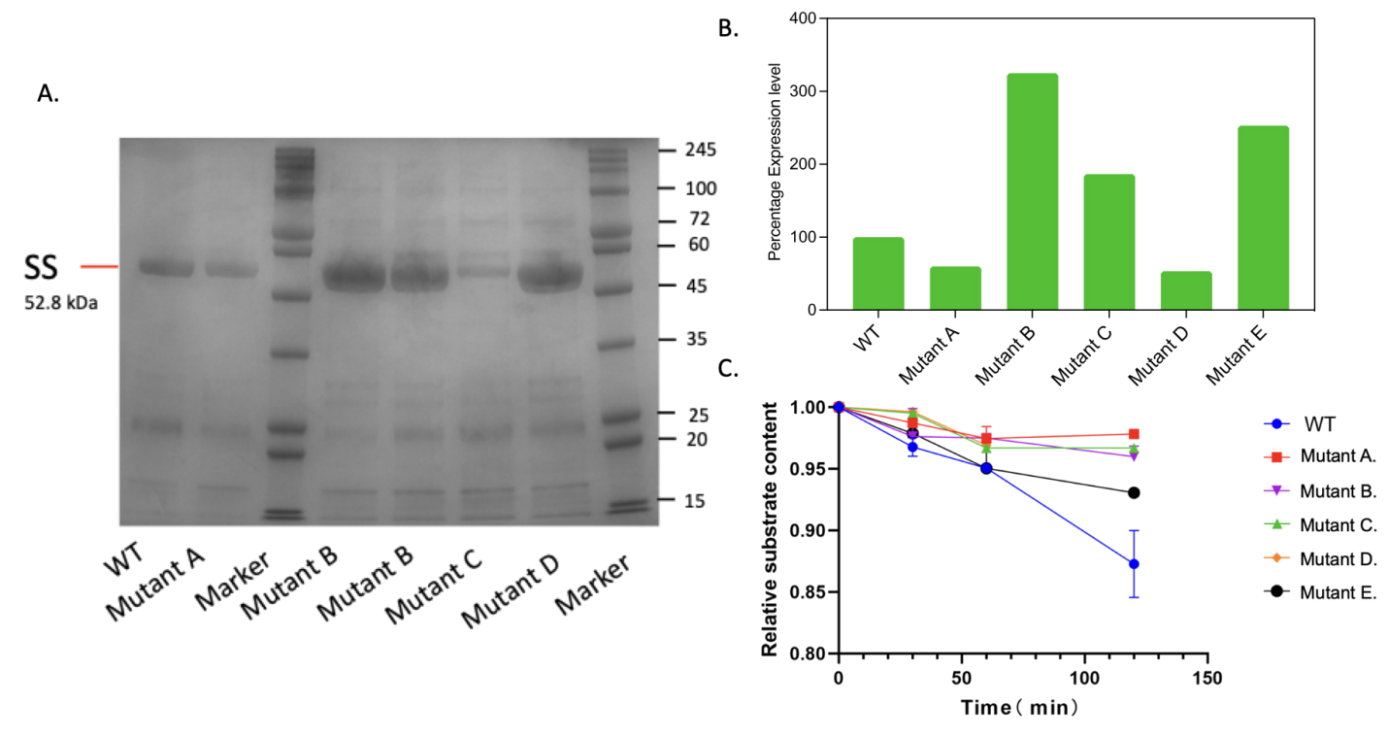
Figure 8. A. The SDS-PAGE result. Lane a. expression of wild-type protein; lane b. mutant with E; lane d. mutant with C; lane e. B; lane f. mutant with D; g. mutant with E; lane c and h are markers. B. The intensity of expressed protein. C. the relative rate of the five mutants compared to the wild-type protein.
4. Conclusion
This research focused on improving the enzymatic catalysis of starch synthase, a pivotal enzyme involved in carbon dioxide fixation into starch, which holds significant industrial importance. The study employed a multifaceted approach to improve the understanding of the mutational landscape's impact on enzyme-ligand interactions, with the product of Iterated Docking Mutating Simulation (IDMS) constructed. Molecular docking with Autodock Vina, the Rosetta library, and the Protein-Ligand Interaction Profiler was crucial in the codings and site selection.
In the computational experiments, the sequential strategy encompassed two distinct mutation pools. Pool 1 comprised top-performing single-site mutations, and Pool 2 contained slightly less favorable single-site mutations, allowing for a comprehensive assessment of double-point mutants. This approach yielded impressive results, with the top-performing double-site mutants emerging from both Pool 1 and Pool 2. It emphasized that even single-site mutations, which might not yield individually optimal results, could exhibit remarkably enhanced enzymatic activity when strategically combined.
Through the plasmid construction and experimentation, the experimental relative activities of the mutants are found. The mutants' catalytic efficiencies showed remarkable improvements, exemplified by the Mutant E, 302_D, 305_N, double-site mutant, which exhibited an approximately 2.5-fold increase in expression.
In the experiment process, the IDMS calculations' result is still imperfect. In the future, diff-dock and other protein-ligand interaction calculators involving the exploitation of artificial intelligence could be implemented in IDMS, thus further improving the accuracy of IDMS. Meanwhile, a more accurate experiment can also be carried out to calculate the exact rate of the combination between the mutants and the ligands. Moreover, the temperature of the reactivity assay can be increased to about 37 °C or higher, which can increase the portion of the kinetics influenced by the mutated improvement.
Additionally, most mutation sites are inside the enzyme’s binding pockets to increase the catalytic efficiency. However, in industrialization, many other factors of a protein catalyst need to be considered, such as the expression amount, solubility, and thermostability. In this experiment, it turns out that the mutant with the best catalytic efficiency, mutant E, with a 2.5-fold improved expression amount, has the potential to be further improved in solubility.
References
[1]. IPCC. IPCC, 2022: Summary for Policy Makers.; 2022.
[2]. The State of Food Security and Nutrition in the World 2022.; 2022. doi:10.4060/cc0639en
[3]. Worldbank. Climate Explainer: Food Security and Climate Change. worldbank.org.
[4]. Schwander T, Von Borzyskowski LS, Burgener S, Cortina NS, Erb TJ. A synthetic pathway for the fixation of carbon dioxide in vitro. Science (1979). 2016;354(6314). doi:10.1126/science.aah5237
[5]. Korman TP, Opgenorth PH, Bowie JU. A synthetic biochemistry platform for cell free production of monoterpenes from glucose. Nat Commun. 2017;8. doi:10.1038/ncomms15526
[6]. Miller TE, Beneyton T, Schwander T, et al. Light-powered CO2 fixation in a chloroplast mimic with natural and synthetic parts. Science (1979). 2020;368(6491). doi:10.1126/science.aaz6802
[7]. Satanowski A, Dronsella B, Noor E, et al. Awakening a latent carbon fixation cycle in Escherichia coli. Nat Commun. 2020;11(1). doi:10.1038/s41467-020-19564-5
[8]. Cai T, Sun H, Qiao J, et al. Cell-free chemoenzymatic starch synthesis from carbon dioxide. Science (1979). 2021;373(6562). doi:10.1126/science.abh4049
[9]. Sheng F, Jia X, Yep A, Preiss J, Geiger JH. The crystal structures of the open and catalytically competent closed conformation of Escherichia coli glycogen synthase. Journal of Biological Chemistry. 2009;284(26). doi:10.1074/jbc.M809804200
[10]. Steiner K, Schwab H. Recent advances in rational approaches for enzyme engineering. Comput Struct Biotechnol J. 2012;2(3). doi:10.5936/csbj.201209010
[11]. DeLano WL. The PyMOL Molecular Graphics System, Version 2.3. Schrödinger LLC. Published online 2020.
[12]. Pettersen EF, Goddard TD, Huang CC, et al. UCSF ChimeraX: Structure visualization for researchers, educators, and developers. Protein Science. 2021;30(1). doi:10.1002/pro.3943
[13]. Adasme MF, Linnemann KL, Bolz SN, et al. PLIP 2021: Expanding the scope of the protein-ligand interaction profiler to DNA and RNA. Nucleic Acids Res. 2021;49(W1). doi:10.1093/nar/gkab294
[14]. Stourac J, Vavra O, Kokkonen P, et al. Caver Web 1.0: Identification of tunnels and channels in proteins and analysis of ligand transport. Nucleic Acids Res. 2019;47(W1). doi:10.1093/nar/gkz378
[15]. Ashkenazy H, Abadi S, Martz E, et al. ConSurf 2016: an improved methodology to estimate and visualize evolutionary conservation in macromolecules. Nucleic Acids Res. 2016;44(W1). doi:10.1093/NAR/GKW408
[16]. Eberhardt J, Santos-Martins D, Tillack AF, Forli S. AutoDock Vina 1.2.0: New Docking Methods, Expanded Force Field, and Python Bindings. J Chem Inf Model. 2021;61(8). doi:10.1021/acs.jcim.1c00203
[17]. Trott O, Olson AJ. AutoDock Vina: Improving the speed and accuracy of docking with a new scoring function, efficient optimization, and multithreading. J Comput Chem. Published online 2009. doi:10.1002/jcc.21334
[18]. Chowdhury R, Grisewood MJ, Boorla VS, Yan Q, Pfleger BF, Maranas CD. IPRO+/−: Computational Protein Design Tool Allowing for Insertions and Deletions. Structure. 2020;28(12). doi:10.1016/j.str.2020.08.003
[19]. Podgornaia AI, Laub MT. Pervasive degeneracy and epistasis in a protein-protein interface. Science (1979). 2015;347(6222). doi:10.1126/science.1257360 t and unwavering guidance on the underlying theories that formed the foundation of this research.
Cite this article
Gao,R. (2024). A computational enzymatic optimization for fixing carbon dioxide to starch. Applied and Computational Engineering,63,90-99.
Data availability
The datasets used and/or analyzed during the current study will be available from the authors upon reasonable request.
Disclaimer/Publisher's Note
The statements, opinions and data contained in all publications are solely those of the individual author(s) and contributor(s) and not of EWA Publishing and/or the editor(s). EWA Publishing and/or the editor(s) disclaim responsibility for any injury to people or property resulting from any ideas, methods, instructions or products referred to in the content.
About volume
Volume title: Proceedings of the 4th International Conference on Materials Chemistry and Environmental Engineering
© 2024 by the author(s). Licensee EWA Publishing, Oxford, UK. This article is an open access article distributed under the terms and
conditions of the Creative Commons Attribution (CC BY) license. Authors who
publish this series agree to the following terms:
1. Authors retain copyright and grant the series right of first publication with the work simultaneously licensed under a Creative Commons
Attribution License that allows others to share the work with an acknowledgment of the work's authorship and initial publication in this
series.
2. Authors are able to enter into separate, additional contractual arrangements for the non-exclusive distribution of the series's published
version of the work (e.g., post it to an institutional repository or publish it in a book), with an acknowledgment of its initial
publication in this series.
3. Authors are permitted and encouraged to post their work online (e.g., in institutional repositories or on their website) prior to and
during the submission process, as it can lead to productive exchanges, as well as earlier and greater citation of published work (See
Open access policy for details).
References
[1]. IPCC. IPCC, 2022: Summary for Policy Makers.; 2022.
[2]. The State of Food Security and Nutrition in the World 2022.; 2022. doi:10.4060/cc0639en
[3]. Worldbank. Climate Explainer: Food Security and Climate Change. worldbank.org.
[4]. Schwander T, Von Borzyskowski LS, Burgener S, Cortina NS, Erb TJ. A synthetic pathway for the fixation of carbon dioxide in vitro. Science (1979). 2016;354(6314). doi:10.1126/science.aah5237
[5]. Korman TP, Opgenorth PH, Bowie JU. A synthetic biochemistry platform for cell free production of monoterpenes from glucose. Nat Commun. 2017;8. doi:10.1038/ncomms15526
[6]. Miller TE, Beneyton T, Schwander T, et al. Light-powered CO2 fixation in a chloroplast mimic with natural and synthetic parts. Science (1979). 2020;368(6491). doi:10.1126/science.aaz6802
[7]. Satanowski A, Dronsella B, Noor E, et al. Awakening a latent carbon fixation cycle in Escherichia coli. Nat Commun. 2020;11(1). doi:10.1038/s41467-020-19564-5
[8]. Cai T, Sun H, Qiao J, et al. Cell-free chemoenzymatic starch synthesis from carbon dioxide. Science (1979). 2021;373(6562). doi:10.1126/science.abh4049
[9]. Sheng F, Jia X, Yep A, Preiss J, Geiger JH. The crystal structures of the open and catalytically competent closed conformation of Escherichia coli glycogen synthase. Journal of Biological Chemistry. 2009;284(26). doi:10.1074/jbc.M809804200
[10]. Steiner K, Schwab H. Recent advances in rational approaches for enzyme engineering. Comput Struct Biotechnol J. 2012;2(3). doi:10.5936/csbj.201209010
[11]. DeLano WL. The PyMOL Molecular Graphics System, Version 2.3. Schrödinger LLC. Published online 2020.
[12]. Pettersen EF, Goddard TD, Huang CC, et al. UCSF ChimeraX: Structure visualization for researchers, educators, and developers. Protein Science. 2021;30(1). doi:10.1002/pro.3943
[13]. Adasme MF, Linnemann KL, Bolz SN, et al. PLIP 2021: Expanding the scope of the protein-ligand interaction profiler to DNA and RNA. Nucleic Acids Res. 2021;49(W1). doi:10.1093/nar/gkab294
[14]. Stourac J, Vavra O, Kokkonen P, et al. Caver Web 1.0: Identification of tunnels and channels in proteins and analysis of ligand transport. Nucleic Acids Res. 2019;47(W1). doi:10.1093/nar/gkz378
[15]. Ashkenazy H, Abadi S, Martz E, et al. ConSurf 2016: an improved methodology to estimate and visualize evolutionary conservation in macromolecules. Nucleic Acids Res. 2016;44(W1). doi:10.1093/NAR/GKW408
[16]. Eberhardt J, Santos-Martins D, Tillack AF, Forli S. AutoDock Vina 1.2.0: New Docking Methods, Expanded Force Field, and Python Bindings. J Chem Inf Model. 2021;61(8). doi:10.1021/acs.jcim.1c00203
[17]. Trott O, Olson AJ. AutoDock Vina: Improving the speed and accuracy of docking with a new scoring function, efficient optimization, and multithreading. J Comput Chem. Published online 2009. doi:10.1002/jcc.21334
[18]. Chowdhury R, Grisewood MJ, Boorla VS, Yan Q, Pfleger BF, Maranas CD. IPRO+/−: Computational Protein Design Tool Allowing for Insertions and Deletions. Structure. 2020;28(12). doi:10.1016/j.str.2020.08.003
[19]. Podgornaia AI, Laub MT. Pervasive degeneracy and epistasis in a protein-protein interface. Science (1979). 2015;347(6222). doi:10.1126/science.1257360 t and unwavering guidance on the underlying theories that formed the foundation of this research.