


1. Introduction
In 2021, China’s newly installed renewable energy capacity reached 134 million kilowatts, accounting for 76.1% of the country’s newly added power generation capacity; The renewable energy generation has reached 2.48 trillion kilowatt hours, accounting for 29.8% of the total electricity consumption in society. It is predicted that the annual wind and photovoltaic power generation in China will reach 63.6% of the total annual power generation by 2050 [1-2]. The volatility and randomness of photovoltaics make their large-scale integration complex the structure and operational characteristics of power systems [3-5]. At the same time, the contradiction between the installed capacity of renewable energy and the limited system absorption capacity leads to a large number of “wind and solar curtailment” phenomena [6-7]. Therefore, reliable simulation of renewable energy output is particularly important for improving resource utilization and meeting the requirements of renewable energy station planning [8-10].
There are currently many studies on the timing production of renewable energy output. The reference [10] considers scenarios with different penetration rates of new energy, and combines the marginal probability distribution of new energy output, volatility of stochastic processes, and spatiotemporal correlation to establish a time-series production model for wind and photovoltaic power generation. The reference [11] comprehensively considered factors such as wind and solar power output characteristics and load characteristics, and constructed an annual time series production simulation model for the power grid containing new energy generation; The reference [12] proposes a time-series production simulation calculation method for power grid consumption of wind power output based on a large-scale wind power network, combining maximum load and minimum coincidence prediction methods.
Due to the gap between the models and constraints established by the current time series power simulation method and the actual situation, the seasonal and weather characteristics of new energy output, as well as the correlation between adjacent daytime output, cannot fully reflect the objective situation of new energy output [13]. Therefore, based on the construction of seasonal and weather state probability transition matrices, this article proposes a photovoltaic time series power simulation model based on rolling sampled Markov chains. Taking a photovoltaic power station in Jiangsu Province as an example, the model construction and simulation of photovoltaic output were completed, and the traditional sampling simulation, rolling sampling simulation generated sequence, and historical sequence were comprehensively compared. Through numerical examples, it has been verified that the rolling sampling simulation method proposed in this article not only considers the influence of seasons and weather on photovoltaic output, but also eliminates the fragmentation between adjacent months. The simulation results are superior to traditional algorithms.
2. Photovoltaic output model
The semiconductor photoelectric effect principle used in photovoltaic power generation converts light energy into electrical energy. Research has found that the output of photovoltaic power generation is as shown in equation (1) [14].
\( {I_{Q}}={N_{a}}{I_{e}}-{N_{a}}{I_{h}}[{e^{\frac{q(U+{I_{h}}{R_{b}})}{mKT{N_{b}}}}}-1]\ \ \ (1) \)
In the formula: IQ is the load current, Ie is the photo generated current, Ih is the reverse saturation current value of the P-N junction, K is the Boltzmann constant, m is the ideal current factor, T is the battery temperature, U is the applied voltage value, Rb is the equivalent resistance value of the series resistor, Nb is the number of series resistors, and Na is the number of parallel resistors.
Photovoltaic power generation is mainly affected by factors such as battery temperature and photocurrent, and the magnitude of photocurrent is mainly determined by the intensity of light radiation. Generally speaking, as the intensity of light radiation increases within a certain range, the more charge carriers are excited in the semiconductor material, resulting in a larger photogenerated current. The relationship between photogenerated current and light radiation intensity can be shown by equation (2).
\( {I_{e}}=η\cdot {P_{0}}\cdot {e^{-αd}}\ \ \ (2) \)
In the formula, η Is the photoelectric conversion efficiency, P0 is the incident light power density, α Is the absorption coefficient of semiconductor materials, and d is the optical path length.
In a photovoltaic power plant, assuming the presence of multiple photovoltaic panels of a certain area, the expression for photovoltaic power generation is shown in (3).
\( \begin{cases}\begin{matrix}{P_{pv}}=kS{H_{e}} \\ S=\sum _{j=1}^{n}{S_{j}} \\ \end{matrix}\end{cases}\ \ \ (3) \)
In the formula, S is the total area of the photovoltaic panel, He is the solar irradiation intensity per unit area, and k is the conversion efficiency.
After research, it was found that the probability distribution of light intensity is similar to that of wind speed and can be represented by the Beta distribution function. That is, the probability density function of light intensity is shown in equation (4), as shown in Figure 1:
\( f(\frac{H}{{H_{max}}})=\frac{Γ(θ+β)}{Γ(θ)Γ(β)}{(\frac{H}{{H_{max}}})^{β-1}}{(1-\frac{H}{{H_{max}}})^{θ-1}}\ \ \ (4) \)
In the formula, H is the actual intensity value of light, and Hmax is the maximum actual intensity value of light during the corresponding time period, β and θ It is a function shape parameter.
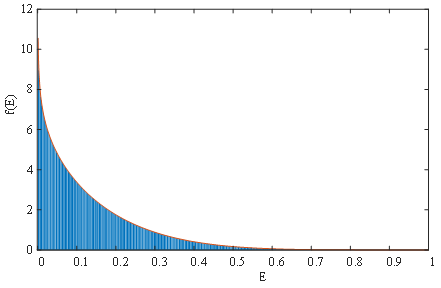
Figure 1. Probability density curve of light intensity
Through the model analysis in the previous text, it can be found that the radiation intensity He of light can be determined by two discrete variables: the actual intensity H of light and the maximum value Hmax of light, while the output power Ppv of photovoltaic power generation can be expressed linearly by the radiation intensity He. Therefore, this article believes that the output power of photovoltaic power generation and the intensity of light follow the same type of stochastic process. The actual intensity of light H is influenced by various factors. Figure 2 shows the 8760-hour photovoltaic output timing chart.
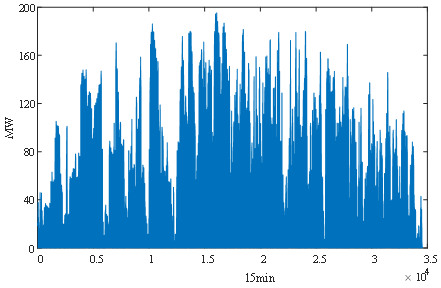
Figure 2. 8760h PV output curve
3. Markov Chain Photovoltaic Output Simulation Model
The rolling sampling Markov chain simulation method used in this article is based on the traditional Markov chain simulation method, which only has one state transition matrix. According to different months, seasons, and weather types, the transition probability matrix is divided into multiple interconnected output state transition probability matrices and weather transition probability matrices by rolling sampling the photovoltaic output historical data with a sampling period of 10 days and a sampling step of 1 day, Reduced the time span of the sampling interval, eliminated the discontinuity in the traditional method of the first and last days of adjacent months, and thus improved the accuracy of the model.
3.1. A weather probability transition matrix considering seasonal characteristics
The probability transition matrix of weather, as the core of Markov time series simulation method, needs to classify weather types. Considering the factors of seasonal changes, the photovoltaic output is characterized by different output characteristics in four seasons within 12 months of a year. Therefore, the weather type for the whole year is first set, and based on this, the weather with higher frequency each month is statistically analyzed using a rolling sampling Markov chain, and a corresponding weather probability transition matrix is established. For example, in January, a weather probability transition matrix is established for 6 types of weather. The matrix form is as follows, where S, L, M, C, Y, and H represent the 6 types of weather that occur in a month, and P (L|S) represents the probability of the previous day’s weather type S being L for that day.
\( {P_{wt}}=[\begin{matrix}{P_{(S|S)}} & {P_{(L|S)}} & {P_{(M|S)}} & {P_{(C|S)}} & {P_{(Y|S)}} & {P_{(H|S)}} \\ {P_{(S|L)}} & {P_{(L|L)}} & {P_{(M|L)}} & {P_{(C|L)}} & {P_{(Y|L)}} & {P_{(H|L)}} \\ {P_{(S|M)}} & {P_{(L|M)}} & {P_{(M|M)}} & {P_{(C|M)}} & {P_{(Y|M)}} & {P_{(H|M)}} \\ {P_{(S|C)}} & {P_{(L|C)}} & {P_{(M|C)}} & {P_{(C|C)}} & {P_{(Y|C)}} & {P_{(H|C)}} \\ {P_{(S|Y)}} & {P_{(L|Y)}} & {P_{(M|Y)}} & {P_{(C|Y)}} & {P_{(Y|Y)}} & {P_{(H|Y)}} \\ {P_{(S|H)}} & {P_{(L|H)}} & {P_{(M|H)}} & {P_{(C|H)}} & {P_{(Y|H)}} & {P_{(H|H)}} \\ \end{matrix}]\ \ \ (5) \)
3.2. State transition probability matrix considering seasonal and weather characteristics
Divide the output status sequence based on actual photovoltaic output or historical data of local weather factors. When selecting the output state, the output range is divided based on the actual power accuracy. When the output range is between Pmin and Pmax, selecting Pr as the accuracy value, the discrete state number N is (Pmax Pmin)/Pr, and the output sequence is {X1, X2,..., Xt...}, where X1 corresponds to output (Pmin, Pmin+Pr), X2 corresponds to output state (Pmin+Pr, Pmin+2Pr), and so on. Due to the differences in output characteristics under different weather conditions each month, compared to the original Markov model, which places all states into the same state transition matrix, this paper focuses on different months based on α And weather type β Establish multiple state transition matrices P separately below α, β Based on this, 365 state transition matrices were generated using a rolling sampling method. Compared to the original method, it eliminates the increase in error caused by the separation between adjacent months.
3.3. Simulated output sequence generation process
This article is based on the output situation and seasonal and weather characteristics of photovoltaic stations, and constructs a rolling sampling Markov chain model based photovoltaic output time series simulation method. The historical data is sampled by rolling with a sampling cycle of 10 days and a sampling step of 1 day. Specific step instructions:
Step 1: Sort the annual data by month α, weather type β classify the daily photovoltaic output into upper and lower parts at 12:00 intervals, and obtain the power state transition probability matrix PS of the photovoltaic output with a sampling period of 10 days;
Step 2: Assuming the initial moment is t0, select the current output power value, determine its output state X0 through normalization operation, and select the initial month as α0, initial date is η0;
Step 3: Based on the initial α0 and η0. Determine the sampling starting point and generate the corresponding weather state transition matrix Pɑ0,β based on statistical probability for a total of 370 sets of data with a sampling period of 10 days. This matrix reflects the weather change patterns of adjacent two days and generates random numbers ε0. Determine the initial weather type based on the probability matrix of weather state transition β0.
Step 4: Obtain the next output state Xt1 from Xt0 and the power state transition matrix PS, and generate a random number ε1. Find the corresponding output change in the state transition probability matrix within the precision requirement value Pr, and superimpose it with the current output state to obtain the final Xt1;
Step 5: Repeat step 4 in a loop until the simulation of the current day’s output status is completed. Based on the weather conditions of the day, generate the predicted weather for the next day through the weather probability transition matrix, and generate the output status Xm0 at the first moment of the next day. At the same time, generate the output status Xm0 from the β0 and the probability matrix P of weather state transition Pɑ0,β tain the weather conditions for the next day β1;
Step 6: Execute steps 2 to 5, and also scroll back one day in sequence using the rolling sampling method to generate the output sequence for the next day, until all output sequences for 365 days of the year are generated.
4. Simulation analysis
This example uses the daily radiation intensity data of a photovoltaic power station in Jiangsu Province from 8:00 to 17:00 throughout the year for simulation verification. The time interval for historical data is 15 minutes. The rated power of the photovoltaic power station is 3.5MW. Select 5kW as the required precision value for photovoltaic output.
This article focuses on the 10 main weather types classified by the National Meteorological Administration of China. The schematic diagram of 10 typical daily output curves for different weather conditions is shown in Figure 4.
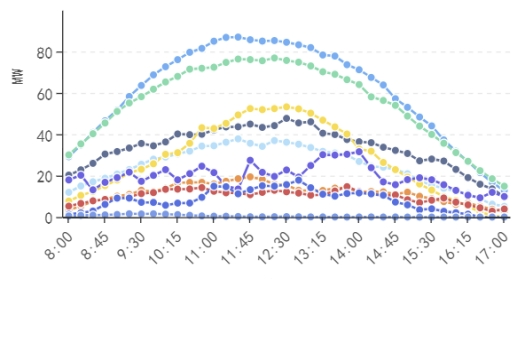
Figure 3. PV output diagram of ten weather types
Generate the annual photovoltaic output power sequence using the rolling sampling Markov chain simulation method. Obtain its simulated photovoltaic output sequence throughout the day and compare it with the historical output sequence, Jan data shown in Figure 4.
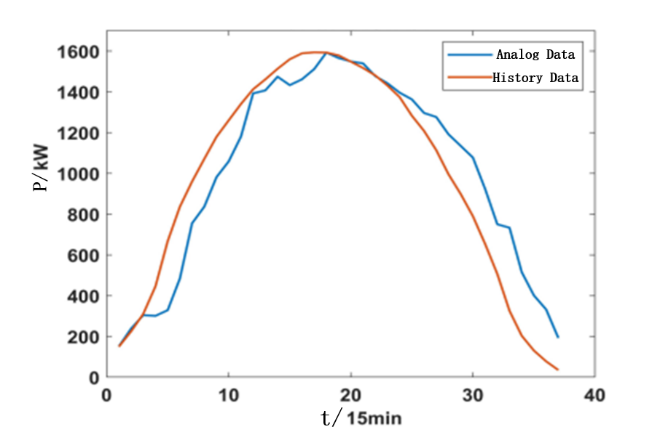
Figure 4. Jan time series model PV output sequence
Due to certain differences between the simulated weather conditions and historical reality, there is a certain error in the average photovoltaic output generated by the simulation compared to the historical sequence, but the overall trend of change is consistent. The entire probability matrix is consistent with the actual situation
5. Conclusions
This article proposes a photovoltaic output time series simulation method based on Markov chain model. Eliminated the problem of decreased model accuracy caused by fragmentation in adjacent months. The calculation results show that the improved time series production simulation method is more in line with historical data in terms of maximum photovoltaic output, with small errors, proving that the improved method is effective and feasible, consistent with the actual output change trend.
References
[1]. LIU Dunnan, LI Qi, QIN Lijuan, ZHAO Jiawei. Evaluation of Grid Accepting Renewable Energy in Multi-Time Scale [J]. Electric Power Construction, 2017, 38(07): 44-50.
[2]. DING Ming, LIN Yujuan, PAN Hao. Probabilistic Production Simulation Considering Time Sequence Characteristics of Load and New Energy [J]. Proceedings of the CSEE, 2022, 206(11): 33-35+39.
[3]. ZUO Liguang, LIU Zhouzhou, PENG Xu. Evaluation of Cross-regional New Energy Consumption in Power Grid Based on Timing Production Simulation [J]. ENERGY AND ENERGY CONSERVATION, 2022, 206(11): 33-35+39..
[4]. LI Yudun, XIE Kaigui. Reliability assessment of power systems containing multiple wind farms [J]. JOURNAL OF EIECTRIC POWER SCIENCE AND TECHNOLOGYE, 2011, 26(01): 73-76+103.
[5]. X. Peng, G. Gao, G. Hu, Y. Guo, J. Cao and J. Zhao. Research on Inter-regional Renewable Energy Accommodation Assessment Method Based on Time Series Production Simulation[C]//2019 IEEE Sustainable Power and Energy Conference, 2019, pp. 2031-2036.
[6]. YU Haifeng, HUANG Jingjie, JIANG Shiyao, et al. The overall energy storage configuration of wind farms considering thes ervice life of electric energy storage [J]. JOURNAL OF EIECTRIC POWER SCIENCE AND TECHNOLOGYE, 2022, 37(04):152-160.
[7]. LIU Chun, QU Jixian, SHI Wenhui. Evaluation Method of Ability of Accommodation Renewable Energy Based on Probabilistic Production Simulation [J]. Proceedings of the CSEE, 2020, 40(10): 3134-3144.
[8]. CHEN Qichao, LI Hui, WANG Shuai, et al. Sequential Operation Simulation Technology for Renewable Energy Accommodation Considering Multi-Energy Complementarity [J]. Electric Power Construction, 2019, 40(07): 18-25.
[9]. MEI Shengwei, WANG Yingying, LIU Feng. Game Theory Planning Model and Analysis of Wind-light-storage Hybrid Power System [J]. Automation of Elecctric Power Systems, 2011, 35(20): 13-19.
[10]. LIU Zhen, ZHENG Wencong. Reliability Evaluation of Microgrid Based on Typical Daily Method [J]. Telecom Power Technology, 2018, 35(03): 11-13.
[11]. YAO Jianfeng, LING Jing, QU Linan, DING Leiming, ZHENG Xiang, GAO Bingtuan. The Construction Method of Typical Scenario Set for Renewable Energy Based on Improved FCM Clustering Algorithm [J]. Power System and Clean Energy, 2019, 35(04): 76-82.
[12]. ZHANG Jun, XU Xiaoyan, HUANG Yongning, CAO Yang, GU Yujia. Optimal proportion study of wind and PV capacity in Ningxia power grid based on time sequence simulation [J]. Power System Protection and Control, 2014, 42(19): 81-86.
[13]. WU Guannan, ZHANG Mingli, XU Jianyuan, et al. Time series production algorithm for evaluating wind power accommodation capacity [J]. Power System Protection and Control, 2017, 45(23): 151-157.
[14]. ZHANG Bingliang, ZHANG Boyi, WU Yaowu, et al. An Approach to Evaluate the Capacity Benefits and Energy Benefits of Wind Farms Based onProbabilistic Product Simulation [J]. Power System Protection and Control, 2013, 46(08): 74-79.
Cite this article
Wang,Z. (2024). A markov chain based photovoltaic power simulation method. Applied and Computational Engineering,65,147-152.
Data availability
The datasets used and/or analyzed during the current study will be available from the authors upon reasonable request.
Disclaimer/Publisher's Note
The statements, opinions and data contained in all publications are solely those of the individual author(s) and contributor(s) and not of EWA Publishing and/or the editor(s). EWA Publishing and/or the editor(s) disclaim responsibility for any injury to people or property resulting from any ideas, methods, instructions or products referred to in the content.
About volume
Volume title: Proceedings of Urban Intelligence: Machine Learning in Smart City Solutions - CONFSEML 2024
© 2024 by the author(s). Licensee EWA Publishing, Oxford, UK. This article is an open access article distributed under the terms and
conditions of the Creative Commons Attribution (CC BY) license. Authors who
publish this series agree to the following terms:
1. Authors retain copyright and grant the series right of first publication with the work simultaneously licensed under a Creative Commons
Attribution License that allows others to share the work with an acknowledgment of the work's authorship and initial publication in this
series.
2. Authors are able to enter into separate, additional contractual arrangements for the non-exclusive distribution of the series's published
version of the work (e.g., post it to an institutional repository or publish it in a book), with an acknowledgment of its initial
publication in this series.
3. Authors are permitted and encouraged to post their work online (e.g., in institutional repositories or on their website) prior to and
during the submission process, as it can lead to productive exchanges, as well as earlier and greater citation of published work (See
Open access policy for details).
References
[1]. LIU Dunnan, LI Qi, QIN Lijuan, ZHAO Jiawei. Evaluation of Grid Accepting Renewable Energy in Multi-Time Scale [J]. Electric Power Construction, 2017, 38(07): 44-50.
[2]. DING Ming, LIN Yujuan, PAN Hao. Probabilistic Production Simulation Considering Time Sequence Characteristics of Load and New Energy [J]. Proceedings of the CSEE, 2022, 206(11): 33-35+39.
[3]. ZUO Liguang, LIU Zhouzhou, PENG Xu. Evaluation of Cross-regional New Energy Consumption in Power Grid Based on Timing Production Simulation [J]. ENERGY AND ENERGY CONSERVATION, 2022, 206(11): 33-35+39..
[4]. LI Yudun, XIE Kaigui. Reliability assessment of power systems containing multiple wind farms [J]. JOURNAL OF EIECTRIC POWER SCIENCE AND TECHNOLOGYE, 2011, 26(01): 73-76+103.
[5]. X. Peng, G. Gao, G. Hu, Y. Guo, J. Cao and J. Zhao. Research on Inter-regional Renewable Energy Accommodation Assessment Method Based on Time Series Production Simulation[C]//2019 IEEE Sustainable Power and Energy Conference, 2019, pp. 2031-2036.
[6]. YU Haifeng, HUANG Jingjie, JIANG Shiyao, et al. The overall energy storage configuration of wind farms considering thes ervice life of electric energy storage [J]. JOURNAL OF EIECTRIC POWER SCIENCE AND TECHNOLOGYE, 2022, 37(04):152-160.
[7]. LIU Chun, QU Jixian, SHI Wenhui. Evaluation Method of Ability of Accommodation Renewable Energy Based on Probabilistic Production Simulation [J]. Proceedings of the CSEE, 2020, 40(10): 3134-3144.
[8]. CHEN Qichao, LI Hui, WANG Shuai, et al. Sequential Operation Simulation Technology for Renewable Energy Accommodation Considering Multi-Energy Complementarity [J]. Electric Power Construction, 2019, 40(07): 18-25.
[9]. MEI Shengwei, WANG Yingying, LIU Feng. Game Theory Planning Model and Analysis of Wind-light-storage Hybrid Power System [J]. Automation of Elecctric Power Systems, 2011, 35(20): 13-19.
[10]. LIU Zhen, ZHENG Wencong. Reliability Evaluation of Microgrid Based on Typical Daily Method [J]. Telecom Power Technology, 2018, 35(03): 11-13.
[11]. YAO Jianfeng, LING Jing, QU Linan, DING Leiming, ZHENG Xiang, GAO Bingtuan. The Construction Method of Typical Scenario Set for Renewable Energy Based on Improved FCM Clustering Algorithm [J]. Power System and Clean Energy, 2019, 35(04): 76-82.
[12]. ZHANG Jun, XU Xiaoyan, HUANG Yongning, CAO Yang, GU Yujia. Optimal proportion study of wind and PV capacity in Ningxia power grid based on time sequence simulation [J]. Power System Protection and Control, 2014, 42(19): 81-86.
[13]. WU Guannan, ZHANG Mingli, XU Jianyuan, et al. Time series production algorithm for evaluating wind power accommodation capacity [J]. Power System Protection and Control, 2017, 45(23): 151-157.
[14]. ZHANG Bingliang, ZHANG Boyi, WU Yaowu, et al. An Approach to Evaluate the Capacity Benefits and Energy Benefits of Wind Farms Based onProbabilistic Product Simulation [J]. Power System Protection and Control, 2013, 46(08): 74-79.