


1. Introduction
With the continuous development of the wine industry, the study of wine grades has received more and more attention [1]. Wine grade is one of the important indicators for assessing the quality of wine, which can reflect the taste, aroma, colour and other characteristics of wine, and can also guide consumers to make purchases [2]. Therefore, the study of predicting wine grades is of great practical significance.
Machine learning is a method that uses computer algorithms to identify patterns and laws, and it has been widely used in various fields [3,4]. In terms of predicting wine grades, machine learning can be used to predict wine grades by analysing factors such as the chemical composition of the wine and the production process [5,6]. Compared with traditional manual evaluation methods, machine learning can predict wine grades more accurately, while also saving time and labour costs [7].
In terms of wine grade prediction, machine learning algorithms can be applied in several ways, such as classification, regression, and clustering [8,9]. Among them, classification algorithms can classify wines into different grades, regression algorithms can predict specific values of wine grades, and clustering algorithms can classify wines into different categories [10]. In recent years, machine learning has made some important advances in predicting wine grades. Some researchers have used Support Vector Machine (SVM) algorithms to predict wine grades, while others have used Principal Component Analysis (PCA) to extract features of wines. There are also researchers who use Artificial Neural Network (ANN) algorithms to predict wine grades, a method that improves the accuracy of predictions by learning from large amounts of wine data.
Research on predicting wine grades is of great practical significance for improving wine quality and guiding consumers in their purchases. Machine learning, as a powerful analytical tool, also has an important role in predicting wine grades. In this paper, we first perform data mining and visualisation analysis on wine quality related data, and finally apply multiple machine learning algorithms to predict wine grades, and compare the effectiveness of multiple machine learning algorithms on wine grade prediction.
2. Source of data sets
The dataset was selected from the publicly available dataset in the UCL database, which describes the levels of various chemicals in wine and their effect on wine quality. The wine evaluation indexes include fixed acidity, volatile acidity, citric acid, residual sugar, chloride, free sulphur dioxide, total sulphur dioxide, density, pH, sulphate and alcohol, and the quality level of wines is divided into a total of quality levels such as 0-10.
3. Data preprocessing
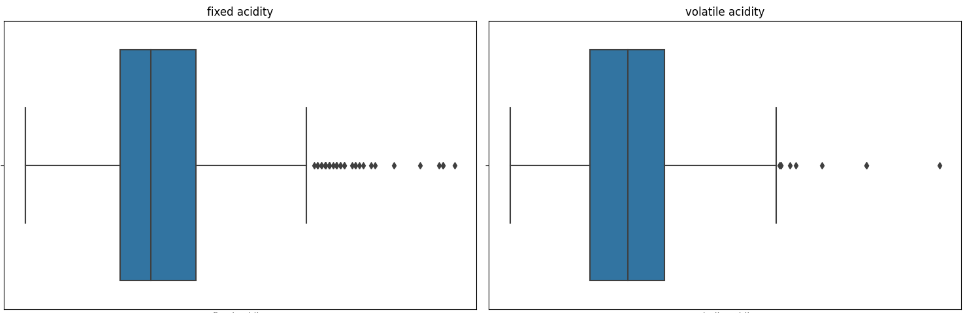
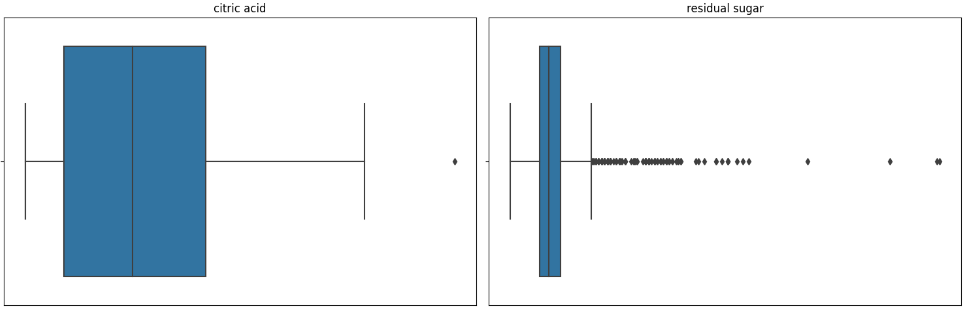
A box plot is a chart used to show the distribution of data. It can display information such as the median, upper and lower quartiles, maximum and minimum values, and outliers of the data. Through the box plot, we can determine whether there are outliers in the data and take appropriate treatment.
Firstly, we draw box plots for the indicators that may have outliers to judge whether there are outliers or not, and then we use the average value to replace the outliers as the result of data pre-processing, and the box plots of some indicators are shown in Figure 1.
(b)
(c) (d)
Figure 1. (a) Indicator A Box Chart, (b) Indicator B Box Chart, (c) Indicator C Box Chart, (d) Indicator D Box Chart. (Photo credit: Original)
4. Relevance analysis
Correlation analysis is a statistical method used to study the relationship between two or more variables. Pearson's correlation coefficient is one of the most commonly used correlation coefficients and it measures the linear relationship between two continuous variables. It takes values between -1 and 1, where 1 indicates a perfect positive correlation, -1 indicates a perfect negative correlation, and 0 indicates no correlation. Spearman's rank correlation coefficient, on the other hand, applies to a non-linear relationship between two variables; it converts the variables into ranks and then calculates the correlation between the ranks. The Chebyshev distance, on the other hand, is a method used to measure the maximum difference between two variables. Correlation analysis was done between the evaluation indexes of wine (fixed acidity, volatile acidity, citric acid, residual sugar, chloride, free sulphur dioxide, total sulphur dioxide, density, pH, sulphate and alcohol) and the quality grades of wine and correlation heatmap was plotted and the results are shown in Figure 2.
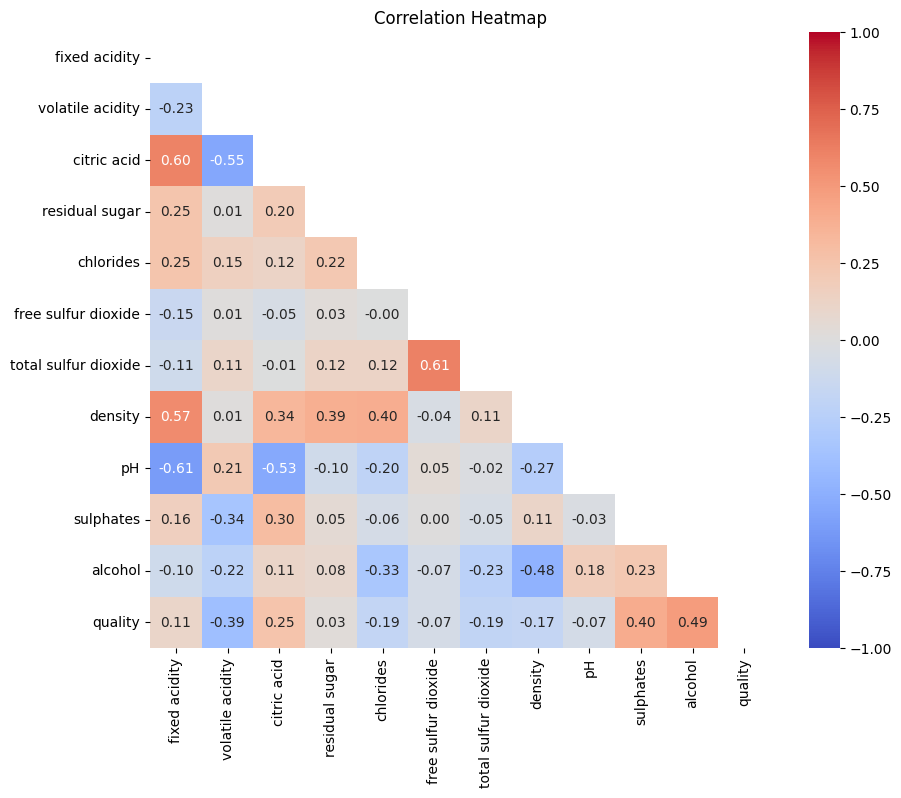
Figure 2. Correlation heat map. (Photo credit: Original)
The closer the colour is to red, the more positive the correlation is between the two variables, and the closer the colour is to blue, the more negative the correlation is between the two variables. From the correlation heat map, it can be seen that there is a strong positive correlation between the various indexes of the wines and the quality level of the wines.
5. Machine Learning Algorithms
5.1. Decision tree algorithm
Decision tree is a classification and regression model based on a tree structure that organises a series of decisions and possible outcomes into a tree structure. In a decision tree, each node represents a decision or a feature, each branch represents a possible outcome, and the final leaf node represents the final decision result. Decision tree models are widely used in the fields of data mining, machine learning and artificial intelligence, which can handle many types of data, including discrete and continuous data.
The construction of a decision tree model consists of two main steps: tree generation and tree pruning. Tree generation refers to the process of constructing a decision tree from training data, and tree pruning refers to the pruning of the decision tree so that it can be better generalised to new datasets.
5.2. Random forest
Random Forest is an integrated learning algorithm based on decision trees, which improves the generalisation ability and robustness of the model by constructing multiple decision trees at the same time and combining their results. Random forest model is widely used in the fields of data mining, machine learning, artificial intelligence, etc., and it can handle many types of data, including discrete and continuous data.
In the random forest model, each decision tree is obtained by randomly selecting a portion of samples and a portion of features from the training data for training. In each construction of the decision tree, the random forest model randomly selects a part of the features from all the features, and then selects the optimal features from this part of the features for splitting.
5.3. XGBoost
XGBoost is an integrated learning algorithm based on decision trees, which is optimised and improved on the basis of gradient boosting trees, with higher accuracy and faster speed. The XGBoost model is widely used in the fields of data mining, machine learning, artificial intelligence, etc., and it can deal with a variety of types of data, including discrete and continuous data.
In the XGBoost model, each decision tree is obtained by training through gradient boosting. During gradient boosting, the XGBoost model prioritises samples with larger gradients and adjusts the weight of each sample according to the size of the gradient. This has the advantage of speeding up the training process of the model and improving the accuracy of the model.
6. Experiments and Results
The data were divided into training set, validation set and test set according to the ratio of 6:2:2, the input variables were the indicator characteristics of wines, and the output variables were the quality grades of wines, and the prediction effect of the model was evaluated by precision, accuracy, recall and F1, and the confusion matrix between the predicted values and the actual values was plotted, and the results were shown in Table 1-3 and Figure 3-5.
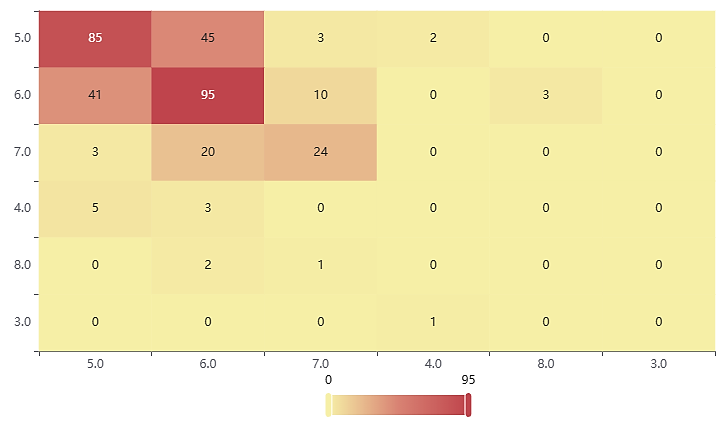
Figure 3. Decision tree confusion matrix. (Photo credit: Original)
Table 1. Decision tree model evaluation parameter.
Decision tree | Accuracy | Recall rate | Accuracy | F1 |
Training set | 0.792 | 0.792 | 0.791 | 0.779 |
Test set | 0.595 | 0.595 | 0.586 | 0.589 |
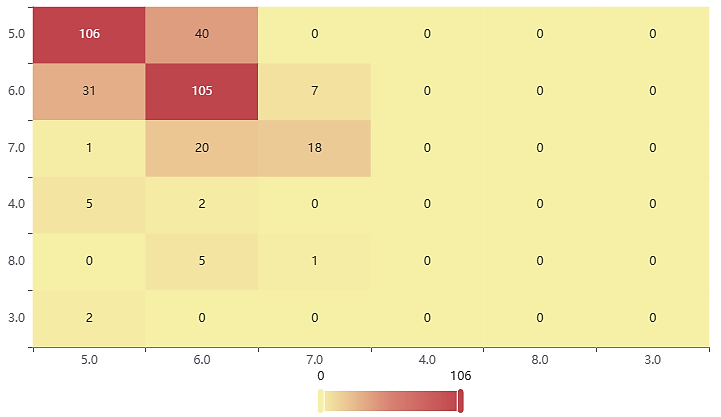
Figure 4. Random forest confusion matrix. (Photo credit: Original)
Table 2. Random forest model evaluation parameter.
Decision tree | Accuracy | Recall rate | Accuracy | F1 |
Training set | 0.81 | 0.81 | 0.772 | 0.789 |
Test set | 0.668 | 0.668 | 0.644 | 0.651 |
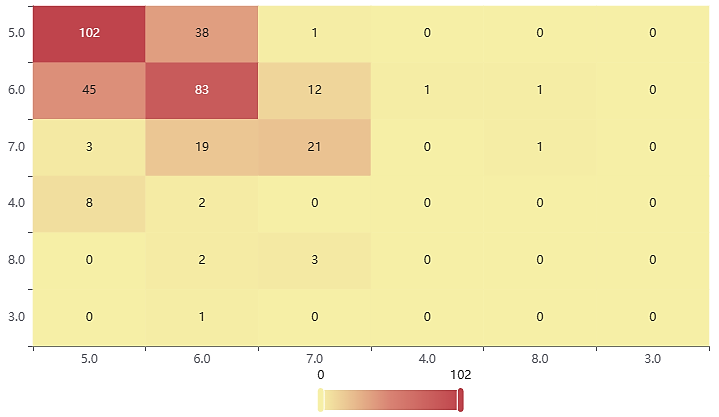
Figure 5. XGBoost confusion matrix. (Photo credit: Original)
Table 3. XGBoost model evaluation parameter.
Decision tree | Accuracy | Recall rate | Accuracy | F1 |
Training set | 1 | 1 | 1 | 1 |
Test set | 0.601 | 0.601 | 0.575 | 0.586 |
From the results, it can be seen that all three machine learning models achieve about 60% accuracy in predicting wine quality grades, with the Random Forest model having the best prediction of 66.8%; the XGBoost model also has a better prediction with 60.1% accuracy, and the Decision Tree model has a poorer prediction with an accuracy of 59.5%.
7. Conclusion
This paper mainly introduces the research on wine grade prediction, including the indexes for assessing wine quality, the division of the data set, the application of machine learning models and the evaluation of the prediction effect. The analysis results show that the prediction accuracy of the three machine learning models for wine quality grade reaches about 60%, among which the random forest model has the best prediction effect, reaching 66.8%; the XGBoost model also has a better prediction effect, with an accuracy of 60.1%, and the decision tree model has a worse prediction effect, with an accuracy of 59.5%.
This paper presents wine evaluation indexes, including fixed acidity, volatile acidity, citric acid, residual sugar, chloride, free sulphur dioxide, total sulphur dioxide, density, pH, sulphate and alcohol. These indicators can reflect the characteristics of wine in terms of taste, aroma and colour, which is an important basis for assessing the quality of wine. In the division of the data set, this paper divides the data into training set, validation set and test set according to the ratio of 6:2:2 to ensure the generalisation ability and prediction effect of the model.
This paper introduces the application of machine learning models, including Random Forest, XGBoost and Decision Tree. These models can achieve the prediction of wine grades by modelling the relationship between input and output variables. Among them, the Random Forest model has the best prediction effect with 66.8%; the XGBoost model also has a better prediction effect with 60.1% accuracy, and the Decision Tree model has a worse prediction effect with 59.5% accuracy. This indicates that the random forest model has better prediction ability in this problem and can be the preferred model.
In summary, this paper introduces the research of wine grade prediction, including evaluation index, dataset division, machine learning model and prediction effect evaluation. By analysing the results, it can be found that the random forest model has better prediction ability in this problem, but in the practical application, it is necessary to make trade-offs according to the needs and choose the appropriate model and evaluation index. In addition, this study can be further extended, such as considering more evaluation indicators or using deep learning models for prediction.
References
[1]. Le L ,Hurtado N P ,Lawrence I , et al.Applying Neural Networks in Wineinformatics with the New Computational Wine Wheel[J].Fermentation,2023,9(7):
[2]. Yu W ,Xingyi H ,Joshua A , et al.Novel colorimetric sensor array for Chinese rice wine evaluation based on color reactions of flavor compounds[J].Journal of Food Process Engineering,2021,44(12):
[3]. Evangelos D M ,Georgios M ,Charikleia K , et al.Explore the Rare—Molecular Identification and Wine Evaluation of Two Autochthonous Greek Varieties: “Karnachalades” and “Bogialamades”[J].Plants,2021,10(8):1556-1556.
[4]. Andrii T ,Jens W ,Wolfgang P , et al.Cooling Shock for Bottled Wine. How Dramatic Is This before Tasting?[J].Beverages,2020,6(4):62-62.
[5]. Wang J Q ,Spence C .A smooth wine? Haptic influences on wine evaluation[J].International Journal of Gastronomy and Food Science,2018,149-13.
[6]. Ferrer-Gallego R ,Puxeu M ,Nart E , et al.Evaluation of Tempranillo and Albariño SO 2 -free wines produced by different chemical alternatives and winemaking procedures[J].Food Research International,2017,102647-657.
[7]. Bruna C ,Carmel K,Amandine B, et al.Sparkling wine: Evaluation of the effect of bentonite fining for sparkling wine quality[J].Wine Viticulture Journal,2017,32(5):24-26.
[8]. Satoru S ,Satsuki H ,W. K P A , et al.Correction of Spectral Interference of Ethanol and Glucose for Rice Wine Evaluation[J].International Journal of Chemical Engineering and Applications,2015,6(4):267-272.
[9]. Yin S ,Liu L ,Gao X , et al.Multivariate Methods Based Soft Measurement for Wine Quality Evaluation[J].Abstract and Applied Analysis,2014,20141-7.
[10]. Kumar S Y ,Varakumar S ,Reddy O .Evaluation of antioxidant and sensory properties of mango ( Mangifera indica L.) wine[J].CyTA - Journal of Food,2012,10(1):12-20.
Cite this article
Zeng,C.;Fang,J.;Yang,Q.;Xiang,C.;Zhao,Z.;Lei,Y. (2024). Wine quality grade data analysis and prediction based on multiple machine learning algorithms. Applied and Computational Engineering,65,241-246.
Data availability
The datasets used and/or analyzed during the current study will be available from the authors upon reasonable request.
Disclaimer/Publisher's Note
The statements, opinions and data contained in all publications are solely those of the individual author(s) and contributor(s) and not of EWA Publishing and/or the editor(s). EWA Publishing and/or the editor(s) disclaim responsibility for any injury to people or property resulting from any ideas, methods, instructions or products referred to in the content.
About volume
Volume title: Proceedings of Urban Intelligence: Machine Learning in Smart City Solutions - CONFSEML 2024
© 2024 by the author(s). Licensee EWA Publishing, Oxford, UK. This article is an open access article distributed under the terms and
conditions of the Creative Commons Attribution (CC BY) license. Authors who
publish this series agree to the following terms:
1. Authors retain copyright and grant the series right of first publication with the work simultaneously licensed under a Creative Commons
Attribution License that allows others to share the work with an acknowledgment of the work's authorship and initial publication in this
series.
2. Authors are able to enter into separate, additional contractual arrangements for the non-exclusive distribution of the series's published
version of the work (e.g., post it to an institutional repository or publish it in a book), with an acknowledgment of its initial
publication in this series.
3. Authors are permitted and encouraged to post their work online (e.g., in institutional repositories or on their website) prior to and
during the submission process, as it can lead to productive exchanges, as well as earlier and greater citation of published work (See
Open access policy for details).
References
[1]. Le L ,Hurtado N P ,Lawrence I , et al.Applying Neural Networks in Wineinformatics with the New Computational Wine Wheel[J].Fermentation,2023,9(7):
[2]. Yu W ,Xingyi H ,Joshua A , et al.Novel colorimetric sensor array for Chinese rice wine evaluation based on color reactions of flavor compounds[J].Journal of Food Process Engineering,2021,44(12):
[3]. Evangelos D M ,Georgios M ,Charikleia K , et al.Explore the Rare—Molecular Identification and Wine Evaluation of Two Autochthonous Greek Varieties: “Karnachalades” and “Bogialamades”[J].Plants,2021,10(8):1556-1556.
[4]. Andrii T ,Jens W ,Wolfgang P , et al.Cooling Shock for Bottled Wine. How Dramatic Is This before Tasting?[J].Beverages,2020,6(4):62-62.
[5]. Wang J Q ,Spence C .A smooth wine? Haptic influences on wine evaluation[J].International Journal of Gastronomy and Food Science,2018,149-13.
[6]. Ferrer-Gallego R ,Puxeu M ,Nart E , et al.Evaluation of Tempranillo and Albariño SO 2 -free wines produced by different chemical alternatives and winemaking procedures[J].Food Research International,2017,102647-657.
[7]. Bruna C ,Carmel K,Amandine B, et al.Sparkling wine: Evaluation of the effect of bentonite fining for sparkling wine quality[J].Wine Viticulture Journal,2017,32(5):24-26.
[8]. Satoru S ,Satsuki H ,W. K P A , et al.Correction of Spectral Interference of Ethanol and Glucose for Rice Wine Evaluation[J].International Journal of Chemical Engineering and Applications,2015,6(4):267-272.
[9]. Yin S ,Liu L ,Gao X , et al.Multivariate Methods Based Soft Measurement for Wine Quality Evaluation[J].Abstract and Applied Analysis,2014,20141-7.
[10]. Kumar S Y ,Varakumar S ,Reddy O .Evaluation of antioxidant and sensory properties of mango ( Mangifera indica L.) wine[J].CyTA - Journal of Food,2012,10(1):12-20.