


1. Introduction
Petroleum energy has a significant impact on human development and is widely used in various fields such as industry, agriculture, transportation, and national defense. However, as a non-renewable resource, petroleum not only faces the situation of depletion but also causes serious environmental pollution to human society. To address the issues of exhaust pollution and energy consumption, various countries have shifted their attention to electric vehicles. The widespread advancement of electric vehicles has emerged as an unavoidable direction for the future of transportation.
With the increasing global demand for clean energy and new energy vehicles, lithium-ion batteries, as a key technology for energy storage, play an increasingly important role in electric vehicles, portable electronic products, and large-scale energy storage systems. However, the new energy vehicle industry is still in its early stages of development, and the technology of electric vehicles is far from mature compared to the internal combustion engine technology of traditional fuel vehicles. As the main energy source for pure electric vehicles, the basic characteristics of batteries determine the performance of the entire vehicle [1]. During use, batteries are prone to overcharging, over-discharging, and short-circuiting, which can even lead to thermal runaway and cause fires, significantly impacting the driving safety of electric vehicles [1].
The Battery Management System (BMS) is the technical core of electric vehicles and is an important channel for coordinating the work between the battery pack and the motor [2]. Its main functions include the estimation of the state of charge (SOC), state of health (SOH), state of energy (SOE), peak power estimation, remaining useful life (RUL) prediction, balance control management, and thermal management. Among them, the SOH and RUL of the battery have the greatest impact on BMS.
Machine learning technology has demonstrated significant promise in estimating battery health and predicting lifespan. Machine learning methods, especially deep learning, can learn complex patterns of battery aging by analyzing the historical working data of the battery, thereby achieving accurate predictions of battery SOH and RUL. Compared with traditional model-based methods, this approach can better handle the uncertainties and complexities in battery behavior and provide more accurate health status assessments.
Precise estimation of battery health can optimize the charging and discharging strategies, prolong battery lifespan, and offer early warnings for potential failures, thus ensuring the safety of electric vehicles and energy storage systems.
This research thoroughly examines the potential applications and challenges of machine learning in estimating the health state of lithium-ion batteries, aiming to enhance the accuracy and dependability of battery health estimation and lifespan prediction through a detailed analysis of battery aging data. By conducting these studies, it is anticipated to offer substantial technical support for optimizing battery management systems, ensuring the safe operation of electric vehicles, and facilitating battery recycling and reuse, thereby contributing to the advancement of new energy vehicles and sustainable energy systems.
2. Definition methods of lithium-ion battery SOH
SOH reflects the current capacity of a lithium-ion battery to store electrical energy compared to a brand-new battery, indicating its performance status throughout its entire lifecycle, quantified as a percentage [2]. At present, there is no clear indicator to define SOH internationally. Many parameters can be used to describe the performance status of a battery [3]. Common methods of defining SOH are divided into three categories [4].
(1) Maximum discharge capacity
\( SOH=\frac{{C_{now}}}{{C_{new}}}×100\% \) (1)
In Equation (1), \( {C_{now}} \) represents the current actual maximum discharge capacity of the battery, and \( {C_{new}} \) represents the rated capacity specified by the manufacturer. The final output result is expressed as a percentage.
(2)Actual change in internal resistance
\( SOH=\frac{{R_{EOL}}-{R_{now}}}{{R_{EOL}}-{R_{new}}}×100\% \) (2)
In Equation (2), \( {R_{EOL}} \) represents the internal resistance of the power battery at the end of its life, \( {R_{now}} \) represents the current internal resistance of the battery, and \( {R_{new}} \) represents the internal resistance of a brand-new battery. The final calculation result is also expressed as a percentage.
(3)Number of battery cycles
\( SOH=\frac{{N_{remain}}}{{N_{total}}}×100\% \) (3)
In Equation (3), \( {N_{remain}} \) represents the remaining charge-discharge cycle count of the battery, and \( {N_{total}} \) represents the total charge-discharge cycle count. The final result is expressed as a percentage.
3. Methods
3.1. Research motivation and dataset acquisition
Gaining a thorough understanding of the working principle and aging causes of lithium-ion batteries is crucial for conducting research on the estimation of SOH [5]. Based on the historical data of lithium-ion batteries, machine learning methods can fully mine features that reflect the aging trend of batteries, thereby achieving an accurate assessment of SOH. A comprehensive analysis of the aging causes of lithium-ion battery SOH throughout its entire lifecycle, coupled with the advantages offered by artificial intelligence, can effectively enhance the service life and prediction accuracy of onboard lithium-ion power batteries. This lays a solid foundation for the swift advancement of the new energy industry and lithium-ion power batteries [6].
This experiment adopts the NASA dataset [7,8], which is widely used in the study of the aging characteristics of lithium-ion batteries. The experiment uses 18650-type lithium-ion batteries and is conducted at a room temperature of 24°C. The aging test data for the lithium-ion batteries are acquired through repeated charging and discharging cycles, as well as impedance testing.
3.2. Multiple linear regression
3.2.1. Overview of multiple linear regression. Multiple Linear Regression (MLR) is a statistical analysis technique that examines the linear relationship between two or more independent variables (explanatory variables) and one dependent variable (response variable) [9]. Contrary to simple linear regression, which only considers the impact of one independent variable on the dependent variable, multiple linear regression takes into account the effects of multiple independent variables, allowing for a more comprehensive understanding of the relationships between variables.
Multiple linear regression is widely used in various fields, such as demand analysis in economics, population studies in sociology, and disease risk assessment in medicine. Through multiple linear regression models, researchers can explore and quantify the impact of multiple factors on a phenomenon, providing a scientific basis for decision-making.
Although the model established by multiple linear regression is a linear model, and the behavior of lithium-ion batteries is typically nonlinear, an analysis of the relationship between cycle count and SOH in the dataset reveals a certain linear correlation (refer to Fig. 1). This observation supports the notion that multiple linear regression can be employed to predict the SOH of lithium-ion batteries.
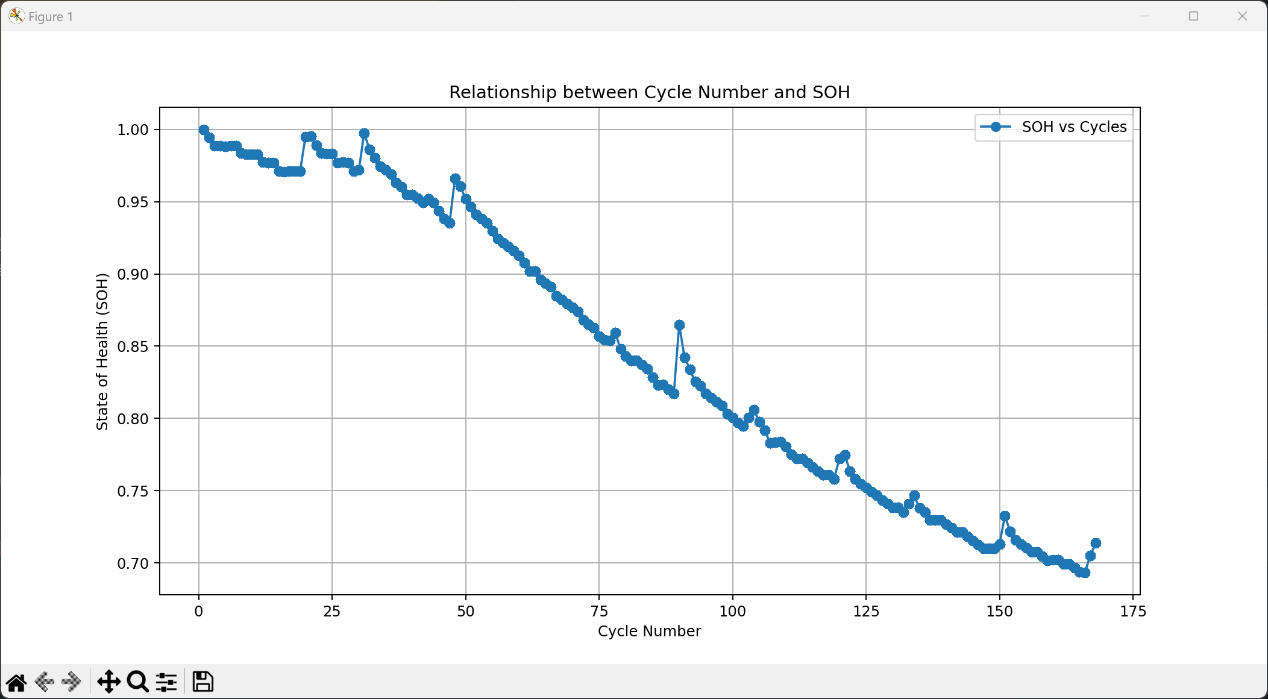
Figure 1. Visualization image of SOH and cycles.
3.2.2. Selection of feature values. The selection of feature values has a significant impact on the multiple linear regression problem, directly affecting the model's explanatory power, prediction accuracy, and generalization ability. Firstly, proper feature selection can eliminate independent variables that are irrelevant or weakly associated with the dependent variable, thereby improving the model's interpretability and more clearly revealing the relationships between variables. Secondly, reasonable feature selection helps reduce the complexity of the model, avoid overfitting, and thus improve the model's prediction accuracy and generalization ability. In multiple linear regression, too many features may lead to instability in model parameter estimation and an increase in variance, thereby reducing the model's predictive performance. Moreover, feature selection can also reduce the computational cost of model training and prediction, improving the model's computational efficiency. In summary, the selection of feature values is a key step in the multiple linear regression modeling process, having a decisive impact on the model's performance and application effectiveness.
Therefore, in this study, all data in the dataset are analyzed to generate a heatmap of correlation with capacitance, which can then be used to select parameters with high correlation with capacitance as feature values. Fig. 2 is the correlation heatmap:
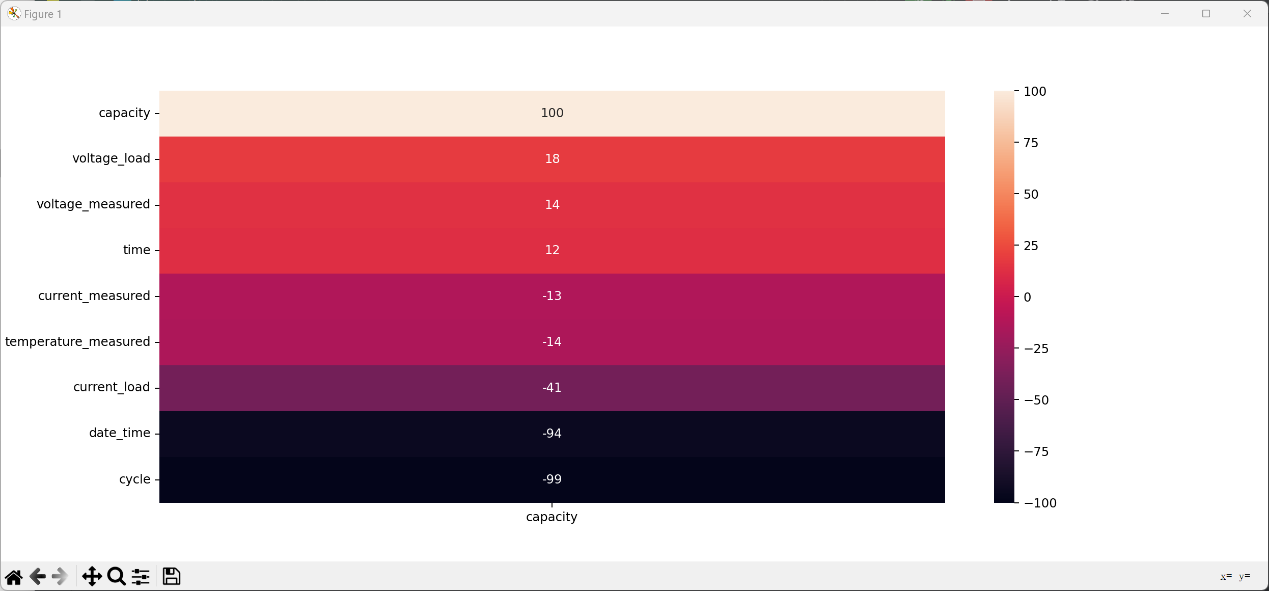
Figure 2. Heat map of the correlation between various parameters and capacitance in the dataset.
From the correlation heatmap, it can be seen that the cycle count has a very high correlation with the experiment time and capacitance, while the commonly considered variables such as voltage, current, and temperature do not have a high correlation with capacitance. Therefore, in using multiple linear regression to predict the SOH of lithium-ion batteries, it is proposed to select different feature values for five predictions to explore the impact of different feature values on the prediction results. The feature values used in the five predictions are as follows:
(1) Full Model (B005_model_full_train): Uses all variables except capacity as predictor variables.
(2) Model 1: Uses only cycle and current_load as predictor variables.
(3) Model 2: Uses only date_time and current_load as predictor variables.
(4) Model 3: Uses cycle, current_load, and temperature_measured as predictor variables.
(5) Model 4: Uses voltage_load, current_load, and temperature_measured as predictor variables.
3.3. Support vector machine
The Support Vector Machine (SVM) is a robust supervised learning algorithm employed for both classification and regression analysis. Its fundamental principle involves identifying an optimal hyperplane that segregates different classes of data points while maximizing the margin between the hyperplane and the nearest data points. These nearest points are termed support vectors, and they play a crucial role in determining the position and orientation of the hyperplane.
4. Results and analysis
4.1. Analysis of the MLR model results
4.1.1. RMSE evaluation results. RMSE (Root Mean Square Error) is a widely utilized metric for assessing the performance of multiple linear regression models. It quantifies the average discrepancy between the predicted values and the actual values of the model, offering a quantitative evaluation of the model's predictive accuracy. In multiple linear regression, multiple independent variables are typically employed to predict the value of the dependent variable. Hence, an indicator that thoroughly accounts for the differences between each predicted value and the actual value is required, and RMSE serves as such an indicator.
Firstly, RMSE serves as an indicator of the model's predictive accuracy. By calculating RMSE, one can gauge the magnitude of the model's prediction error. A small RMSE signifies high predictive accuracy, indicating that the model can accurately predict the value of the dependent variable. On the contrary, a large RMSE suggests low predictive accuracy, implying that the prediction results may not be reliable.
Secondly, RMSE can also be used to compare the predictive performance of different models. In practical applications, multiple different multiple linear regression models may be established to predict the same dependent variable. By comparing their RMSE values, the model with the best prediction effect can be found. Generally, models with smaller RMSE are considered to be better models because they can more accurately predict the value of the dependent variable.
By importing the NASA dataset and employing the multiple linear regression model with the feature values mentioned in Section 3.2.2 as inputs and the SOH as the output, the model can be trained to establish the optimal SOH estimation model. Fig. 3 illustrates RMSE results of each model:
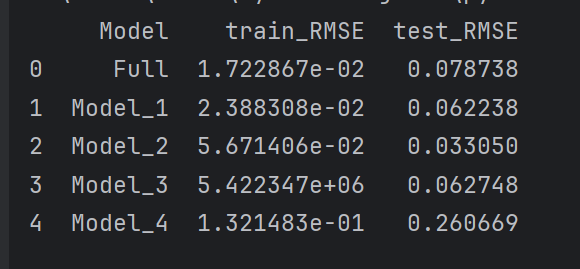
Figure 3. RMSE evaluation index of each model.
From Fig. 3, it is evident that the algorithm model based on multiple linear regression can accurately estimate the SOH. The first four models all achieved good results in the test data, with RMSE evaluation indicators of 7.87%, 6.22%, 3.30%, and 6.27%, respectively. Among them, Model 2, which uses date_time and current_load as predictor variables, has a particularly obvious prediction effect. However, Model 4, which uses voltage_load, current_load, and temperature_measured as predictor variables, has an RMSE evaluation indicator as high as 26.07%, indicating that the model established with these feature values cannot reliably and accurately predict the changing pattern of lithium-ion battery SOH.
4.1.2. Scatter plot results of the model's fitted values and residuals. The scatter plot of the model's fitted values and residuals is a graphical tool used to check whether a linear regression model is suitable for the data. In linear regression analysis, the model is usually fitted to obtain predicted values, and residuals are calculated. The scatter plot of fitted values and residuals can help visually observe the model's fitting situation and the distribution of residuals, thereby evaluating the model's rationality and accuracy. Fig. 4 is the scatter plot of fitted values and residuals in this study:
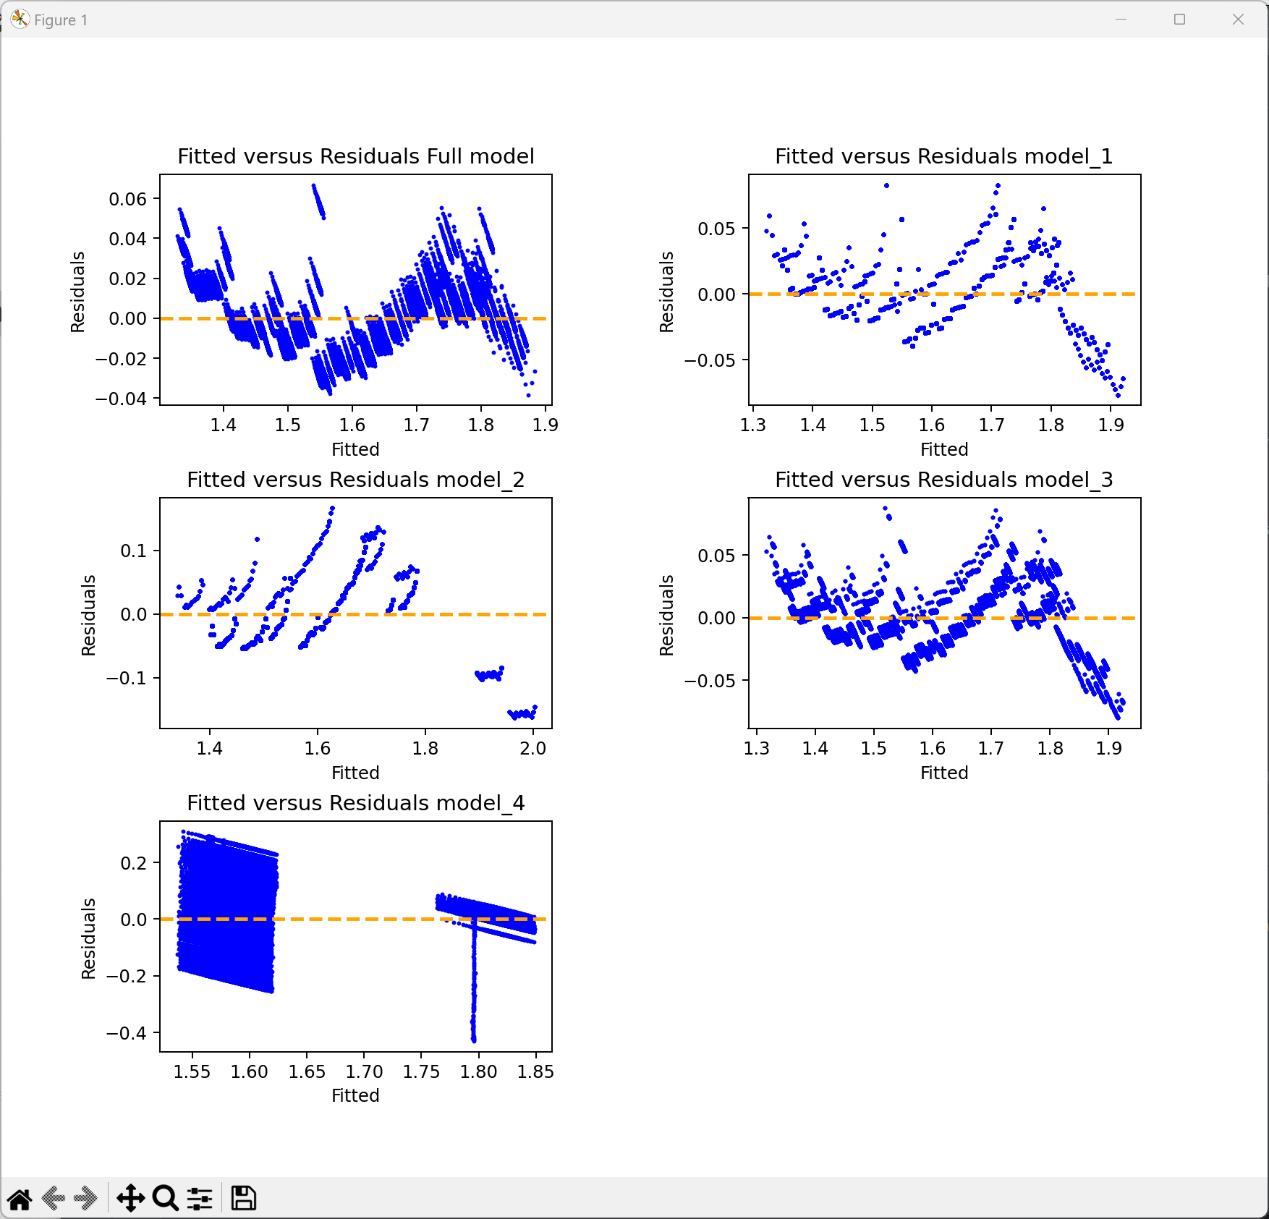
Figure 4. Distribution of residual values for each model.
From Fig. 4, it can be seen that for the first four models, the residuals are relatively evenly distributed but show some fluctuations with the increase of fitted values. This is because, as mentioned in Section 3.2.1, although the SOH graph generally shows linear correlation, the graph curve itself has fluctuations. This results in the residuals of the prediction results not being particularly evenly distributed. For Model 5, the residuals show a higher degree of regularity, indicating that the predictions of Model 5 are not reliable. This also corroborates the results in Section 4.1.1.
4.1.3. Normal Q-Q plot results of model residuals. The normal Q-Q plot of model residuals is a graphical tool used to check whether the residuals of a linear regression model follow a normal distribution. In linear regression analysis, the residuals of the model are usually tested to ensure that the assumptions of the model are satisfied. The normal Q-Q plot is one of the commonly used testing methods. Specifically, in a normal Q-Q plot, if the residuals follow a normal distribution, the points should approximately align along a straight line. Conversely, if the points deviate significantly from a straight line, it indicates that the residuals do not adhere to a normal distribution. Fig. 5 is the normal Q-Q plot of the residuals of the models in this study. From Fig. 5, it can be seen that the residuals of Model 1 and Model 3 are most consistent with a normal distribution, while Model 2 generally shows a normal distribution but may have some outliers causing fluctuations in the distribution. The full model and Model 4 obviously do not follow a normal distribution, so it can be concluded that the predictions of the full model and Model 4 for the SOH are not reliable.
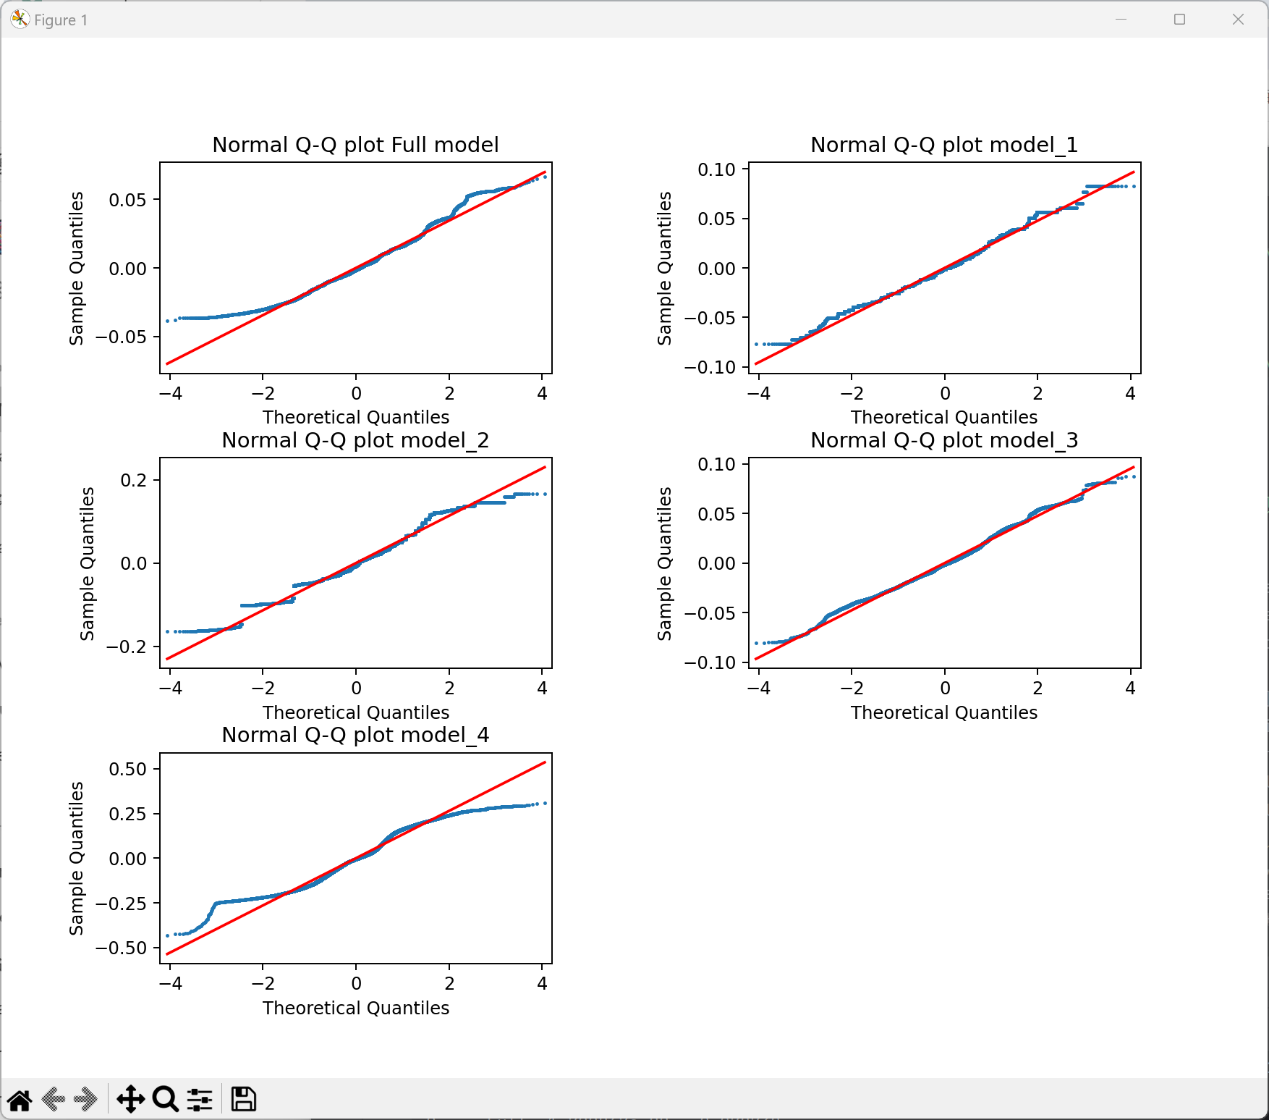
Figure 5. Normal Q-Q plots of residual values for each model.
4.2. Analysis of the SVM model results
Since the performance of the multiple regression model in predicting nonlinear problems is not ideal, this study supplements the prediction of SOH with a support vector machine model. The SVR in this study uses cycle count as the feature value input and SOH as the model output for model training. Fig. 6 is the result graph of the training:
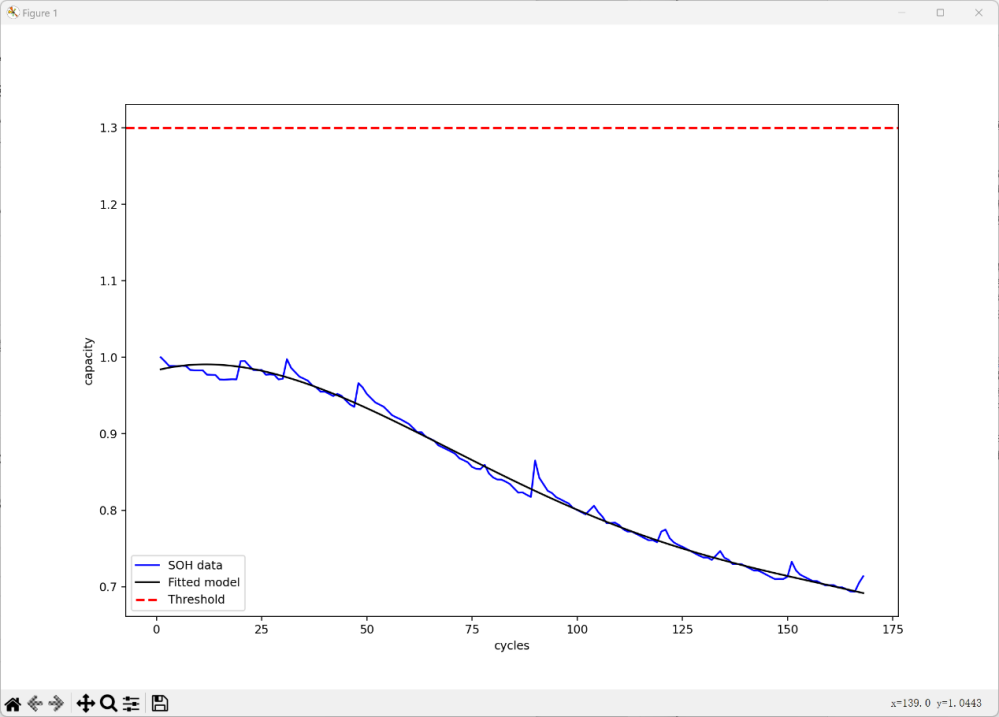
Figure 6. Support Vector Machine Fitting Function Results.
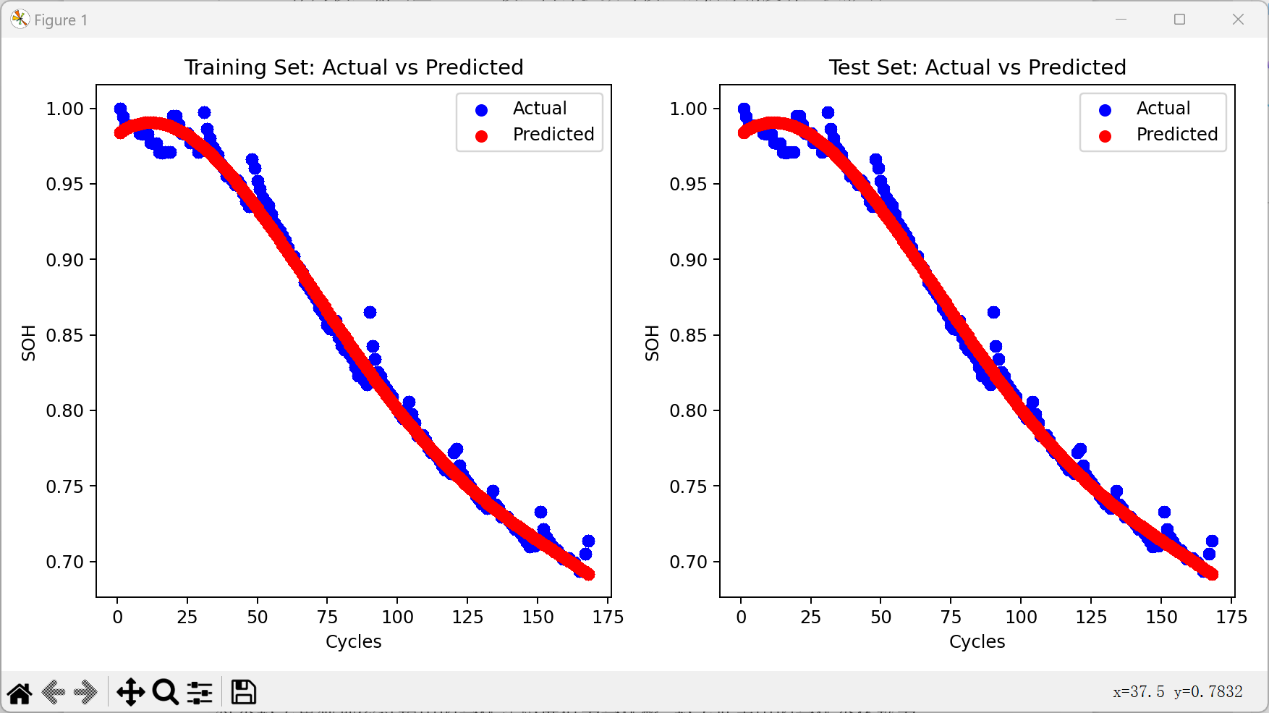
Figure 7. Comparison between predicted results and test data.
From the results depicted in Fig. 7, it is evident that the algorithm model based on the support vector machine can accurately estimate SOH and achieve satisfactory results on the test data. Based on the experimental outcomes, it can be concluded that the feature value based on the cycle count has a robust mapping relationship with SOH, and the extracted feature values can accurately estimate SOH.
5. Conclusion
With the clarity of environmental protection policies in various countries and the advancement of science and technology, electric vehicles are catching up with fuel vehicles with the support of policies, technology, and research and development investment. The future trend of electric vehicles surpassing fuel vehicles to occupy the mainstream market position is inevitable. To ensure the safe driving of electric vehicles and the efficient use of energy, it is necessary to manage and control lithium batteries well through the BMS. Accurate estimation of SOH is of great significance for the efficient use, maintenance, and economic analysis of lithium batteries. Therefore, this paper takes SOH estimation as the research goal and establishes a method for predicting the SOH curve using multiple linear regression and support vector machine, extracting key features that reflect the SOH. The following is a summary of the main work of this paper:
(1) The current common definitions of SOH are summarized.
(2) The correlation between this parameter and SOH in the dataset is analyzed, and more suitable parameters are found as feature values for prediction.
(3) By using multiple linear regression models, it is proven that when date_time, current_load, and cycle are used as feature values, the prediction model will have more accurate effects, while the prediction effects of voltage_load, current_load, and temperature_measured as feature values, which are traditionally considered, are not reliable. At the same time, the multiple linear regression model has certain limitations in predicting nonlinear models such as SOH.
(4) By using support vector machine models, it is proven that using cycle as a feature value can better predict the SOH curve.
This paper has conducted related research on the prediction of battery SOH, but there are still the following issues that need to be studied:
(1) In practical applications, the battery pack system is more complex and variable, and the life situations of individual battery cells also vary. Therefore, future work can focus on the state estimation of batteries in battery packs, making the research work more meaningful for engineering practice.
(2) SOH estimation is just one indicator of the state estimation function of the battery management system, which also includes the estimation of the state of charge, power state, and energy state. Various states of the battery are interrelated and affect each other's estimation accuracy. This paper only studies SOH and does not consider the joint estimation of other states and their health status. Therefore, future research can concentrate on the joint estimation of SOC and SOH. This joint estimation approach can further enhance the monitoring accuracy of BMS.
References
[1]. Singh, P., Fennie, C. and Reisner, D. (2004). Fuzzy logic modelling of state-of-charge and available capacity of nickel/metal hydride batteries. Journal of power sources, 136(2), 322-333.
[2]. Cheng, K. W. E., Divakar, B. P., Wu, H., et al. (2011). Battery-Management System (BMS) and SOC Development for Electrical Vehicles. IEEE Transactions on Vehicular Technology, 60(1), 76-88.
[3]. Zheng, L., Zhuang, L., et al. (2016). Co-estimation of state-of-charge, capacity and resistance for lithium-ion batteries based on a high-fidelity electrochemical model. Applied Energy, 180, 424-434.
[4]. Jie, Q. B. (2021). Research on Health Status Estimation Methods for Automotive Lithium ion Power Batteries. Harbin: Northeast Forestry University.
[5]. Doyle, M. (1993). Modeling of Galvanostatic Charge and Discharge of the Lithium Polymer Insertion Cell. Journal of The Electrochemical Society, 140(6), 1526-1526.
[6]. Xu, W. H., Wang, S. L., Yu, C. M., et al. (2020). Research on SOC estimation method for lithium batteries based on Thevenin model and UKF. Automation Instrumentation, 41(5), 31-36.
[7]. Olivares, B. E., Munoz, M. A. C., Orchard, M. E., et al. (2012). Particle-filtering-based prognosis framework for energy storage devices with a statistical characterization of state-of-health regeneration phenomena. IEEE Transactions on Instrumentation and Measurement, 62(2), 364–376.
[8]. Xu, A., Chen, J., Peng, H., et al. (2019). Simultaneous interrogation of cancer omics to identify subtypes with significant clinical differences. Frontiers in Genetics, 10, 236.
[9]. Rui, X., Li, L. and Tian, J. (2018). Towards a smarter battery management system: A critical review on battery state of health monitoring methods. Journal of Power Sources, 405, 18-29.
Cite this article
Xia,Z. (2024). Prediction of the health state of lithium-ion power batteries using machine learning. Applied and Computational Engineering,76,115-123.
Data availability
The datasets used and/or analyzed during the current study will be available from the authors upon reasonable request.
Disclaimer/Publisher's Note
The statements, opinions and data contained in all publications are solely those of the individual author(s) and contributor(s) and not of EWA Publishing and/or the editor(s). EWA Publishing and/or the editor(s) disclaim responsibility for any injury to people or property resulting from any ideas, methods, instructions or products referred to in the content.
About volume
Volume title: Proceedings of the 2nd International Conference on Software Engineering and Machine Learning
© 2024 by the author(s). Licensee EWA Publishing, Oxford, UK. This article is an open access article distributed under the terms and
conditions of the Creative Commons Attribution (CC BY) license. Authors who
publish this series agree to the following terms:
1. Authors retain copyright and grant the series right of first publication with the work simultaneously licensed under a Creative Commons
Attribution License that allows others to share the work with an acknowledgment of the work's authorship and initial publication in this
series.
2. Authors are able to enter into separate, additional contractual arrangements for the non-exclusive distribution of the series's published
version of the work (e.g., post it to an institutional repository or publish it in a book), with an acknowledgment of its initial
publication in this series.
3. Authors are permitted and encouraged to post their work online (e.g., in institutional repositories or on their website) prior to and
during the submission process, as it can lead to productive exchanges, as well as earlier and greater citation of published work (See
Open access policy for details).
References
[1]. Singh, P., Fennie, C. and Reisner, D. (2004). Fuzzy logic modelling of state-of-charge and available capacity of nickel/metal hydride batteries. Journal of power sources, 136(2), 322-333.
[2]. Cheng, K. W. E., Divakar, B. P., Wu, H., et al. (2011). Battery-Management System (BMS) and SOC Development for Electrical Vehicles. IEEE Transactions on Vehicular Technology, 60(1), 76-88.
[3]. Zheng, L., Zhuang, L., et al. (2016). Co-estimation of state-of-charge, capacity and resistance for lithium-ion batteries based on a high-fidelity electrochemical model. Applied Energy, 180, 424-434.
[4]. Jie, Q. B. (2021). Research on Health Status Estimation Methods for Automotive Lithium ion Power Batteries. Harbin: Northeast Forestry University.
[5]. Doyle, M. (1993). Modeling of Galvanostatic Charge and Discharge of the Lithium Polymer Insertion Cell. Journal of The Electrochemical Society, 140(6), 1526-1526.
[6]. Xu, W. H., Wang, S. L., Yu, C. M., et al. (2020). Research on SOC estimation method for lithium batteries based on Thevenin model and UKF. Automation Instrumentation, 41(5), 31-36.
[7]. Olivares, B. E., Munoz, M. A. C., Orchard, M. E., et al. (2012). Particle-filtering-based prognosis framework for energy storage devices with a statistical characterization of state-of-health regeneration phenomena. IEEE Transactions on Instrumentation and Measurement, 62(2), 364–376.
[8]. Xu, A., Chen, J., Peng, H., et al. (2019). Simultaneous interrogation of cancer omics to identify subtypes with significant clinical differences. Frontiers in Genetics, 10, 236.
[9]. Rui, X., Li, L. and Tian, J. (2018). Towards a smarter battery management system: A critical review on battery state of health monitoring methods. Journal of Power Sources, 405, 18-29.