


1. Introduction
The global COVID-19 pandemic has had a profound impact, infecting over 600 million people and claiming the lives of 6.5 million individuals. As an acute respiratory infectious disease, it has significantly affected worldwide development and human safety.
Given the urgency of the situation, there's a crucial need to explore automated diagnostic methods. Notably, COVID-19 manifests distinct imaging features. Upon invasion of the lungs by the novel coronavirus, it propagates along alveolar pores, resulting in the formation of ground glass shadows. These shadows exhibit a dispersed pattern, spreading from a central point in multiple directions, owing to reduced obstruction by lobules and interconnectedness in the middle, thus creating a diffuse pattern.
The primary objective of this paper is to validate the diagnosis of patients with COVID-19 pneumonia through the analysis of CT images. Additionally, it delves into the development of a COVID-19-assisted diagnostic analysis method leveraging convolutional neural networks. This involves constructing and pre-processing a CT image dataset of COVID-19 pneumonia and extracting image features using convolutional neural networks.
Utilizing an open-source COVID-19 CT dataset curated by researchers at the University of California, San Diego, Petuum, which includes 275 CT images confirmed positive for COVID-19, this paper aims to facilitate the application of deep learning techniques in CT image analysis for COVID-19 diagnosis.
The paper meticulously outlines the methodology employed, rationale behind the proposed approach, and validates its efficacy across various application scenarios. Subsequently, it draws pertinent conclusions based on the findings.
2. Methodology
In the realm of computer vision, convolutional neural networks (CNNs) have emerged as the predominant approach, with notable examples including recent models like GoogLeNet, VGG-19, and Inception. A significant milestone in CNN history is the introduction of the ResNet model, which enables the training of deeper CNN architectures, leading to enhanced accuracy. Conversely, the DenseNet (Densely connected convolutional networks) model, shares a foundational concept with ResNet but establishes dense connections between all preceding and subsequent layers, hence its moniker. Notably, DenseNet facilitates feature reuse across channels, allowing it to surpass ResNet's performance while utilizing fewer parameters and computational resources.
The primary drawback of deep learning studies is their susceptibility to overfitting, wherein the model may perform well on training data but struggle to generalize to unseen data. This limitation underscores the crucial role of training data quality and diversity in ensuring robust generalization.[1] Despite its simpler architecture compared to other CNN designs with numerous layers and parameters, SqueezeNet can achieve comparable levels of accuracy.[2]
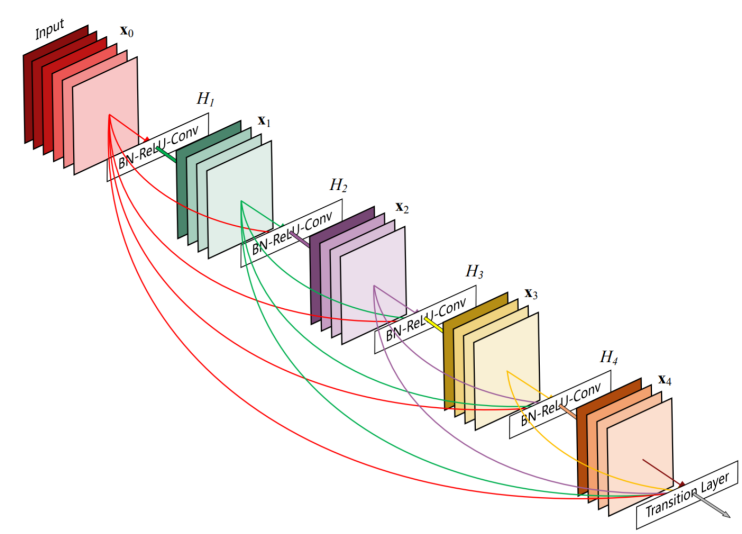
Figure 1. The structure of the network
2.1. Data pre-processing
Having reviewed the success of the reported applications, the existing studies on COVID-19 classification also show some limitations and challenges. [3]This paper employs the ImageDataGenerator class from Keras to conduct preprocessing directly. The ImageDataGenerator, residing in the keras.preprocessing.image module, serves as an image generator capable of augmenting each batch of sample data to expand the dataset and improve the model's generalization ability. Three augmentation techniques utilized in this experiment include horizontal and vertical offset images, horizontal and vertical flipped images, and rotated images.
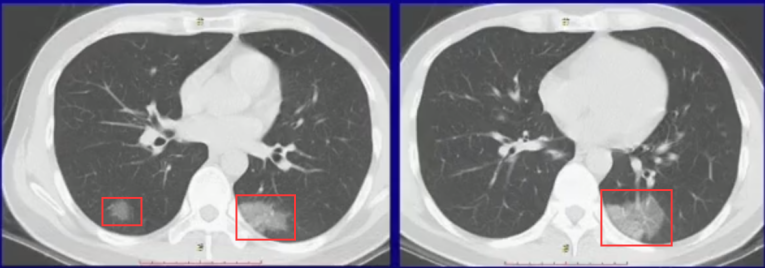
Figure 2. Characteristics of COVID
2.2. Densenet design methods
A DenseNet architecture comprises two key elements: Dense Blocks and Transition Layers. The number of Bottleneck Layers within a Dense Block varies, resulting in different DenseNet configurations. Positioned between two Dense Blocks, the Transition Layer employs 1x1 convolutions to halve the number of channels and reduce the feature map size through maximum pooling.
Dense connections are fundamental to DenseNet, revolutionizing network training by establishing connections between layers, ensuring efficient utilization of feature information, and mitigating the issue of gradient vanishing. Additionally, DenseNet incorporates Bottleneck Layers, Transition Layers, and growth rate parameters, which dictate the number of output channels in each layer of the Dense Block. This integration allows for the regulation of channel counts, leading to notable reductions in computational overhead and parameter count, while effectively addressing the challenge of overfitting. In contrast, traditional neural networks often lack such intricate connections and optimization mechanisms, making them less efficient in handling complex tasks:
\( {X_{l}}={H_{l}}({X_{l-1}}) \)
ResNets:
\( {X_{l}}={H_{l}}({X_{l-1}})+{X_{l-1}} \)
DenseNets:
\( {X_{l}}={H_{l}}([{X_{0}},{X_{1}}…,{X_{l-1}}]) \)
The above H stands for non-liear transformation, which is a combination of BN(Batch Normalization), ReLU, Pooling and Conv operations.
network structure:
• DenseBlock
Each "dot" within the DenseBlock signifies the combination of a Batch Normalization (BN) layer, Rectified Linear Unit (ReLU) activation function, and a convolutional layer with a kernel size of 3x3.
Assuming the input layer's feature layer has k0 channels, each convolution within the DenseBlock produces k feature maps. Consequently, the number of channels in the feature map for the Lth layer input is calculated as k0 + (L - 1)k.
To address the potential issue of large input channel sizes in subsequent layers, DenseBlock offers an extended version known as DenseBlock_B, which incorporates bottleneck layers.
• Transition
The primary function of the Transition layer is to link two adjacent DenseBlocks and reduce the size of the feature map. This layer typically consists of a 1x1 convolution followed by a 2x2 average pooling operation. The Transition layer's main role is to compress the model by reducing the number of features.
The Transition layer can output a reduced number of features denoted by [xm], where x represents the compression factor. When x=1, there is no compression, and the number of features remains unchanged after the Transition layer. However, when x is less than 1, compression occurs, resulting in a reduced number of output features. This configuration is referred to as DenseNet-C, with a commonly used compression factor of x=0.5.
3. Model Compilation
Most of scientific papers are about COVID-19 disease detection rather than severity assessment. [4] In this section, we discuss the impacts and practical considerations of model iterations. Throughout the model training process, we meticulously track accuracy and loss rates. The effectiveness of model training depends on several factors, including image input size, sample size, and iteration frequency. To mitigate overfitting risks, we control the model's iteration epochs and reserve 20% of the training dataset as validation data in advance. This validation set serves as a benchmark for evaluating the model's performance. By monitoring accuracy on the validation dataset, we adjust training epochs to prevent overfitting.
After data preprocessing, the network undergoes training on the dataset. Positive images are assigned a label of 0, while negative images are labeled as 1. In our experiment, we employ the cross-entropy loss function, CrossEntropyLoss, as the primary metric for evaluating the model's performance. This loss function effectively quantifies the disparity between predicted and actual class labels.
Furthermore, we utilize the Adam optimizer, which is renowned for its efficiency and effectiveness in optimizing deep learning models. The Adam optimizer is configured with a learning rate (lr) of 0.003 and betas of (0.9, 0.999). These parameters govern the rate at which the model's parameters are updated during training.
During the training process, the learning rate dynamically adjusts to optimize model convergence. We set the initial parameters to factor=0.70, patience=5, verbose=1, and min_lr=1e-4. Specifically, the learning rate adaptation strategy involves reducing the learning rate by 70% (factor=0.70) if no improvement in the validation loss is observed for a consecutive number of epochs specified by the patience parameter. The verbose parameter controls the verbosity of the training process, while min_lr sets the minimum allowable learning rate.
This comprehensive setup ensures effective model training by dynamically adjusting the learning rate to navigate the optimization landscape efficiently and prevent premature convergence. These settings dictate that if the validation set's loss function value does not improve after every 5 epochs, the learning rate is reduced to 70% of its original value, with the minimum learning rate capped at 1e-4. Finally, the trained model is saved in .h5 format for future utilization.
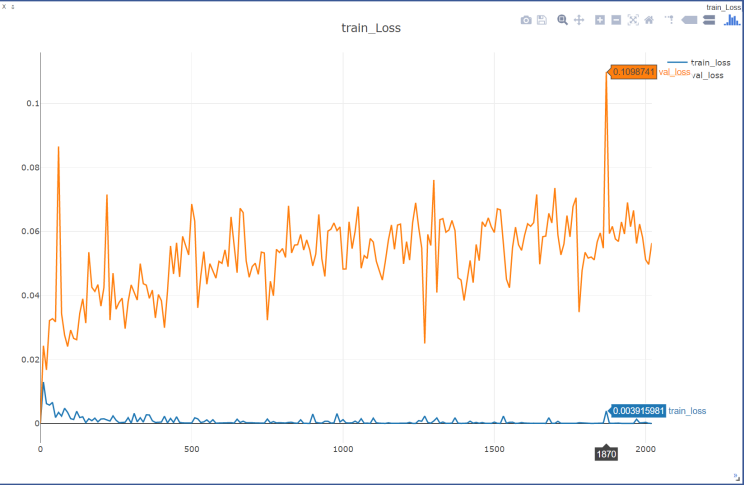
Figure 3. Loss curve of training set and validation set during training
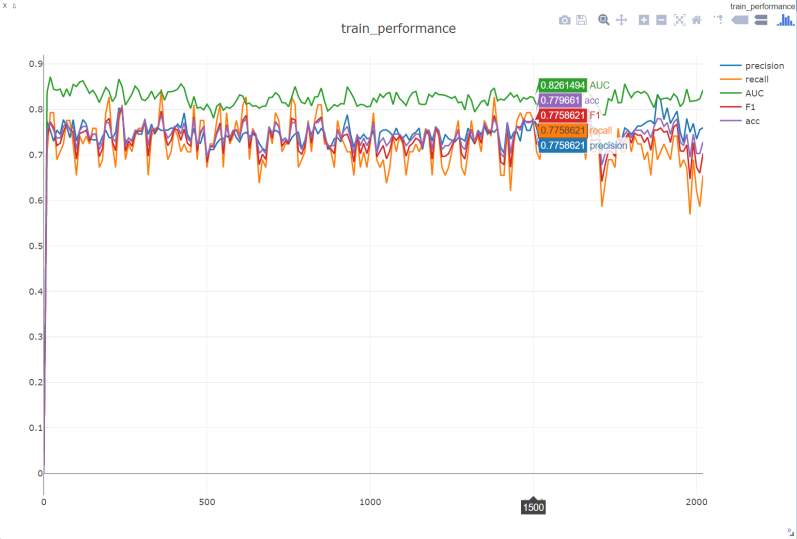
Figure 4. Performance of the model on the validation machine during training
4. Model Evaluation
After the model training is completed, the model needs to be evaluated to ensure recognition in the health domain as much as possible. In this paper, we use the commonly used binary classification evaluation metrics. The experimental results are evaluated by calculating the accuracy, accuracy of the classification results, recall, F1 value, and ROC/AUC. We explain the above concepts with the help of confusion matrix for dichotomous classification.
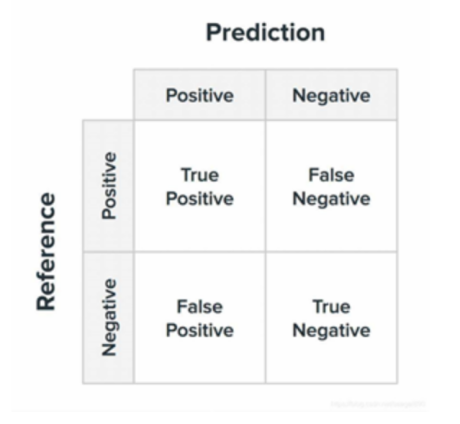
Figure 5. confusion matrix
Accuracy, a fundamental metric in classification tasks, is calculated as the proportion of correctly predicted samples to the total number of samples, and its expression is shown in Equation. A higher accuracy score typically suggests a superior classification performance. However, it's essential to recognize that accuracy may not provide a comprehensive evaluation, especially in scenarios where there is an imbalanced distribution between positive and negative samples. In such cases, relying solely on accuracy to gauge the effectiveness of classification can lead to misleading interpretations.
\( Accuracy=\frac{TP+TN}{TP+FN+FP+TN} \)
Precision is the ratio of the number of correctly predicted positive classes to the number of predicted positive classes.
\( Precision=\frac{TP}{TP+FP} \)
Recall represents the ratio of the number of correctly predicted positive classes to the number of actual positive classes
\( Recall=\frac{TP}{TP+FN} \)
The F1 score, also known as the F1 measure or F1 value, is a harmonic mean of precision and recall rates. The F1 score represents a balance between precision and recall rates, as it takes into account both false positives and false negatives. This makes it a more robust evaluation metric, particularly in scenarios where there is an imbalance in the sample sizes of positive and negative classes.
\( F1=\frac{2*precision*recall}{precision+recall} \)
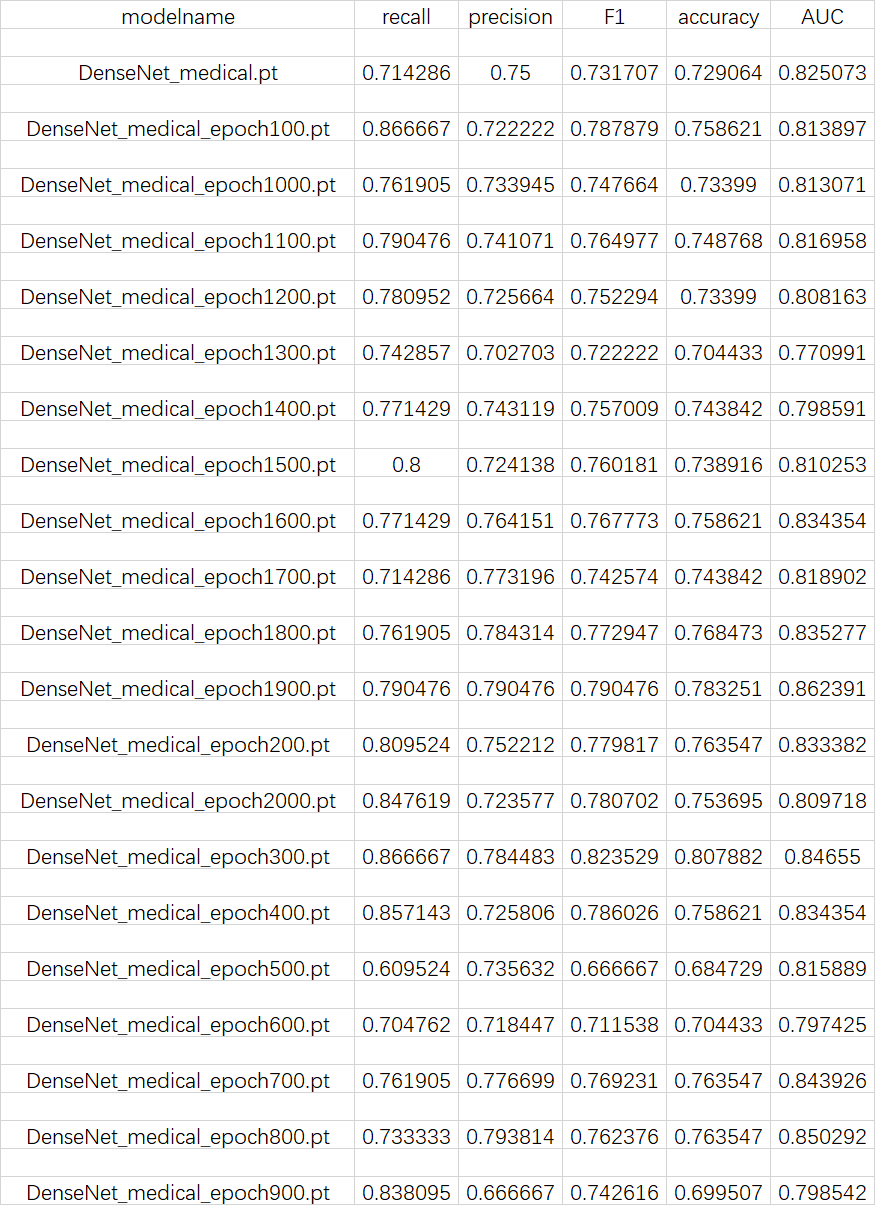
Figure 6. The performance of each model parameter
5. Conclusiion
This work focuses on the classification and recognition algorithm of CT images of neocoronary pneumonia based on DenseNet model, and optimizes the DenseNet network model by training and detecting CT images of neocoronary pneumonia through neural networks, analyzing and comparing the technical principles, classification accuracy and other parameters. The improved DenseNet model achieved 94.57% accuracy in the recognition and classification of CT images of neocrown pneumonia, which was 2.26% more accurate than the cross-entropy loss function. The COVID-19 pandemic has profoundly impacted various aspects of human life worldwide, encompassing social, physical, and mental well-being.[5]
Acknowledgment
Qiang Zirui, Li Jiale expresse sincere thanks to Prof. Teoh Teik Toe, the esteemed director of the AI lab at Nanyang Technological University. Foremost, heartfelt appreciation is extended to Prof. Teoh for his unwavering support, encouragement, and invaluable guidance throughout the journey..
References
[1]. Aslan M F, Unlersen M F, Sabanci K, et al. CNN-based transfer learning–BiLSTM network: A novel approach for COVID-19 infection detection[J]. Applied Soft Computing, 2021, 98: 106912.
[2]. Polsinelli M, Cinque L, Placidi G. A light CNN for detecting COVID-19 from CT scans of the chest[J]. Pattern recognition letters, 2020, 140: 95-100.
[3]. Jia G, Lam H K, Xu Y. Classification of COVID-19 chest X-Ray and CT images using a type of dynamic CNN modification method[J]. Computers in biology and medicine, 2021, 134: 104425.
[4]. Irmak E. COVID‐19 disease severity assessment using CNN model[J]. IET image processing, 2021, 15(8): 1814-1824.
[5]. Rajawat N, Hada B S, Meghawat M, et al. C-COVIDNet: A CNN model for COVID-19 detection using image processing[J]. Arabian Journal for Science and Engineering, 2022, 47(8): 10811-10822.
Cite this article
Qiang,Z.;Bai,Y.;Li,J. (2024). Radiograph recognition of COVID-19 based on DenseNet. Applied and Computational Engineering,76,155-161.
Data availability
The datasets used and/or analyzed during the current study will be available from the authors upon reasonable request.
Disclaimer/Publisher's Note
The statements, opinions and data contained in all publications are solely those of the individual author(s) and contributor(s) and not of EWA Publishing and/or the editor(s). EWA Publishing and/or the editor(s) disclaim responsibility for any injury to people or property resulting from any ideas, methods, instructions or products referred to in the content.
About volume
Volume title: Proceedings of the 2nd International Conference on Software Engineering and Machine Learning
© 2024 by the author(s). Licensee EWA Publishing, Oxford, UK. This article is an open access article distributed under the terms and
conditions of the Creative Commons Attribution (CC BY) license. Authors who
publish this series agree to the following terms:
1. Authors retain copyright and grant the series right of first publication with the work simultaneously licensed under a Creative Commons
Attribution License that allows others to share the work with an acknowledgment of the work's authorship and initial publication in this
series.
2. Authors are able to enter into separate, additional contractual arrangements for the non-exclusive distribution of the series's published
version of the work (e.g., post it to an institutional repository or publish it in a book), with an acknowledgment of its initial
publication in this series.
3. Authors are permitted and encouraged to post their work online (e.g., in institutional repositories or on their website) prior to and
during the submission process, as it can lead to productive exchanges, as well as earlier and greater citation of published work (See
Open access policy for details).
References
[1]. Aslan M F, Unlersen M F, Sabanci K, et al. CNN-based transfer learning–BiLSTM network: A novel approach for COVID-19 infection detection[J]. Applied Soft Computing, 2021, 98: 106912.
[2]. Polsinelli M, Cinque L, Placidi G. A light CNN for detecting COVID-19 from CT scans of the chest[J]. Pattern recognition letters, 2020, 140: 95-100.
[3]. Jia G, Lam H K, Xu Y. Classification of COVID-19 chest X-Ray and CT images using a type of dynamic CNN modification method[J]. Computers in biology and medicine, 2021, 134: 104425.
[4]. Irmak E. COVID‐19 disease severity assessment using CNN model[J]. IET image processing, 2021, 15(8): 1814-1824.
[5]. Rajawat N, Hada B S, Meghawat M, et al. C-COVIDNet: A CNN model for COVID-19 detection using image processing[J]. Arabian Journal for Science and Engineering, 2022, 47(8): 10811-10822.