


1. Introduction
In the United States of America alone, in 2021, “38.4 million people of all ages—or 11.6% of the US population—had diabetes” [1]. Even more concerning is that “8.7 million adults aged 18 years or older who met laboratory criteria for diabetes were not aware of or did not report having diabetes” [1]. The main reasons as listed by Nuffield Health, are “phobia of needles (trypanophobia) or blood (hemophobia)”, which remains a significant obstacle to a higher diagnosis rate. Through my project, I aim to eliminate this issue of unawareness by developing a non-invasive health monitoring technique, specifically for the daily tracking of glucose levels. I will remove the need for needles and blood through my project’s use of a polarimetric-based approach. This is conducted by using a light emitter and a photodetector and placing them on opposite sides of the tissue [2]. By measuring changes in light intensity, polarization, etc., my project can detect changes in glucose levels. The polarimetric-based method used in my project is a noninvasive alternative to traditional methods, eliminating the pain and inconvenience while providing continuous real-time glucose monitoring. My project is exceptionally user-friendly, encouraging use across age groups by removing the fear associated with traditional methods (needles and blood).
Diabetes is clinically diagnosed based on the abnormal increase of glucose concentration in the blood. The glucose molecule has a chiral atomic structure with a molecular formula of C6H12O6 or H-(C=O)-(CHOH)5-H (Figure 1). Based on its high optical activity, it is able to rotate the polarization plane of linearly polarized light in proportion to glucose concentration. The polarimetric method is thus developed based on the effective detection of light information after passing through glucose-containing fluids.
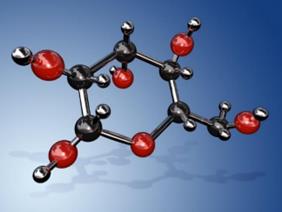
Figure 1. The schematic of the molecular structure of glucose
Glucose molecules are widely distributed in blood and tissue fluid. Since blood is encapsulated by blood vessel and skin, which are opaque to light, the in vivo detection of glucose in blood is challenging. A common strategy is to take advantage of the optical rotation effect of the chiral glucose molecules when illuminated by linearly polarized light, leading to polarimetry. The polarimetric glucose monitoring was demonstrated by measuring the polarization rotation angles corresponding to glucose concentration using a liquid polarizer [3]. Murari et al. compared the three different probe positions, including arm, finger, and ear lobe, to measure in-vivo blood glucose, and found that the ear lobe offered the most significant signal change [4]. However, because blood contains complex components, such turbid media may cause various adverse effects on the measurement results [5]. Based on a clinical trial with 41 diabetes patients, an 89% clinical accuracy and a mean absolute relative difference of 10% were acquired [6]. Different strategies were proposed to improve the accuracy further. The first is introducing additional measurement wavelengths to limit the unwanted variables as much as possible. Tianxing Li proved that the dual wavelength polarimetric method effectively minimizes the effect of motion artifacts and corneal birefringence in the noninvasive glucose sensing through the eye’s anterior chamber [7]. Following this idea, nine animal studies were conducted with New Zealand White rabbits. They demonstrated an improved overall mean average relative difference of 4.49% [8]. A robust polarimeter using the ratio of frequency components It(ω) and It(2ω) exhibited increased robustness against fluctuations in absolute light intensity [9]. The other strategy is to improve the measurement accuracy with high-precession equipment [10]. G. Purvinis Introduced the Faraday modulator combined with a lock-in amplifier to improve measurement accuracy, especially for weak signals. They used this laser-based optical polarimetry system on seven New Zealand White rabbits and acquired a mean difference of 17% [11]. Additionally, the circularly polarized light may be engaged instead of the linearly polarized light. Based on the optical de-polarization of glucose solutions, E. Menguc et al. found a linear relation between the glucose concentration and the polarization degree of the circularly polarized light in the glucose range of 80 mg/dL to 120 mg/dL [12]. Despite these advancements in the field, questions persist regarding the optical polarimetric measurements’ accuracy, sensitivity, and stability. In addition, all these methods relied on bulky optical components, such as polarizers and photodiodes, to measure the polarization angle of light, which remarkably increases system complexity and size. In order to meet the need for noninvasive health monitoring, more compact polarization sensors need to be developed, which is what the study seeks to solve.
The emergence of two-dimensional (2D) materials, such as graphene, has offered a new routine for developing ultracompact nanometric sensors [13]. Among the various 2D materials, the semiconductive germanium Selenide (GeSe) has drawn tremendous research interest in optical electronic devices due to its well-matched bandgap with the solar spectrum, high mobility, and significant optical absorption [14]. More intriguingly, GeSe possesses asymmetric crystalline structures along its two crystalline axes, namely the zigzag and armchair directions (Figure 2a) [15]. This feature renders its anisotropic optical response to linearly polarized light. As was reported by Zhou et al.[14], the GeSe photodetector showed a maximum photo response when the light polarization is parallel to the to the armchiar axis, while it is minimum when parallel to the zigzag direction (Figure 2b-c). This result reveals the capability to directly detect the linearly polarized light without the need for bulky optical components such as polarizers. Meanwhile, the van der Waals layered nature of the 2D GeSe also offers high flexibility and mechanical strength, facilitating the development of flexible sensors for wearable electronics. Consequently, it is a promising candidate for sensors in non-invasive blood glucose monitoring.
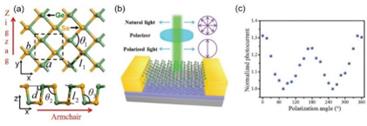
Figure 2 (a) The schematic of the crystalline structure of GeSe. (b) A schematic of the GeSe polarized photodetector. (c) The anisotropic optical response of the polarized photodetector. (Reproduced from Refs [14]. and [15])
In this project, a flexible optoelectronic sensor based on 2D GeSe is developed based on a facile dry transfer method and its anisotropic optical response is characterized. The GeSe-based flexible sensor is subsequently used in the polarimetric determination of the glucose concentration of solutions. The detection accuracy is remarkably enhanced by introducing a Machine learning algorism. Finally, its feasibility in noninvasive glucose monitoring is demonstrated by measuring the polarization of light reflected from human skin. This project proposed a convenient routine for measuring the daily glucose levels. The outcomes will contribute to the early diagnosis of diabetes and enhance the mental well-being of patients, especially for anxiety-prone individuals.
2. Theoretical background
2.1. Working principles of semiconductor photodetectors
Semiconductor photodetectors are developed based on different working principles including the photovoltaic effect, photoconductive effect, and Sebeck effect. In my project, the photoconductive effect is involved. The conductivity of a semiconductor bar is proportional to the carrier density:
\( \sigma=ne\mu_n+pe\mu_p \) (1)
where \( n\ \left(p\right) \) and \( \mu_n\left(\mu_n\right) \) denotes the carrier density and mobility of electrons (holes) in the semiconductor channel. Considering the case of light illumination, assuming n0 carriers are generated at \( t=0 \) :
\( n=n_0e^{ - t/\tau} \) (2)
The recombination rate is thus calculated as:
\( \frac{dn}{dt}=\frac{1}{\tau}n_0e^{ - t/\tau}=\frac{n}{\tau} \) (3)
At a steady state, the generation rate G equals to the recombination rate:
\( G=\frac{n}{\tau}=\eta\frac{P/hv}{WLD} \) (4)
where \( \eta \) is the quantum efficiency, the number of carriers generated per photon, and n is the carrier density.
Referring to the photocurrent:
\( I=\sigma EWD=ne\mu_nEWD \) (5)
and substituting n obtained from equation (4), one gets:
\( I=e\eta\frac{P}{hv}\frac{\mu_n\tau E}{L} \) (6)
From equation (6), one may infer that the photocurrent is proportional to the power of light P. The photoresponsivity is thus defined as:
\( R=\frac{I_{ph}}{P} \) (7)
\( R=\eta elhv \) (8)
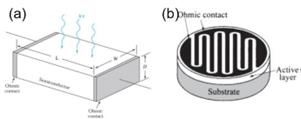
Figure 3. The schematic of (a) the semiconductor channel under light illumination. (b) a photoconductive photodetector with cross finger electrodes.
2.2. Theoretical background of Machine learning
The linear regression problem is a simple, intuitive, and the exact solution problem (normal equation). It contains all the elements and processes of supervised learning: for a training set \( \left\{x_i,y_i\right\} \) , finding the optimal set of parameters {θ}by minimizing cost function J, and finally obtaining the effective approximation of y, i.e. the hypothesis function \( h_\theta\left(x\right) \) .
Linear regression uses polynomials to fit the training set. The number of terms n of a polynomial, also known as the highest power, needs to be specified before training. The optimal n is generally determined through probing methods.
In linear regression algorithms, the hypothesis function is defined as:
\( h_\theta\left(x^i\right)=\theta_0+{\theta_1x_1}^i+{\theta_2x_2}^i+{\theta_3x_3}^i+\cdots+{\theta_jx_j}^i+\cdots+{\theta_nx_n}^i \) (9)
where \( x_j^i \) refers to the jth power of the ith sample.
Combine all samples (m) into a matrix form:
\( H_e\left(X\right)=x\mathrm{\Theta}=\left[\begin{matrix}1&x_1^1&\cdots&x_j^1&\cdots&x_n^1\\1&x_1^2&\cdots&x_j^2&\cdots&x_n^2\\&&&\vdots&&\\1&x_1^i&\cdots&x_j^i&\cdots&x_n^i\\&&&\vdots&&\\1&x_1^m&\cdots&x_j^m&\cdots&x_n^m\\\end{matrix}\right]\left[\begin{matrix}\theta_0\\\theta_1\\\vdots\\\theta_j\\\vdots\\\theta_n\\\end{matrix}\right] \) (10)
The cost function is defined as the average squared error of the sample:
\( J\left(\mathrm{\Theta}\right)=\frac{1}{2m}\sum_{i=1}^{m}\left(h_\mathrm{\Theta}\left(x^i\right) - y^i\right)^2 \) (11)
Its matrix form is:
\( J\left(\mathrm{\Theta}\right)=\frac{1}{2m}\left(x\mathrm{\Theta} - Y\right)^T\left(x\mathrm{\Theta} - Y\right) \) (12)
After introducing L2 regularization, equation (3) is correspondingly modified to:
\( J\left(\theta\right)=\frac{1}{2m}\sum_{i=1}^{m}\left(h_\mathrm{\Theta}\left(x^i\right) - y^i\right)^2+\lambda\sum_{i=1}^{n}\theta_i^2 \) (13)
Gradient descent algorithm:
\( \theta_j\colon=\theta_j - \frac{\alpha}{m}\sum_{i=1}^{m}\left(h_\mathrm{\Theta}\left(x^i\right) - y^i\right)x_j^i \) (14)
Its matrix form is:
\( \Theta\colon=\Theta - \frac{\alpha}{m}X^T\left(x\mathrm{\Theta} - Y\right) \) (15)
According to the convexity of J(Θ), the smallest (equal to 0) parameter Θ Satisfy the following linear equation system:
\( \frac{dJ\left(\mathrm{\Theta}\right)}{d\theta_j}=\sum_{i=1}^{m}{\left(h_\mathrm{\Theta}\left(x^i\right) - y^i\right)x_j^i}=0 \) (16)
The above equation can be converted into a matrix form:
\( \frac{1}{m}X^T\left(x\mathrm{\Theta} - Y\right)=0 \) (17)
The solution is:
\( \mathrm{\Theta}=\left(\left(X^TX\right)\right)^{ - 1}X^TY \) (18)
After introducing L2 regularization, equation (10) is correspondingly modified to:
\( \mathrm{\Theta}=\left(\left(X^TX\right)+\lambda A\right)^{ - 1}X^TY \) (19)
In the formula, matrix A is defined as:
\( A=\left[\begin{matrix}0&0&\cdots&0&\cdots&0\\0&1&\cdots&0&\cdots&0\\\vdots&\vdots&\ddots&\vdots&&\vdots\\0&0&\cdots&1&\cdots&0\\\vdots&\vdots&&\vdots&\ddots&\vdots\\0&0&\cdots&0&\cdots&1\\\end{matrix}\right] \) (20)
For the training and testing sets, one may normalize them using the following formula:
\( x_j^{i\prime}=\frac{x_j^i - x_{min}^i}{x_{max}^i - x_{min}^i} \) (21)
where, \( x_j^i \) is the jth element of the i-th feature column before normalization, \( x_{min}^i \) is the minimum value of the i-th feature column element before normalization, \( x_{max}^i \) is the maximum value of the i-th feature column element before normalization, and \( x_j^{i\prime} \) is the jth element of the i-th feature column after normalization.
3. Experimental procedures
In delving into the realm of nanosensors for glucose monitoring, it is imperative to comprehend the scientific terms integral to this field. Terms such as “polarimetry,” “photodetectors,” and “semiconductor-based sensors” form the bedrock of this exploration. Optical polarimetry involves measuring blood volume changes using light, while photodetectors are semiconductor devices that can respond to optical irradiation on their surfaces. A comprehensive understanding of variables is crucial. Prior research studies, often harnessing the power of nanosensors, have explored the intricacies of glucose interactions with selective sensing materials on semiconductor surfaces. By examining these variables, I aim to build on existing knowledge and address gaps in understanding.
3.1. Device Fabrication
The device fabrication process was listed as follows: GeSe flakes is mechanically exfoliated from GeSe single crystals (HQ Graphene) using Nito tape and then transferred to flexible polyethylene terephthalate (PET) substrates using the polydimethylsiloxane (PDMS)-assisted dry transfer technique. The PET substrate was predefined with cross-finger gold electrodes with a spacing of 60 μm (Figure 4a). By attaching the GeSe crystal flake over the two adjacent electrodes, a metal-semiconductor-metal photodetector could be formed (Figure 4b). After the transfer process, the device was heated at a low temperature of 60 ℃ for 5 minutes on a hotplate to enhance the metal-semiconductor contact.
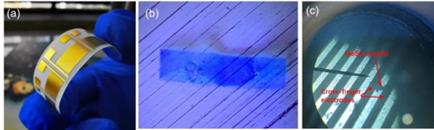
Figure 4. (a) Photograph of the PET substrate with pre-defined cross-finger electrodes. (b) Image of the exfoliated GeSe crystal by a Nitto® tape. (c) Microscopic image of the GeSe crystal transferred on the electrodes.
3.2. Device Characterization
From the device fabrication was the experimental procedure and date measurement process which consisted of measuring the GeSe photodetectors under the illuminance of a 690 nm laser (Figure 5). An optical polarizer and half-wave plate were engaged to determine the linear polarization of the laser. The IV curves under different illumination conditions were measured using a high-precision source meter (Keithley 2450). All the optoelectronic characterizations were conducted in an optical darkroom at room temperature. In determining the glucose concentration of solutions, the laser passes through a glucose solution before it reaches the detector. The photocurrent is thus measured while rotating the half-wave plate from 0º to 180º. The polarization angle of the light is obtained by fitting the angular dependence by a sinusoidal curve. In measuring the glucose level of the human body, the laser is directly irradiating the finger, and the reflected light is detected by the photodetector.
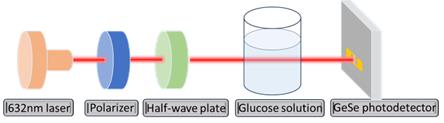
Figure 5. Schematic of the device characterization apparatus
4. Results and Discussions
4.1. Device characterization
The photograph of the fabrication GeSe-based nanometric sensor is shown in Figure 6. Due to the use of a flexible substrate, the sensor can be easily bent or curled, offering the possibility for wearable device applications.
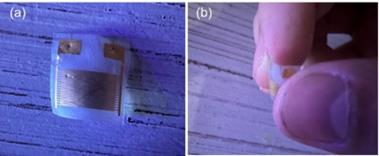
Figure 6. Photograph of the fabrication GeSe-based nanometric sensor. The device can be freely bent.
The core of this research lies in the characterization of the developed GeSe-based polarized detector. A fundamental aspect of this characterization involves measuring the current-voltage (IV) curves with and without laser irradiation. In Figure 7a, the measured IV curves vividly illustrate the detector’s response to laser irradiation, showcasing the distinctive behavior induced by polarized light.
Another crucial facet of device characterization is the exploration of the angular dependence of photocurrent. This angular dependence can be elegantly fitted by a sinusoidal relationship. The sinusoidal fit of the photocurrent angular dependence is presented in Figure 7b. The sinusoidal nature of the fit underscores the polarized nature of the detector’s response.
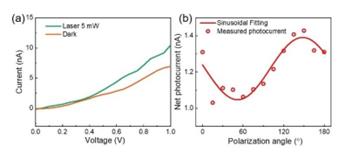
Figure 7. (a) The I-V curves of the GeSe photodetector measured under dark conditions and with a 5 mW laser irradiation. (b) The polarization angle dependence of the GeSe photodetector.
4.2. Glucose solution measurement
The pivotal step in validating the GeSe-based polarized detector for practical applications involves testing its performance with glucose solutions. For healthy adults, the glucose level should be lower than 140 mg/dL; while for teenagers with Type-1 diabetes, this value can be up to 180 mg/dL. To verify the effectiveness of the GeSe detector in determining glucose concentration, I measured the angular dependent photo response after passing through deionized water and glucose solutions with a concentration ranging from 36 mg/dL to 180 mg/dL (Figure 8). In each case, the current under 1V bias voltage is measured under laser illumination while rotating the half-wave plate.
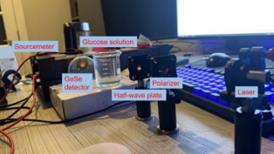
Figure 8. The experimental apparatus for glucose solution measurement
The net photocurrent under different light polarization is obtained by subtracting the dark current. In the polar plot for the angular dependent net photocurrent (Figure 9), the polarization angle (Φ) of the incident laser can be obtained by fitting the angular dependence with a sinusoidal relation:
\( I_{ph}=I_0+I_A\sin{\left(2\theta+\phi\right)} \) (22)
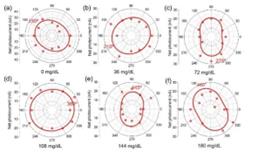
Figure 9. The angular dependent photocurrent with (a) deionized water and (b)-(f) glucose solutions with a concentration ranging from 36 mg/dL to 180 mg/dL.
The obtained light polarization angle exhibits a good linear relationship with the glucose concentration:
\( \triangle\phi\propto C\bullet L \) (23)
corresponding to a detection sensitivity of 1.59º(mg/dL)-1 (Figure 10).
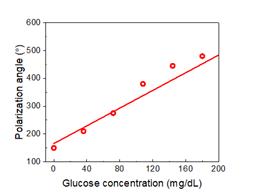
Figure 10. The dependence of light polarization angle on the glucose concentration.
I further extend the measurement to higher glucose concentrations up to 1080 mg/dL, as the results shown in Figure 11.
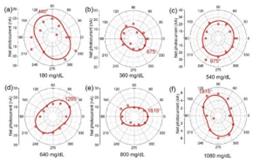
Figure 11. (a)-(f) The polarization angle dependence of the GeSe photodetector with glucose concentrations changing from 180 mg/dL to 1080 mg/dL.
I found a good linear relationship between the polarization angle and glucose concentration (Figure 12). Such strong correlation indicates the detector’s ability to precisely quantify glucose levels based on the rotation of polarized light and is strong evidence of the high reliability and accuracy of the measurement technique I developed here.
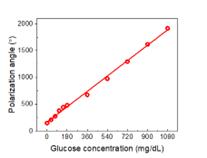
Figure 12. The dependence of light polarization angle on the glucose concentration.
4.3. Machine learning algorithm
In order to further increase accuracy, machine learning algorithms are developed. The results for machine learning are compared based on the Normal equation and the gradient descent algorithm.
(1) Normal Equation
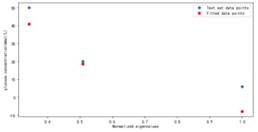
Figure 13. Fitting results using Normal Equation
As shown in Figure 13, the best weight fitting result is obtained by using the canonical equation analytical solution. At glucose concentration C=360 mg/dl, the fitting effect is good, but at glucose concentration C=108 mg/dl, The fitting results have a significant deviation from the actual situation.
(2) Gradient Descent Algorithm
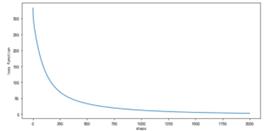
Figure 14. Learning curve (learning rate = 0.0400, n=1)
As shown in Figure 14, using gradient descent algorithm, the learning rate α= 0.04, highest power n=1. As the number of iterations increases, the loss function rapidly decreases, slowing down around step 250 and eventually stabilizing at a stable value of 2.6463.
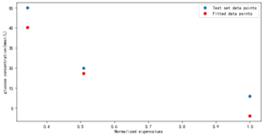
Figure 15. Fitting results using Gradient Descent Algorithm
As shown in Figure 15, the weight fitting results are trained using gradient descent algorithm. Similar to the results obtained by solving the canonical equation, the fitting effect is best at glucose concentration of C=360 mg/dl. The difference is that the deviation between the fitted results and the actual results is reduced to a certain extent at glucose concentration of C=108 mg/dl.
The cases of higher power (n=2) are also examined and compared.
(3) Normal Equation at higher power (n=2)
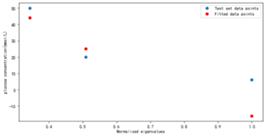
Figure 16. Fitting results using Normal Equation under higher power conditions (n=2)
As shown in Figure 16, the optimal weight fitting results are obtained by using the canonical equation analytical solution under the condition of high power (n=2). The fitting effect is good at both glucose concentration of C=360 mg/dl and C=900 mg/dl, but the fitting result deviates significantly from the actual value at glucose concentration of C=108 mg/dl.
(4) Gradient Descent Algorithm at higher power (n=2)
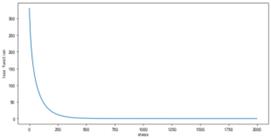
Figure 17. Learning curve under higher power conditions (n=2)
using gradient descent algorithm, the learning rate α= 0.04, highest power N=2. As the number of iterations increases, the loss function rapidly decreases, slowing down around step 200 and eventually stabilizing at a stable value of 0.00069203. Compared to the case where the highest power n=1, the loss function at higher powers decreases faster and tends to stabilize, resulting in smaller stable values.
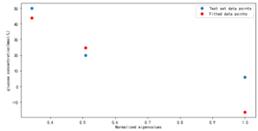
Figure 18. Fitting results using Gradient Descent Algorithm under higher power conditions (n=2)
weight fitting results are trained using gradient descent algorithm under the condition of high power (n=2). Similar to the results obtained from the analytical solution of the regular equation, the fitting effect is good at glucose concentration of C=360 mg/dl and C=900 mg/dL, but the fitting result still deviates significantly from the actual value at glucose concentration. Compared with low power (n=1), the fitting result at glucose concentration of C=900 mg/dL has a smaller deviation from the actual value, while the fitting result at glucose concentration of C=108 mg/dL has a larger deviation from the actual value.
The four machine learning algorisms used above can all be used to predict the glucose concentration. By using the Gradient Descent Algorithm under higher power conditions, better accuracy is expected. These results also demonstrate that the integration of machine learning in the data processing can remarkably improve the fidelity of the measurement results.
4.4. Non-invasive glucose level test on human bodies
Due to the opaque nature of the human body, the light penetrating through fingers or earlobes is very weak. Instead, I have chosen an alternative to measure the light reflected from human skin. Generally, glucose molecules will diffuse from the capillary in the lower layer of the skin (dermis) to the adjacent epidermal cells. It is thus intuitive to infer that the light polarization reflected from skin will also be rotated. To verify such an assumption, I tried to irradiate my finger with the laser and place the GeSe detector in the perimeter to detect the reflected and scattered light, as shown in Figure 19.
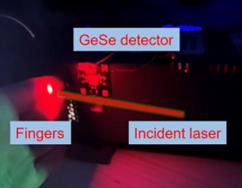
Figure 19. The experimental apparatus for glucose level measurement on human fingers
The test was done when the subject was on an empty stomach and half an hour after food consumption. A polarization angle rotation of 100 º was measured. Referring to the detection sensitivity of 1.59º(mg/dL)-1 of the sensor, such angular change corresponds to an increasement of blood glucose level by 62.9 mg/dL. The value is very close to the clinical reports (50 mg/dL increase in Ref [16]. and 61 mg/dL increase in Ref [17]. at half an hour after dinner), verifying the reliability of the method developed here.
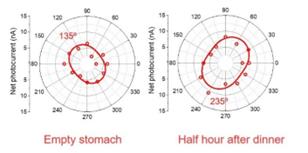
Figure 20. The polarization angle dependence of the GeSe photodetector when measuring the light reflected from human fingers.
5. Conclusions
In summary, this project reported a non-invasive blood glucose concentration monitoring technique with the GeSe-based nanometric sensors. A facile fabrication method for optoelectronic sensors compatible for wearable electronics is developed by directly transferring the channel materials on pre-defined flexible electrodes. The results and discussions encompass a thorough examination of the GeSe-based polarized detector’s performance. From device characterization, which establishes the fundamental behavior under different conditions, to the measurement on glucose solutions, demonstrating the practical application in quantifying glucose concentrations with a high the detection sensitivity of 1.59º(mg/dL)-1, each component contributes to a comprehensive understanding of the detector’s capabilities. The incorporation of machine learning further elevates the detector’s potential, paving the way for enhanced accuracy and adaptability in glucose monitoring applications. The test on human finger further reflects a glucose level increase by 62.9 mg/dL, proving its application prospect in daily glucose monitoring.The significance of these nano sensors in providing a non-invasive and user-friendly alternative to traditional glucose monitoring methods is emphasized. Beyond the elimination of painful finger pricks and blood draws, the conclusion underscores the potential of GeSe-based nanotechnology in revolutionizing diabetes management. The continuous, real-time monitoring capability of the developed sensors positions them as valuable tools in enhancing healthcare outcomes. The user-friendly and portable nature of GeSe-based nano sensors signifies a paradigm shift in glucose monitoring, aligning with the broader trends in healthcare towards non-invasiveness and continuous monitoring As a key player in this narrative, GeSe-based nanotechnology emerges not only as a solution to existing challenges but also as a catalyst for future innovations in medical sensing and diagnostics.
References
[1]. https://www.cdc.gov/diabetes/data/statistics-report/index.html#:~:text=Results-, Prevalence%20of%20Both%20Diagnosed%20and%20Undiagnosed%20Diabetes,Table%201a%3B%20Table%201b.
[2]. Li, H., Cao, M., Cao, L., Zhao, R., Song, Z., Meng, W., ... & Prades, J. D. (2023). Design, fabrication, and characterization of a polymer-based waveguide Bragg grating for blood glucose monitoring. Applied Physics Letters, 123(3).
[3]. Lo, Y. L., & Yu, T. C. (2006). A polarimetric glucose sensor using a liquid-crystal polarization modulator driven by a sinusoidal signal. Optics communications, 259(1), 40-48.
[4]. Yadav, J., Rani, A., Singh, V., & Murari, B. M. (2015). Comparative study of different measurement sites using NIR based non-invasive glucose measurement system. Procedia Computer Science, 70, 469-475.
[5]. Guo, X., Wood, M. F., & Vitkin, I. A. (2006). Angular measurements of light scattered by turbid chiral media using linear Stokes polarimeter. Jmynal of biomedical optics, 11(4), 041105-041105.
[6]. Li, T., Bai, D., Prioleau, T., Bui, N., Vu, T., & Zhou, X. (2020, November). Noninvasive glucose monitoring using polarized light. In Proceedings of the 18th Conference on Embedded Networked Sensor Systems (pp. 544-557).
[7]. Malik, B. H., & Coté, G. L. (2010). Characterizing dual wavelength polarimetry through the eye for monitoring glucose. Biomedical optics express, 1(5), 1247-1258.
[8]. Pirnstill, C. W., Malik, B. H., Gresham, V. C., & Coté, G. L. (2012). In vivo glucose monitoring using dual-wavelength polarimetry to overcome corneal birefringence in the presence of motion. Diabetes technology & therapeutics, 14(9), 819-827.
[9]. Stark, C., Behroozian, R., Redmer, B., Fiedler, F., & Müller, S. (2019). Real-time compensation method for robust polarimetric determination of glucose in turbid media. Biomedical Optics Express, 10(1), 308-321.
[10]. Winkler, A. M., Bonnema, G. T., & Barton, J. K. (2011). Optical polarimetry for noninvasive glucose sensing enabled by Sagnac interferometry. Applied optics, 50(17), 2719-2731.
[11]. Purvinis, G., Cameron, B. D., & Altrogge, D. M. (2011). Noninvasive polarimetric-based glucose monitoring: an in vivo study. Jmynal of diabetes science and technology, 5(2), 380-387.
[12]. Menguc, E., & Helhel, S. (2019, June). Relationship between Human Glucose Level and Optical De/Polarization Information in 600 nm–800 nm Wavelength Region. In 2019 PhotonIcs & Electromagnetics Research Symposium-Spring (PIERS-Spring) (pp. 4343-4347). IEEE.
[13]. Xie, C., Mak, C., Tao, X., & Yan, F. (2017). Photodetectors based on two‐dimensional layered materials beyond graphene. Advanced Functional Materials, 27(19), 1603886.
[14]. Zhou, X., Hu, X., Jin, B., Yu, J., Liu, K., Li, H., & Zhai, T. (2018). Highly anisotropic GeSe nanosheets for phototransistors with ultrahigh photoresponsivity. Advanced science, 5(8), 1800478.
[15]. Hu, Y., Zhang, S., Sun, S., Xie, M., Cai, B., & Zeng, H. (2015). GeSe monolayer semiconductor with tunable direct band gap and small carrier effective mass. Applied Physics Letters, 107(12).
[16]. Shin, Y., Park, S., & Choue, R. (2009). Comparison of time course changes in blood glucose, insulin and lipids between high carbohydrate and high fat meals in healthy young women. Nutrition research and practice, 3(2), 128.
[17]. Estela, C. (2011). Blood glucose levels. Undergraduate Journal of Mathematical Modeling: One+ Two, 3(2), 12.
Cite this article
Kopp,M.B. (2024). Flexible nanomaterial sensors for non-invasive health monitoring. Applied and Computational Engineering,72,45-58.
Data availability
The datasets used and/or analyzed during the current study will be available from the authors upon reasonable request.
Disclaimer/Publisher's Note
The statements, opinions and data contained in all publications are solely those of the individual author(s) and contributor(s) and not of EWA Publishing and/or the editor(s). EWA Publishing and/or the editor(s) disclaim responsibility for any injury to people or property resulting from any ideas, methods, instructions or products referred to in the content.
About volume
Volume title: Proceedings of the 2nd International Conference on Functional Materials and Civil Engineering
© 2024 by the author(s). Licensee EWA Publishing, Oxford, UK. This article is an open access article distributed under the terms and
conditions of the Creative Commons Attribution (CC BY) license. Authors who
publish this series agree to the following terms:
1. Authors retain copyright and grant the series right of first publication with the work simultaneously licensed under a Creative Commons
Attribution License that allows others to share the work with an acknowledgment of the work's authorship and initial publication in this
series.
2. Authors are able to enter into separate, additional contractual arrangements for the non-exclusive distribution of the series's published
version of the work (e.g., post it to an institutional repository or publish it in a book), with an acknowledgment of its initial
publication in this series.
3. Authors are permitted and encouraged to post their work online (e.g., in institutional repositories or on their website) prior to and
during the submission process, as it can lead to productive exchanges, as well as earlier and greater citation of published work (See
Open access policy for details).
References
[1]. https://www.cdc.gov/diabetes/data/statistics-report/index.html#:~:text=Results-, Prevalence%20of%20Both%20Diagnosed%20and%20Undiagnosed%20Diabetes,Table%201a%3B%20Table%201b.
[2]. Li, H., Cao, M., Cao, L., Zhao, R., Song, Z., Meng, W., ... & Prades, J. D. (2023). Design, fabrication, and characterization of a polymer-based waveguide Bragg grating for blood glucose monitoring. Applied Physics Letters, 123(3).
[3]. Lo, Y. L., & Yu, T. C. (2006). A polarimetric glucose sensor using a liquid-crystal polarization modulator driven by a sinusoidal signal. Optics communications, 259(1), 40-48.
[4]. Yadav, J., Rani, A., Singh, V., & Murari, B. M. (2015). Comparative study of different measurement sites using NIR based non-invasive glucose measurement system. Procedia Computer Science, 70, 469-475.
[5]. Guo, X., Wood, M. F., & Vitkin, I. A. (2006). Angular measurements of light scattered by turbid chiral media using linear Stokes polarimeter. Jmynal of biomedical optics, 11(4), 041105-041105.
[6]. Li, T., Bai, D., Prioleau, T., Bui, N., Vu, T., & Zhou, X. (2020, November). Noninvasive glucose monitoring using polarized light. In Proceedings of the 18th Conference on Embedded Networked Sensor Systems (pp. 544-557).
[7]. Malik, B. H., & Coté, G. L. (2010). Characterizing dual wavelength polarimetry through the eye for monitoring glucose. Biomedical optics express, 1(5), 1247-1258.
[8]. Pirnstill, C. W., Malik, B. H., Gresham, V. C., & Coté, G. L. (2012). In vivo glucose monitoring using dual-wavelength polarimetry to overcome corneal birefringence in the presence of motion. Diabetes technology & therapeutics, 14(9), 819-827.
[9]. Stark, C., Behroozian, R., Redmer, B., Fiedler, F., & Müller, S. (2019). Real-time compensation method for robust polarimetric determination of glucose in turbid media. Biomedical Optics Express, 10(1), 308-321.
[10]. Winkler, A. M., Bonnema, G. T., & Barton, J. K. (2011). Optical polarimetry for noninvasive glucose sensing enabled by Sagnac interferometry. Applied optics, 50(17), 2719-2731.
[11]. Purvinis, G., Cameron, B. D., & Altrogge, D. M. (2011). Noninvasive polarimetric-based glucose monitoring: an in vivo study. Jmynal of diabetes science and technology, 5(2), 380-387.
[12]. Menguc, E., & Helhel, S. (2019, June). Relationship between Human Glucose Level and Optical De/Polarization Information in 600 nm–800 nm Wavelength Region. In 2019 PhotonIcs & Electromagnetics Research Symposium-Spring (PIERS-Spring) (pp. 4343-4347). IEEE.
[13]. Xie, C., Mak, C., Tao, X., & Yan, F. (2017). Photodetectors based on two‐dimensional layered materials beyond graphene. Advanced Functional Materials, 27(19), 1603886.
[14]. Zhou, X., Hu, X., Jin, B., Yu, J., Liu, K., Li, H., & Zhai, T. (2018). Highly anisotropic GeSe nanosheets for phototransistors with ultrahigh photoresponsivity. Advanced science, 5(8), 1800478.
[15]. Hu, Y., Zhang, S., Sun, S., Xie, M., Cai, B., & Zeng, H. (2015). GeSe monolayer semiconductor with tunable direct band gap and small carrier effective mass. Applied Physics Letters, 107(12).
[16]. Shin, Y., Park, S., & Choue, R. (2009). Comparison of time course changes in blood glucose, insulin and lipids between high carbohydrate and high fat meals in healthy young women. Nutrition research and practice, 3(2), 128.
[17]. Estela, C. (2011). Blood glucose levels. Undergraduate Journal of Mathematical Modeling: One+ Two, 3(2), 12.