


1. Introduction
The Silk Road was an important channel for cultural exchange between the East and the West in ancient China. Glass, as a significant trade commodity, was introduced to China early on. During its production and dissemination, it showcased China’s unique cultural background and technical features on the basis of absorbing foreign techniques. The primary raw material for glass is quartz sand, whose main chemical component is silicon dioxide (SiO₂). Due to the high melting point of pure quartz sand, fluxes need to be added during the smelting process. The choice of flux significantly influences the composition and properties of the glass. Lead-barium glass, considered a Chinese invention, incorporates lead ore as a flux during the firing process, resulting in high contents of lead oxide (PbO) and barium oxide (BaO). Potassium glass, mainly popular in southern China, Southeast Asia, and India, uses plant ash as a flux during the firing process, leading to a high potassium content [1]. Due to the influence of burial environments, ancient glass artifacts are prone to weathering over extended periods. The weathering process involves complex chemical reactions that may alter the composition ratios of the artifacts, thereby affecting their classification [2-3]. Therefore, studying the weathering processes of ancient glass artifacts is crucial for understanding the spread and development of ancient glass technology, as well as for accurately identifying and evaluating ancient glass relics.
2. Model Assumptions
Assume that all missing data in the appendices are zero, i.e., it is considered that the artifact does not contain this type of chemical component.
Assume that the difference between the chemical composition of unweathered artifacts and unweathered points and their original composition at the time of production is negligible.
3. Data Processing
The competition provides component data related to two types of ancient glass artifacts: high potassium glass and lead-barium glass, including classification information of these artifacts and the proportions of their main components.
3.1. Eliminating Invalid Data
The appendix 2 of the competition provides the proportions of the main components of the artifacts. Due to practical testing methods and other reasons, the sum of component proportions might not equal 100%. Therefore, data with the sum of component proportions between 85% and 105% are considered valid. Statistics show that the sum of component proportions for samples 15 and 17 is less than 85%, deeming them invalid. Hence, data from samples 15 and 17 are excluded.
3.2. Handling Missing Data
The sampling points in table 2 of the competition are random parts of the artifact surfaces and do not represent the entire artifact. Considering that the missing data indicate undetected components, which does not mean the artifact lacks these chemical components, the missing data are replaced with 0.000001.
3.3. Component Data Processing
Due to the limitations of constant sum effects and collinearity among components, statistical analysis cannot directly use the KMO and Bartlett’s sphericity test. Considering the data are in percentage form and to eliminate the limitations of the constant sum effects, the ALR (Additive Log-Ratio) transformation is used to process the raw data. This allows the use of all standard statistical methods that do not depend on distance to analyze the log-ratio transformed data.
\( alr(x)=\left[ln\left(\frac{x_1}{x_D}\right),\ldots,ln\left(\frac{x_i}{x_D}\right),\ldots,ln\left(\frac{x_{D - 1}}{x_D}\right)\right] \) (1)
Table 1. Data Processing Results
| Potassium Oxide (K₂O) | Magnesium Oxide (MgO) | Lead Oxide (PbO) | Silicon Dioxide (SiO₂) | ||
| Raw Data | Skewness | 2.113 | -1.139 | -1.456 | -2.597 |
| Kurtosis | 3.008 | 0.597 | 1.048 | 5.698 | |
| Transformed Data | Skewness | -0.642 | 0.616 | -0.951 | 0.818 |
| Kurtosis | 0.12 | -0.099 | 0.263 | 0.183 |
After performing the log-ratio transformation on the raw data, both skewness and kurtosis significantly decrease, making the data more normally distributed.
4. Correlation Analysis Between Surface Weathering of Artifact Samples and Properties of Glass Artifacts
4.1. Chi-Square Test
The chi-square test is used to analyze the correlation between the surface weathering of glass artifacts and their type, pattern, and color.
Step One: Establish Hypothesis Testing
Set the presence of surface weathering on the artifact as the dependent variable, and the glass type, pattern, and color as the independent variables. Assume that the dependent and independent variables are independent of each other.
Step Two: Calculate Expected Frequencies and Actual Frequencies
The actual frequencies are obtained by statistical analysis of the data provided in Appendix Table 3 of the competition.
Step Three: Substitution and Calculation
Calculate the chi-square value \( x2 \) :
\( x^2=\sum\frac{\left(f_o - f_e\right)^2}{f_e} \) (2)
Where \( f_o \) is the observed frequency, and \( f_e \) is the expected frequency.
Degrees of Freedom \( k \) :
\( k=(R - 1)(C - 1) \) (3)
Where \( R \) is the number of categories of the independent variables, and \( C \) is the number of categories of the dependent variable. Use a Python function to obtain the \( p - value \) .
Step Four: Determine Whether to Accept the Null Hypothesis
Set the significance level \( a=0.05 \) . Consult the chi-square critical value table and compare it with \( x^2 \) to determine the correlation between the variables. Also, compare the significance level \( a \) with the \( p - value \) . If \( p - value\text{<}a \) , it indicates that at the significance level \( a \) , the null hypothesis is rejected[4].
See Appendix 1 for specific procedures. The chi-square test results are shown in Table 2.
Table 2. Chi-Square Test Results
|
Chi-Square Value |
\( p - value \) |
Degrees of Freedom |
Chi-Square Critical Value at \( a=0.05 \) |
Glass Type |
5.4518 |
0.0195 |
1 |
3.841 |
Pattern |
4.9565 |
0.0839 |
2 |
5.991 |
Color |
6.2871 |
0.5066 |
7 |
14.067 |
Analyzing the data in Table 2, we can see that the surface weathering of glass artifacts is correlated with the type of glass. Lead-barium glass is prone to weathering, whereas high-potassium glass is not easily weathered.
At the same time, in the chi-square test results for patterns and colors, the \( p - value \) is higher than the significance level \( a \) , so we accept the null hypothesis, indicating that patterns and colors are not correlated with weathering.
4.2. Stratified Chi-Square Test
Observing the data in Table 2, we find that when using patterns as the independent variable, the chi-square value and \( p - value \) are close to the critical value and significance level \( a \) , suggesting a possible correlation. Using the CMH test for further examination, the results are shown in Table 3.
Table 3. CMH Test Results
|
Chi-Square Value |
\( p - value \) |
Degrees of Freedom |
Chi-Square Critical Value at \( a=0.05 \) |
Pattern |
17.01442 |
0.0002 |
2 |
5.991 |
Based on the data in Table 2, it can be seen that, after stratifying by glass type, patterns are also correlated with whether the surface of glass artifacts is weathered. In high-potassium glass, pattern B is prone to weathering, while patterns A and C are not. In lead-barium glass, the results are not statistically significant.
Due to the small sample size for certain color data in the artifacts, the statistical significance is not valid, and it is not possible to determine the correlation between color and whether the artifact surface is weathered.
5. Classification Model Based on Decision Tree
The CART decision tree algorithm selects features based on the Gini index, aiming for the highest purity in each child node, where all observations in a child node belong to the same category. The CART algorithm is a commonly used method for binary classification, generating a binary tree with high operational efficiency.
According to Form 2, glass artifacts can be divided into two major categories: high-potassium glass and lead-barium glass, with the glass type of each sampling point known. Supervised learning can be used for classification. Due to the small data size and missing data, a CART decision tree model is constructed to classify and select the features for different types of glass[5].
5.1. CART Decision Tree Model
The Gini coefficient represents the purity of the dataset. The smaller the Gini coefficient, the higher the purity of the dataset, and the better the selected splitting attribute.
For binary classification using the CART algorithm, the Gini coefficient for a probability distribution is:
\( Gini\left(p\right)=2p(1 - p) \) (4)
For a sample \( D \) with size \( |D| \) , split into \( \left|D_1\right| \) and \( \left|D_2\right| \) based on attribute \( A_i \) at value \( a \) , the Gini coefficient of attribute \( A_i \) is:
\( Gini_index\left(D,A_i\right)=\frac{\left|D_1\right|}{|D|}Gini\left(D_1\right)+\frac{\left|D_2\right|}{|D|}Gini\left(D_2\right) \) (5)
The attribute with the smallest Gini coefficient after splitting is chosen as the optimal splitting attribute, yielding the optimal decision node.
Considering that the main chemical components of glass may change due to weathering, the model uses the presence of weathering, and the contents of SiO₂, Na₂O, K₂O, CaO, MgO, Al₂O₃, Fe₂O₃, CuO, PbO, BaO, P₂O₅, SrO, SnO₂, and SO₂ as classification features. The glass type is used as the category to construct the decision tree model.
5.2. Classification Results
For the given dataset, 70% of the data is used as the training set and 30% as the test set. The decision tree obtained is shown in Figure 1.
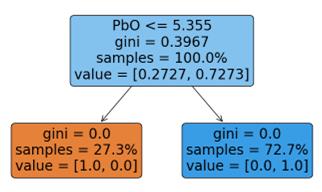
Figure 1. Decision Tree Results
From Figure 1, it can be seen that the classification of glass artifact types is primarily determined by the PbO content. When the PbO content in the glass is less than or equal to 5.355, the glass artifact is considered to be high-potassium glass; otherwise, it is considered to be lead-barium glass.
Using the test set for prediction, the model evaluation results are shown in Table 4.
Table 4. Decision Tree Evaluation Table
|
precision |
recall |
F1-score |
support |
High Potassium |
1.00 |
1.00 |
1.00 |
6 |
Lead-Barium |
1.00 |
1.00 |
1.00 |
14 |
accuracy |
|
|
1.00 |
20 |
macro avg |
1.00 |
1.00 |
1.00 |
20 |
weighted avg |
1.00 |
1.00 |
1.00 |
20 |
From Table 4, it can be seen that the precision, recall, accuracy, and F1-score of the model are all 1, indicating excellent performance.
6. Subdivision of Glass Artifact Subcategories
Perform principal component analysis (PCA) and factor analysis on the processed data.
Firstly, check the suitability of the data through the Kaiser-Meyer-Olkin (KMO) measure and Bartlett’s sphericity test. The KMO value is found to be 0.843, which is greater than 0.6, indicating suitability for factor analysis. The Bartlett test yields a p-value less than 0.05, indicating a certain degree of correlation between the observed variables. The results are shown in Table 5.
Table 5. KMO and Bartlett Test
| Kaiser-Meyer-Olkin (KMO) Measure of Sampling Adequacy | 0.843 | |
| Bartlett’s Test of Sphericity | Approximate Chi-Square | 841.850 |
| Degrees of Freedom | 78 | |
| Significance | .000 | |
Using the \( get_eigenvalues() \) function, calculate the eigenvalues and plot the scree plot, as shown in the following figure.
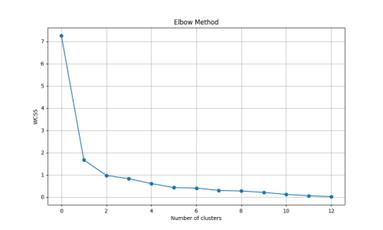
Figure 2. Scree Plot
Table 6. Variance Explained Ratio
| Component | Initial Eigenvalue | ||
| Total | Variance Percentage | Cumulative % | |
| 1 | 7.252 | 55.781 | 55.781 |
| 2 | 1.661 | 12.776 | 68.557 |
| 3 | 0.966 | 7.430 | 75.988 |
| 4 | 0.818 | 6.294 | 82.282 |
| 5 | 0.602 | 4.631 | 86.913 |
| 6 | 0.420 | 3.234 | 90.147 |
| 7 | 0.339 | 2.607 | 92.754 |
| 8 | 0.292 | 2.244 | 94.998 |
| 9 | 0.266 | 2.045 | 97.043 |
| 10 | 0.205 | 1.573 | 98.617 |
| 11 | 0.112 | 0.865 | 99.482 |
| 12 | 0.055 | 0.425 | 99.907 |
| 13 | 0.012 | 0.093 | 100.000 |
Combining the scree plot with the variance explained ratio, as the cumulative variance explained exceeds 80%, we extract 4 principal components. The factor loading matrix is as follows:
Table 7. Rotated Component Matrix
|
Component 1 |
Component 2 |
Component 3 |
Component 4 |
SiO2 |
0.668 |
0.330 |
0.516 |
0.324 |
Na2O |
0.556 |
0.418 |
0.541 |
-0.226 |
K2O |
0.855 |
0.123 |
0.199 |
0.001 |
CaO |
0.361 |
0.275 |
0.489 |
0.403 |
MgO |
0.674 |
0.324 |
0.134 |
0.352 |
Al2O3 |
0.692 |
0.388 |
0.469 |
0.343 |
Fe2O3 |
0.570 |
0.055 |
0.314 |
0.568 |
CuO |
0.175 |
0.173 |
0.875 |
0.229 |
PbO |
0.090 |
0.895 |
0.256 |
0.178 |
BaO |
0.037 |
0.903 |
0.219 |
0.080 |
P2O5 |
0.139 |
0.230 |
0.157 |
0.860 |
SrO |
0.327 |
0.796 |
0.038 |
0.229 |
SnO2 |
0.722 |
0.447 |
0.018 |
0.348 |
Utilizing loadings_ to solve the initial factor loading matrix, employing the method of maximum variance for factor rotation, to ensure that each primary factor corresponds to only a few variables with high loadings, while the rest have small loadings. Additionally, each variable only has high loadings on a few primary factors, with the loadings on the rest of the factors being small. The heat map of the rotated factor loading matrix is shown in Figure 3.
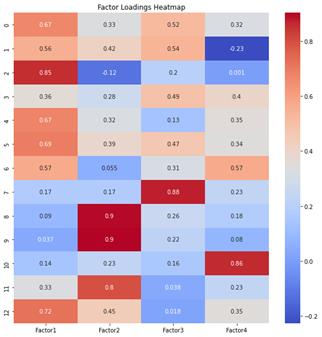
Figure 3. Heat Map of the Rotated Factor Loading Matrix
The consistency between factor scores and factor loadings verifies the rationality of the model.
Based on the analysis results, the factors are named.
Table 8. Naming Results of Factors
Factor |
Naming |
Factor 1 |
Alkaline and Neutral Oxides Content |
Factor 2 |
Lead, Barium, and Strontium Content |
Factor 3 |
Copper Content |
Factor 4 |
Phosphorus Content |
To facilitate the subsequent data analysis, based on the obtained factor loading matrix, data dimensionality reduction is performed. The data is reduced to four dimensions, represented by \( Y1,Y2,Y3,and\ Y4 \) , describing the four types of features characterizing the composition of artifacts.
Table 9. Results of Factor Analysis for Two Types of Artifacts
Artifact ID |
Y1 |
Y2 |
Y3 |
Y4 |
01 |
-3.536232633 |
-24.63664982 |
-0.34243589 |
1.163161747 |
02 |
46.08258826 |
35.15990965 |
35.00831526 |
35.72478231 |
03 (Part 1) |
32.83402342 |
20.59576918 |
30.26523463 |
23.08351563 |
…… |
…… |
…… |
…… |
…… |
58 |
45.13664138 |
45.80571561 |
39.10959104 |
37.36482817 |
Separate the high-potassium glass artifacts from the lead-barium glass artifacts.
Perform K-means clustering based on the four types of features, firstly determine the value of K using the elbow method.
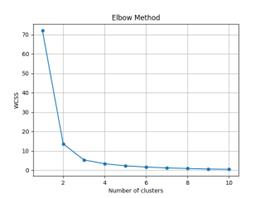

Figure 4. Determination of the Number of Subclasses for High-Potassium Glass (Left) and Lead-Barium Glass (Right) Using the Elbow Method
For high-potassium glass artifacts, from Figure 3, it can be inferred that \( k=3 \) . The clustering results are shown in Table 9.
Table 10. Clustering Results for High-Potassium Glass Artifacts
Artifact Sampling Point |
Clustering Result |
Y1 |
Y2 |
Y3 |
Y4 |
1 |
1 |
-3.5362 |
-24.636 |
-0.3424 |
1.1632 |
03 (Part 1) |
2 |
32.8340 |
20.5958 |
30.2652 |
23.0835 |
03 (Part 2) |
0 |
49.0414 |
41.0055 |
39.9121 |
35.6474 |
4 |
1 |
-2.4091 |
-24.007 |
-0.1797 |
1.4916 |
5 |
1 |
-1.3859 |
-20.083 |
-0.5117 |
2.4396 |
06 (Part 1) |
0 |
45.5860 |
36.5058 |
33.9339 |
32.7461 |
06 (Part 2) |
0 |
49.8903 |
39.6685 |
39.3898 |
37.6643 |
7 |
2 |
26.6422 |
15.1345 |
29.0580 |
25.6831 |
9 |
2 |
33.7596 |
13.5470 |
29.8082 |
25.0537 |
Combining the known data, the third class represents sampling points of weathered high-potassium glass artifacts, while the first and second classes represent sampling points of unweathered glass artifacts. The first class has relatively high values for all four features, while the second class has relatively low values for all four features. The third class has moderate values for all four features.
For lead-barium glass artifacts, from Figure 3, it can be inferred that \( k=3 \) . The clustering results are shown in Table 10.
Table 11. Clustering Results for Lead-Barium Glass Artifacts
Artifact Sampling Point |
Clustering Result |
Y1 |
Y2 |
Y3 |
Y4 |
2 |
2 |
46.0826 |
35.1599 |
35.0083 |
35.7248 |
8 |
1 |
-33.6213 |
-7.9375 |
-9.4081 |
-9.5908 |
08 Severely Weathered Point |
1 |
-44.7750 |
-16.9501 |
-18.2181 |
-15.8559 |
11 |
2 |
39.5830 |
45.8862 |
36.5329 |
32.3368 |
19 |
2 |
38.1014 |
46.2657 |
37.5290 |
37.3715 |
20 |
0 |
34.0811 |
33.6977 |
33.3080 |
28.2910 |
23 Unweathered Point |
0 |
36.7228 |
47.5544 |
37.7153 |
18.8529 |
24 |
0 |
25.7807 |
43.6748 |
32.5765 |
24.9858 |
25 Unweathered Point |
2 |
36.5538 |
46.0632 |
39.4500 |
27.8827 |
Based on the above results, the sub-classification of lead-barium artifacts is obtained. Among them, the first class has relatively low values for all four features, the second class has relatively high values for all four features, and the third class has at least one slightly smaller feature value.
Combining the results of factor analysis and K-means clustering, we can classify potassium glass artifacts into three subclasses: high alkaline oxides, medium alkaline oxides, and low alkaline oxides. Similarly, lead-barium glass artifacts can also be classified into three subclasses: high alkaline oxides, low alkaline oxides, and low-phosphorus compounds.
7. Conclusion
This study, through chi-square tests, found a correlation between the degree of weathering on the surface of glass artifacts and their glass types. The decoration patterns on high-potassium glass showed correlation with weathering, while in lead-barium glass, the two were found to be independent and unrelated. By constructing a CART decision tree model, it was determined that the content of PbO in glass is a primary indicator for distinguishing between high-potassium glass and lead-barium glass. Through validation, it was proven that the classification model used in this study has high classification performance, showing good accuracy and sensitivity, which is significant for the classification and identification of ancient glass artifacts.
To further investigate the classification patterns of glass artifacts, factor analysis and K-means algorithms were used for subclassification. The final results indicate that high-potassium glass artifacts can be divided into three subclasses: high-alkaline oxides, medium-alkaline oxides, and low-alkaline oxides; lead-barium glass artifacts can also be divided into three subclasses: high-alkaline oxides, low-alkaline oxides, and low-phosphorus compounds. The subclassification mentioned above holds significance for the study of glass artifact composition, playing an important role in subsequent artifact identification, preservation, restoration, and other related activities.
References
[1]. Liu, X. L. (2017). Comparative study of glass artifacts unearthed from Hunan, Hubei, and Guangxi during the Warring States and Han dynasties (Unpublished master’s thesis). Hunan University, China.
[2]. Wang, J., Li, M., Ma, Q. L., Zhang, Z. G., Zhang, M. F., & Wang, J. L. (2014). Study on weathering of a hexagonal lead-barium glass artifact from the Warring States period. Glass and Enamel, (2), 8-12.
[3]. Liu, J. (2011). Study on soil quality characteristics and fertility regulation techniques of degraded red soils in the central-southern red soil region of Hunan (Unpublished doctoral dissertation). Hunan Agricultural University, China.
[4]. Yan, W. W., Ren, X. Y., & Shen, Y. D. (2023). Research on surface differentiation of ancient glass artifacts based on K-means clustering algorithm. Chemical Engineering and Equipment, (7), 37-43, 70.
[5]. Xie, J. X. (2023). Analysis of ancient glass composition based on decision tree and K-means clustering. China New Technology and New Products, (6), 66-69.
Cite this article
Zhang,X.;Zhang,Y. (2024). Analysis and identification of ancient glass artifacts based on component data. Applied and Computational Engineering,70,113-122.
Data availability
The datasets used and/or analyzed during the current study will be available from the authors upon reasonable request.
Disclaimer/Publisher's Note
The statements, opinions and data contained in all publications are solely those of the individual author(s) and contributor(s) and not of EWA Publishing and/or the editor(s). EWA Publishing and/or the editor(s) disclaim responsibility for any injury to people or property resulting from any ideas, methods, instructions or products referred to in the content.
About volume
Volume title: Proceedings of the 2nd International Conference on Functional Materials and Civil Engineering
© 2024 by the author(s). Licensee EWA Publishing, Oxford, UK. This article is an open access article distributed under the terms and
conditions of the Creative Commons Attribution (CC BY) license. Authors who
publish this series agree to the following terms:
1. Authors retain copyright and grant the series right of first publication with the work simultaneously licensed under a Creative Commons
Attribution License that allows others to share the work with an acknowledgment of the work's authorship and initial publication in this
series.
2. Authors are able to enter into separate, additional contractual arrangements for the non-exclusive distribution of the series's published
version of the work (e.g., post it to an institutional repository or publish it in a book), with an acknowledgment of its initial
publication in this series.
3. Authors are permitted and encouraged to post their work online (e.g., in institutional repositories or on their website) prior to and
during the submission process, as it can lead to productive exchanges, as well as earlier and greater citation of published work (See
Open access policy for details).
References
[1]. Liu, X. L. (2017). Comparative study of glass artifacts unearthed from Hunan, Hubei, and Guangxi during the Warring States and Han dynasties (Unpublished master’s thesis). Hunan University, China.
[2]. Wang, J., Li, M., Ma, Q. L., Zhang, Z. G., Zhang, M. F., & Wang, J. L. (2014). Study on weathering of a hexagonal lead-barium glass artifact from the Warring States period. Glass and Enamel, (2), 8-12.
[3]. Liu, J. (2011). Study on soil quality characteristics and fertility regulation techniques of degraded red soils in the central-southern red soil region of Hunan (Unpublished doctoral dissertation). Hunan Agricultural University, China.
[4]. Yan, W. W., Ren, X. Y., & Shen, Y. D. (2023). Research on surface differentiation of ancient glass artifacts based on K-means clustering algorithm. Chemical Engineering and Equipment, (7), 37-43, 70.
[5]. Xie, J. X. (2023). Analysis of ancient glass composition based on decision tree and K-means clustering. China New Technology and New Products, (6), 66-69.