


1. Introduction
Stocks represent ownership stakes in corporations issued to raise capital, entitling holders to residual profits and assets after debt obligations are fulfilled, alongside voting rights proportional to their shareholdings. Unlike stocks with fixed maturity dates, stocks do not expire as long as the issuing company remains solvent. Stocks guarantee fixed returns specified in the contract, whereas stock returns are variable and contingent upon corporate profitability and asset value [1]. This distinction underscores the inherent risk associated with stocks, where investors face uncertainty regarding dividends and capital gains contingent upon the company’s financial performance. In contrast to risk-free stocks, which promise predictable returns albeit with default risk, there are no risk-free stocks. Stockholders assume greater risk due to fluctuating dividends and market prices, contingent upon broader economic conditions and company-specific factors.
Through empirical analysis and model validation, this research explores the effectiveness of machine learning techniques in capturing the nonlinear and dynamic nature of financial markets. Insights gained from this study contribute to academic discourse and have practical implications for investors, financial analysts, and policymakers seeking to navigate volatile market conditions and optimize investment strategies. By harnessing AI’s predictive capabilities, this paper aims to advance the understanding and application of machine learning in financial forecasting, paving the way for more accurate and reliable predictions in real-world economic scenarios.
2. Related work
2.1. Traditional Time Series Analysis Method
Traditional statistical methods have long been employed to forecast financial stocks and economic data because of their interpretability and historical reliability. Techniques such as the Autoregressive Integrated Moving Average (ARIMA) [2] model and exponential smoothing methods are notable examples. ARIMA models are adept at capturing linear trends and seasonality in time series data, making them suitable for predicting economic indicators with clear patterns over time.
Exponential smoothing methods, on the other hand, are effective in capturing short-term fluctuations and smoothing out noise in time series data. [3]They excel in scenarios where recent observations are more critical for forecasting than distant historical data points. Despite their strengths, these methods can be limited by their assumption of stationary data and may not adequately handle complex, non-stationary economic data.
Advantages and Limitations:
The strengths of traditional statistical methods lie in their interpretability and well-established theoretical foundations. They provide insights into economic variables’ underlying trends and patterns, aiding decision-making processes. [4]Trendlines help illustrate long-term patterns, while seasonal decomposition charts break down the time series into trend, seasonal, and residual components, aiding in identifying cyclical patterns.
In summary, while traditional statistical methods have been foundational in economic forecasting, their limitations in handling non-linear and dynamic relationships have prompted the exploration of more advanced techniques, including machine learning models. The following sections will delve into how machine learning, particularly multivariate time series models, addresses these challenges and offers new opportunities for improving the accuracy and robustness of economic and financial predictions.
2.2. Application of machine learning to financial forecasting
Time series model: For multidimensional time series data, time series models in machine learning such as ARIMA, LSTM, GRU, etc. can be used for modeling and prediction. These models capture temporal relationships between data to make predictions about future trends.
(1) LSTM (Long Short-Term Memory)
LSTM is a special type of recurrent neural network (RNN) [5]. Unlike traditional neural networks, RNNS have a cyclic structure that allows information to flow continuously through the network. This allows RNNS to retain information over a long period theoretically. In practice, however, standard RNNS have trouble capturing long-term dependencies. LSTM was designed to solve this problem.
LSTM architecture:
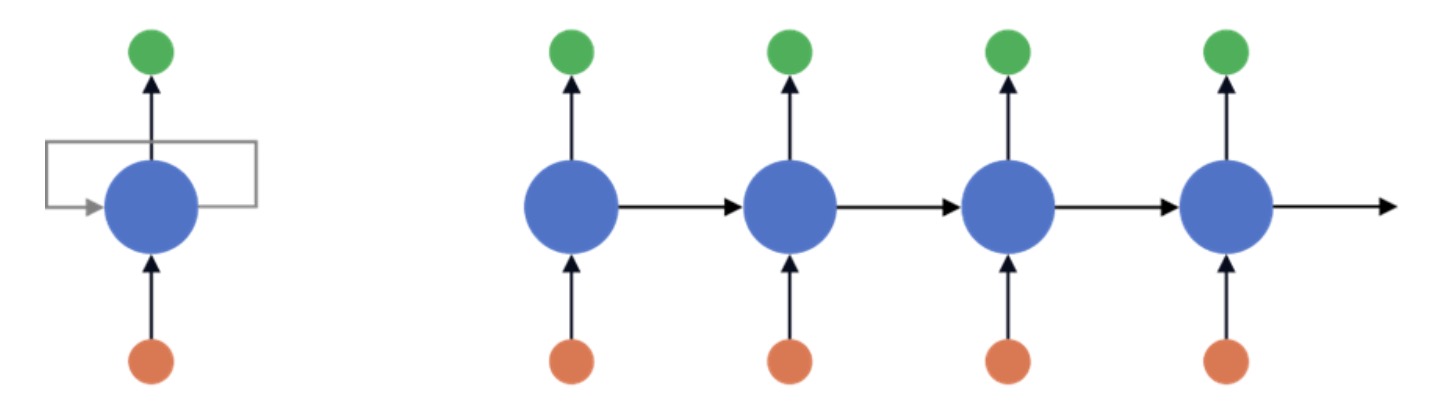
Figure 1. The basic network architecture of RNN
The LSTM architecture consists of a single unit, the memory unit (also known as the LSTM unit). The LSTM unit includes four feedforward neural networks. Each network has input and output layers, with connections from input neurons to all output neurons.
In predicting financial market fluctuations and trends, the effect of LSTM is mainly reflected in its ability to deal with complex non-linear relationships and dynamic market environments [6]. Compared to traditional linear models or simple time series methods, LSTM can better adapt to changing patterns and behaviors in financial markets. Its ability lies in efficiently using historical data and external influences through multi-level feature learning and memory mechanisms to provide more accurate and dynamic prediction results [7]. This capability makes LSTM a powerful tool in financial forecasting, helping investors and analysts better understand market dynamics and make more informed investment decisions.
(2) Neural network(CNN)
The neural network model is a powerful machine learning model that can effectively deal with complex nonlinear relationships and large-scale data. Through multi-level neuronal structures and nonlinear activation functions, neural networks can learn and express complex patterns and higher-order features in data to adapt to various data distributions and complex relationships.
In addition, the training process of neural networks can be time-consuming, especially when dealing with large data sets that require high-performance computing resources. In the financial market prediction, applying a neural network model also needs to consider the market’s complexity and the data’s uncertainty, as well as the generalization ability and stability of the model [8]. In summary, neural network models provide new perspectives and tools for financial market prediction through their powerful nonlinear modeling capabilities, data-driven methods, and more accurate and comprehensive analytical support for investment decision-making and risk management.
2.3. Time series and financial forecasting
With the continuous development of machine learning technology, the application of machine learning in the financial field has also made remarkable progress. These applications improve the prediction accuracy and simplify the application process of traditional models. In this paper, we will list some effective applications of machine learning technology in the financial field from the aspects of factor extraction, missing value filling, fusion input, noise reduction, and non-independent co-distributed adaptation to help readers better understand the current situation of machine learning in the financial field [9]. In addition, tensor-filling methods have been applied in finance to fill in patio-temporal data and show obvious potential. Although some efforts have been made in this area, research is still relatively limited. Advanced deep learning methods can introduce nonlinear and patio-temporal interactions to fill in missing values in financial data.
2.4. Stock forecasting-related tasks
Before delving into the details of deep learning models, we will first define four key stock market prediction tasks and outline the concepts associated with each task [10]. These tasks include stock price forecasting, stock trend forecasting, portfolio management, and trading strategies, and these categories summarise most existing stock market forecasting tasks.
• Stock price forecasting uses time series data to predict the future value of stocks and financial assets traded on exchanges. The goal of this forecast is to achieve a healthy profit. In addition, various factors also affect the forecasting process, including psychological factors and rational and irrational behavior, all of which work together to make stock prices dynamic and volatile.
• Forecasting stock movements typically divides stock trends into three categories: uptrend, downtrend, and sideways; this task is formalized by analyzing the difference between adjusted stock closing prices within a given trading day.
In the stock market prediction task using deep learning, common trading strategies include event-driven, data-driven, and strategy optimization, and the above tasks revolve around the stock market prediction process. The next step is to input extracted features into the deep learning model for training, and finally, the experimental results of the model are analyzed.
3. Methodology
In recent years, applying advanced machine learning techniques to financial time series analysis has garnered significant attention due to their potential to uncover intricate patterns and improve prediction accuracy. Among these techniques, the combination of Convolutional Neural Networks (CNNs) and Long Short-Term Memory networks (LSTMs), known as CNN-LSTM models, has proven particularly effective. This approach leverages CNNs to extract spatial features from input data and LSTMs to capture temporal dependencies. It is well-suited for analyzing multivariate time series data such as stock prices and economics.
3.1. Model discussion
The CNN- BiLSTM LSTM model integrates two robust neural network architectures:
1. Convolutional Neural Networks (CNNs):
- CNNs are adept at learning spatial hierarchies of features through convolutional layers.
- In the context of multivariate time series, CNNs can be applied to extract spatial patterns across different variables (e.g., multiple stock prices, economic indicators) at each time step.
2. Long Short-Term Memory networks (LSTMs):
- LSTMs are well-suited for modeling temporal dependencies by maintaining long-term memory of sequential data.
3. BiLSTM: Based on the cell structure of LSTM, the LSTM historical model has more vital historical information screening ability and chronological order learning ability and can rationally use the input historical data information to form long-term memory of historical data information in the past period, thus avoiding the problem that effective historical information cannot be stored permanently due to the influence of continuous input historical data. Since data processing depends on the direction of network connection, Bi-directional Long Short-Term Memory (BiLSTM) is introduced for events that need to consider the impact of future data on historical data. The model can reference the influence of both historical and future data on the predicted results.
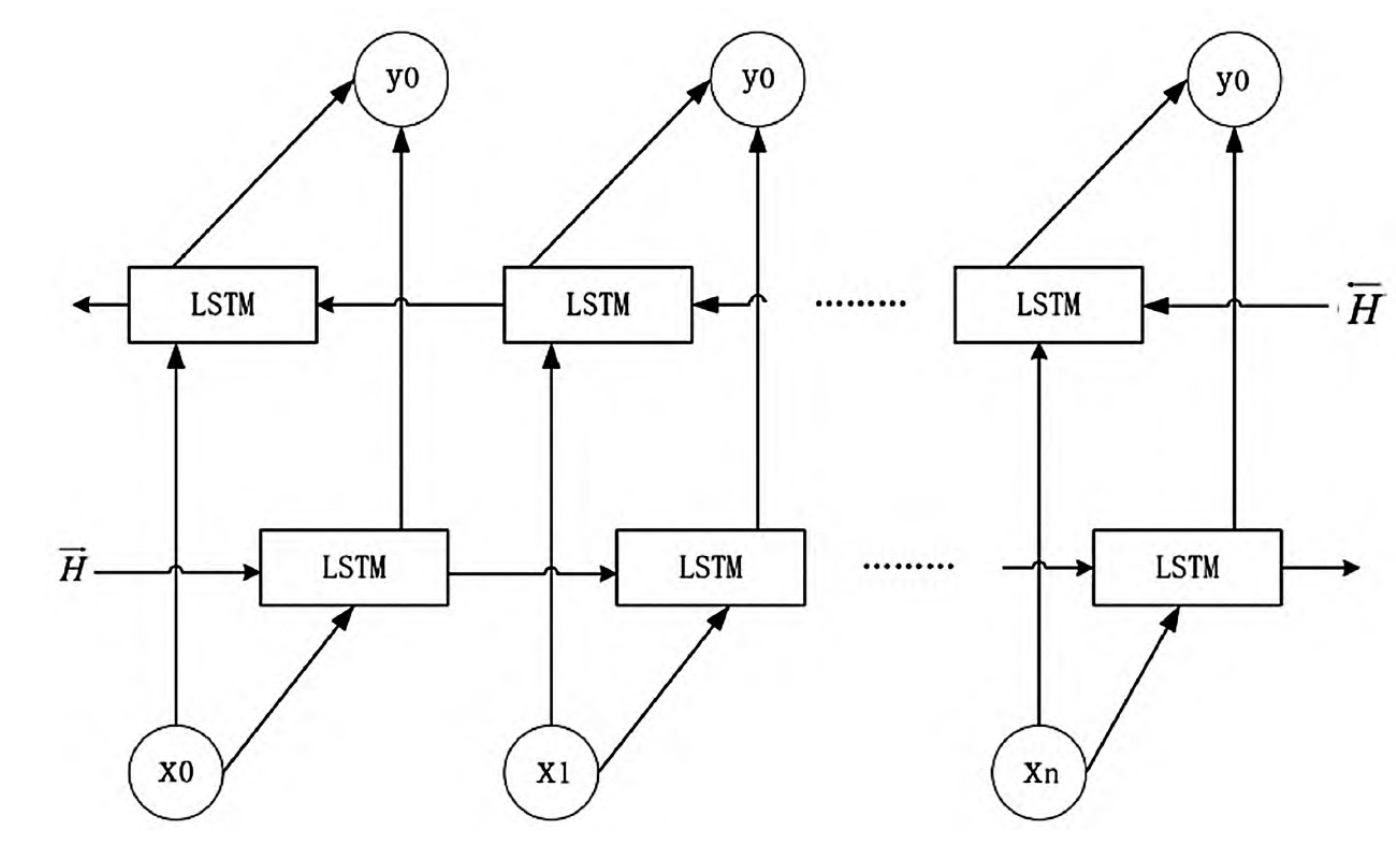
Figure 3. BiLSTM expansion structure based on LSTM
The data is preprocessed first, including the processing of missing and duplicate values, and then normalized. After the processing, the data is divided into a test set and a training set. The attention mechanism is used to increase the weight value of the extracted features and update the weight. Finally, the CNN-BiLSTM-Attention model was constructed, and the test set data was input to verify the model’s accuracy.
3.2. Data processing
In this experiment, the stock data of the People’s Bank of China were studied. The research results were compared with the LSTM model (LSTM-ATTENTION), the convolutional neural network, and the bidirectional long and short memory neural network mixed model (CNN-BiLSTM), and the single long and short memory neural network model (LSTM). It is concluded that the CNN-BiLSTM-Attention model has a good effect.
Due to the significant difference in the results of the stock data, the data needs to be normalized before input into the neural network model using 0-1 normalization. The calculation method is as follows:
\( {x^{x}}=\frac{x-min}{max-min}\ \ \ (1) \)
\( x \) is the original sample data value; min is the minimum value in the sample data.max indicates the maximum value in the sample data.
3.3. Test data and methods
The input of the neural network is the data closely related to the trading of the stock, and the output is the closing price, which predicts the close of the next trading day’s price. This paper downloads experimental data from Tushara’s official website. It selects the data of People’s Bank of America Stock (stock code 000001) from January 1, 2005, to October 4, 2021, of which 80% is used as the training set and 20% is used as the test set.
In this paper, the window size is n, and roll is selected. The window size is 1, and MAE comparisons of different window lengths are selected 5 times. See Table 1.
Table 1. Comparison of results of different sliding window sizes
Sliding Window Size | Mean Absolute Error (MAE) |
5 | 0.01945795 |
7 | 0.01809513 |
10 | 0.01776377 |
15 | 0.02096804 |
Table 1 shows that when the window size is 5, the MAE value is larger than the step size. When the selection is 15, the MAE value is also relatively large, and when the selection step is 10, the average absolute error value is the smallest, so the optimal window size is selected Select 10.
To verify the high accuracy of the model, different algorithms are used for comparison, and the comparison results are shown in Table 2.
Table 2. Comparison of predictions from different models
Model | MSE (Mean Squared Error) | MAPE (Mean Absolute Percentage Error) |
CNN-BiLSTM-Attention | 0.012864103 | 0.0198415 |
LSTM-Attention | 0.03095998 | 0.0242836 |
CNN-BiLSTM | 0.071255782 | 0.059437 |
LSTM | 0.031070495 | 0.0816299 |
As can be seen from Table 2, compared with the LSTM hybrid model, the overall trend is better, while the new hybrid model CNNBiLSTM-Attention model MSE is 0.012864103, MAPE is 0.01984150. It has higher reliability than previous models.
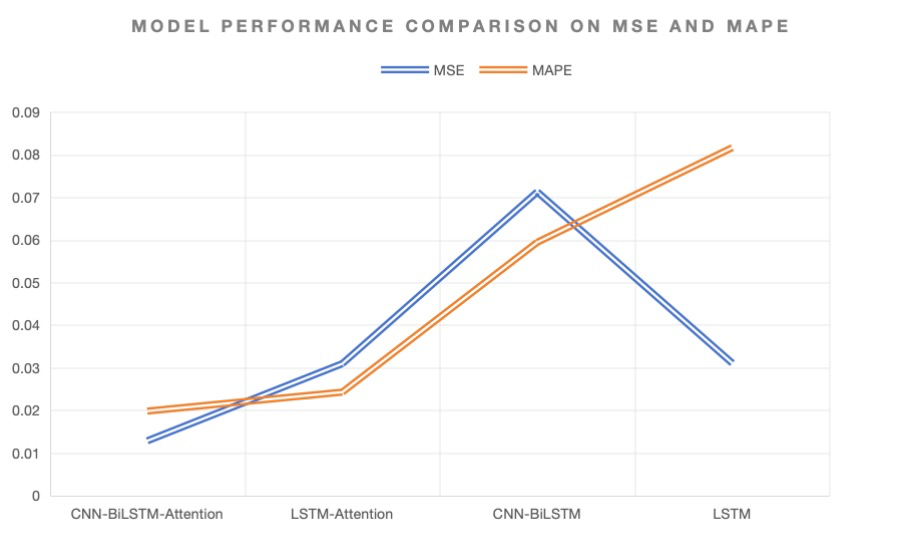
Figure 4. Evaluation of Model Accuracy: MSE vs MAPE
3.4. Experimental design
By comparing the performance of the attention-based convolutional neural network and bidirectional long and short-memory neural network mixed models with traditional statistical methods, we draw the following conclusions:
• Improved prediction accuracy: Experimental results show that the new hybrid model significantly improves the accuracy of predicting changes in stock prices. Compared with traditional statistical methods, the model performs better on several evaluation indicators, such as mean square and absolute percentage errors.
• Effectiveness of feature extraction: Using convolutional neural networks (CNNs) for feature extraction can effectively capture spatial information in the input data, which is particularly important for analyzing multivariate time series. These extracted features help improve the subsequent model’s predictive power (BiLSTM).
• Timing modeling of BiLSTM models: Bidirectional Long and short memory neural networks (BiLSTM) perform well in processing time series data, effectively capturing long and short-term timing dependencies, thereby improving the robustness and accuracy of predictions.
The hybrid CNN-BiLSTM-Attention model demonstrates clear advantages in processing financial time series data and predicting quantitative transactions.
4. Conclusion
Based on the considerations for long-term stability and reliable forecasting in stock markets, it is evident that short-term stock price predictions can inadvertently promote short-sighted investor behavior. This tendency undermines the market’s long-term stability and hampers its sustainable growth. Developing robust long-term forecasting models that incorporate multiple influencing factors is crucial to counteract this. These models should transcend the immediate fluctuations and provide insights contributing to a more stable and predictable market environment.
Furthermore, as China’s capital markets continue to undergo reforms and development, a significant imperative remains to refine market institutions through ongoing exploration. Achieving high-quality development in China’s distinctive modern capital market requires a sustained commitment to these principles, ensuring a balanced approach that supports long-term investor confidence and economic resilience.
References
[1]. Colladon, Andrea Fronzetti, and Giacomo Scettri. “Look inside. Predicting stock prices by analyzing an enterprise intranet social network and using word co-occurrence networks.” International Journal of Entrepreneurship and Small Business36.4 (2019): 378-391.
[2]. Ariyo, Adebiyi A., Adewumi O. Adewumi, and Charles K. Ayo. “Stock price prediction using the ARIMA model.” 2014 UKSim-AMSS 16th international conference on computer modeling and simulation. IEEE, 2014.
[3]. Khare, Kaustubh, et al. “Short-term stock price prediction using deep learning.” 2017 2nd IEEE international conference on recent trends in electronics, information & communication technology (RTEICT). IEEE, 2017.
[4]. Qian, K., Fan, C., Li, Z., Zhou, H., & Ding, W. (2024). Implementation of Artificial Intelligence in Investment Decision-making in the Chinese A-share Market. Journal of Economic Theory and Business Management, 1(2), 36-42.
[5]. Xu, Jiahao, et al. “AI-BASED RISK PREDICTION AND MONITORING IN FINANCIAL FUTURES AND SECURITIES MARKETS.” The 13th International scientific and practical conference “Information and innovative technologies in the development of society”(April 02–05, 2024) Athens, Greece. International Science Group. 2024. 321 p.. 2024.
[6]. Wang, Yong, et al. “Machine Learning-Based Facial Recognition for Financial Fraud Prevention.” Journal of Computer Technology and Applied Mathematics 1.1 (2024): 77-84.
[7]. Song, Jintong, et al. “LSTM-Based Deep Learning Model for Financial Market Stock Price Prediction.” Journal of Economic Theory and Business Management 1.2 (2024): 43-50.
[8]. Shi, C., Liang, P., Wu, Y., Zhan, T., & Jin, Z. (2024). Maximizing user experience with LLMOps-driven personalized recommendation systems. Applied and Computational Engineering, 64, 101-107.
[9]. Tian, J.; Li, H.; Qi, Y.; Wang, X.; Feng, Y. Intelligent medical detection and diagnosis assisted by deep learning. Appl. Comput. Eng. 2024, 64, 116–121, https://doi.org/10.54254/2755-2721/64/20241356.
[10]. Tavenard, R., Faouzi, J., Vandewiele, G., Divo, F., Androz, G., Holtz, C., ... & Woods, E. (2020). To learn, a machine learning toolkit for time series data. Journal of Machine Learning Research, 21(118), 1-6.
Cite this article
Zheng,H.;Wu,J.;Song,R.;Guo,L.;Xu,Z. (2024). Predicting financial enterprise stocks and economic data trends using machine learning time series analysis. Applied and Computational Engineering,87,26-32.
Data availability
The datasets used and/or analyzed during the current study will be available from the authors upon reasonable request.
Disclaimer/Publisher's Note
The statements, opinions and data contained in all publications are solely those of the individual author(s) and contributor(s) and not of EWA Publishing and/or the editor(s). EWA Publishing and/or the editor(s) disclaim responsibility for any injury to people or property resulting from any ideas, methods, instructions or products referred to in the content.
About volume
Volume title: Proceedings of the 6th International Conference on Computing and Data Science
© 2024 by the author(s). Licensee EWA Publishing, Oxford, UK. This article is an open access article distributed under the terms and
conditions of the Creative Commons Attribution (CC BY) license. Authors who
publish this series agree to the following terms:
1. Authors retain copyright and grant the series right of first publication with the work simultaneously licensed under a Creative Commons
Attribution License that allows others to share the work with an acknowledgment of the work's authorship and initial publication in this
series.
2. Authors are able to enter into separate, additional contractual arrangements for the non-exclusive distribution of the series's published
version of the work (e.g., post it to an institutional repository or publish it in a book), with an acknowledgment of its initial
publication in this series.
3. Authors are permitted and encouraged to post their work online (e.g., in institutional repositories or on their website) prior to and
during the submission process, as it can lead to productive exchanges, as well as earlier and greater citation of published work (See
Open access policy for details).
References
[1]. Colladon, Andrea Fronzetti, and Giacomo Scettri. “Look inside. Predicting stock prices by analyzing an enterprise intranet social network and using word co-occurrence networks.” International Journal of Entrepreneurship and Small Business36.4 (2019): 378-391.
[2]. Ariyo, Adebiyi A., Adewumi O. Adewumi, and Charles K. Ayo. “Stock price prediction using the ARIMA model.” 2014 UKSim-AMSS 16th international conference on computer modeling and simulation. IEEE, 2014.
[3]. Khare, Kaustubh, et al. “Short-term stock price prediction using deep learning.” 2017 2nd IEEE international conference on recent trends in electronics, information & communication technology (RTEICT). IEEE, 2017.
[4]. Qian, K., Fan, C., Li, Z., Zhou, H., & Ding, W. (2024). Implementation of Artificial Intelligence in Investment Decision-making in the Chinese A-share Market. Journal of Economic Theory and Business Management, 1(2), 36-42.
[5]. Xu, Jiahao, et al. “AI-BASED RISK PREDICTION AND MONITORING IN FINANCIAL FUTURES AND SECURITIES MARKETS.” The 13th International scientific and practical conference “Information and innovative technologies in the development of society”(April 02–05, 2024) Athens, Greece. International Science Group. 2024. 321 p.. 2024.
[6]. Wang, Yong, et al. “Machine Learning-Based Facial Recognition for Financial Fraud Prevention.” Journal of Computer Technology and Applied Mathematics 1.1 (2024): 77-84.
[7]. Song, Jintong, et al. “LSTM-Based Deep Learning Model for Financial Market Stock Price Prediction.” Journal of Economic Theory and Business Management 1.2 (2024): 43-50.
[8]. Shi, C., Liang, P., Wu, Y., Zhan, T., & Jin, Z. (2024). Maximizing user experience with LLMOps-driven personalized recommendation systems. Applied and Computational Engineering, 64, 101-107.
[9]. Tian, J.; Li, H.; Qi, Y.; Wang, X.; Feng, Y. Intelligent medical detection and diagnosis assisted by deep learning. Appl. Comput. Eng. 2024, 64, 116–121, https://doi.org/10.54254/2755-2721/64/20241356.
[10]. Tavenard, R., Faouzi, J., Vandewiele, G., Divo, F., Androz, G., Holtz, C., ... & Woods, E. (2020). To learn, a machine learning toolkit for time series data. Journal of Machine Learning Research, 21(118), 1-6.