


1. Introduction
1.1. Research background and motivation
Vision is one of the important ways for organisms to perceive the outside world. It obtains information critical to survival by sensing information such as light, color, and movement. It is estimated that more than 80% of external information is obtained through vision, so vision is considered one of the most important ways of perception in the biological world. [1] Visual function compensation refers to the combination of perception methods, including the visual function itself, with other important ways of perceiving the outside world, such as hearing, touch, etc., to achieve the balance of the human perception system. This kind of compensation is not simply to make up for what is missing, but to pursue the perfect interaction between users and products by redistributing the proportions of various methods in the perception system. [2] In daily life, the complexity and variety of interaction patterns can easily lead to difficulties in design, use and understanding, especially in the well-known field of poster design. [2-3] As a visual communication medium, posters play a vital role in conveying information, guiding the audience's attention, and conveying emotions. [4] However, due to differences in the visual cognitive abilities of different users and possible individual defects or obstacles in visual perception, traditional poster design often cannot meet the needs and expectations of all users. [4-5] Therefore, incorporating visual function compensation theory into the poster design process has become an important means to improve poster design quality and user experience.
Visual function compensation means that when visual function is defective or damaged, individuals make up for the defect by improving existing residual visual abilities, learning visual substitution skills, and developing non-traditional visual functions. This includes enhancing the ability to perceive visual stimuli such as light, color, shape, size, etc., learning how to use visual information such as contrast, light, and movement to assist in identifying objects and environments, and developing the ability to acquire visual concepts through non-traditional senses such as hearing and touch. ability. [6,8] Individuals can also adopt adaptive strategies to process visual information, adjust environmental conditions, change working styles, use assistive devices, etc. Receiving vision training and rehabilitation programs is also an important part of helping individuals restore or improve impaired visual function and improve their ability to handle visual tasks in daily life. [8] Through these methods, individuals can better cope with visual function deficits and improve their independence and quality of life in daily life. [7] Even in normal people, compensation of visual function may play a role. This type of compensation is not limited to people with disabilities but may be used by anyone when faced with specific challenges or environmental conditions. [7,8] For example, in special environments, such as low-light environments or complex visual scenes, normal people may learn to use more sensory information to make up for the lack of visual information to improve their perception of the environment and adaptability. [9] In addition, normal people may also make up for the lack of visual function by improving attention and concentration, learning visual skills, and coping with age-related changes to improve the quality of life and the ability to cope with daily challenges. Therefore, compensation of visual function is also of great significance in normal people, helping them to better adapt to various environments and cope with various situations in life. [9-10]
1.2. Introduction to SAPAD-TOPSIS framework and visual function compensation
As a medium, vision generally does not appear alone in design, but is intertwined with other modes of perception to jointly construct users' perceptions of products or information. [11] The SAPAD effectiveness framework is a theoretical framework for interactive cognitive abilities. It is mainly based on the Semiotics Approach of Product Architecture Design (SAPAD) jointly proposed by Professor Hu Fei and Professor Sato. SAPAD effectiveness is Interpretation of the effectiveness of the three directions "behavior-meaning-object" using UCD (UserCentered Design) as a methodology. The interaction and influence between these three directions are analyzed by analyzing the relationship between user behavior, meaning and objects. . The advantage of this framework is that it can provide a deeper understanding of users' interactive behaviors and cognitive processes, thereby guiding the design of more effective new individual user interaction models, thereby maximizing the role of visual function compensation. [12,13,14,15]
In the field of sustainable design, SAPAD theory plays an important role. It can not only analyze and improve the environmental and social impacts of products, but also pay attention to the impact of design effectiveness and symbolic meaning on sustainable innovation. With the evolution and development of SAPAD theory, new research directions and application fields have emerged. The academic community has predicted and defined relevant performance directions, promoting interdisciplinary research, allowing knowledge from different fields to be integrated, and a more comprehensive understanding of the complexity of science popularization design. Hu Fei et al. [16] constructed a SAPAD framework through in-depth research on the overall cabinet design, which provided effective support for the design. Yang Bolin [17] used the SAPAD framework to complete mapping clustering analysis in the process of setting up scenario thinking, verifying the feasibility of the design method. Chen Shanshan et al. [18] improved the SAPAD theoretical framework through the cross-research method of SAPAD-AHP and the analytic hierarchy process to evaluate core meaning clusters. Zhang Zhang et al. [19] and Wang Chao et al. [20] applied the SAPAD framework to conduct innovative research on service system design and train sleeper layout, improving product quality and user experience. Wang Wei et al. [21] realized the creative transformation of local "practical wisdom" by mining local knowledge and applying the SAPAD method. These studies show that the application of SAPAD theory in various fields has broad prospects and important value. However, more in-depth research is still needed on the indicators and standards for the evaluation of visual design works, and how to achieve objective and scientific evaluation under the SAPAD theoretical framework.
SAPAD effectiveness forms a multi-angle mapping and clustering of "behavior-meaning-object" to explore the actual needs of individual users and ultimately form a theoretical framework for product architecture, which involves the screening process of the optimal design solution. [21,22,23] The TOPSIS method (Technique for Order Preference by Similarity to Ideal Solution) is a multi-objective decision-making method. It can screen multiple alternatives in the built SAPAD framework, and then sort and select. [22]
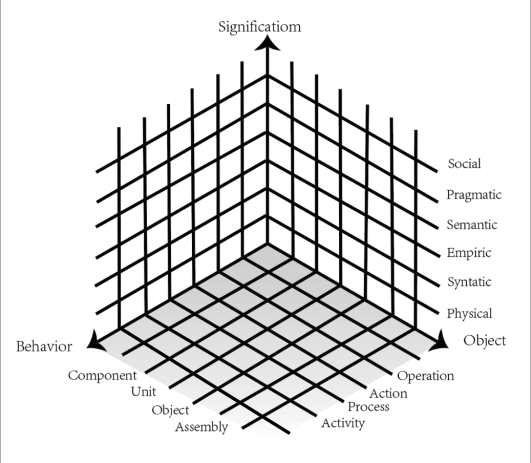
Figure 1. SAPAD framework
So based on this, we can divide the meaning of SAPAD into six levels in the meaning dimension and in the field of design through the visual function ladder framework theory. As shown below.
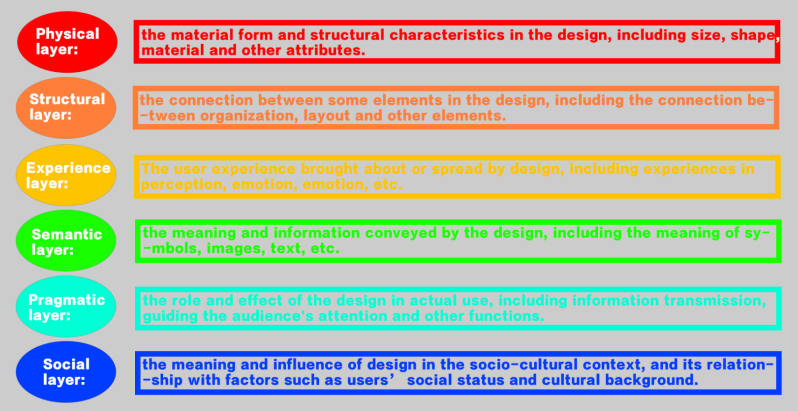
Figure 2. divide the meaning of SAPAD into six levels
2. Experiment
2.1. Experimental design and methods
This time we found six experts from the design community at home and abroad to rate the six value dimensions of SAPAD. In this expert analysis method experiment on SAPAD effectiveness, our design team specially invited six experts from Chinese and foreign design circles with high academic reputations to participate in the experiment to give them a proportional score. These experts all have the title of associate professor or above or a doctorate in design, and their identities were selected after rigorous consideration. [23] Through the scoring results of experts, we can deeply explore the correlation between each value dimension at different levels, and use visualization methods such as chord diagrams to present and analyze this correlation more intuitively.
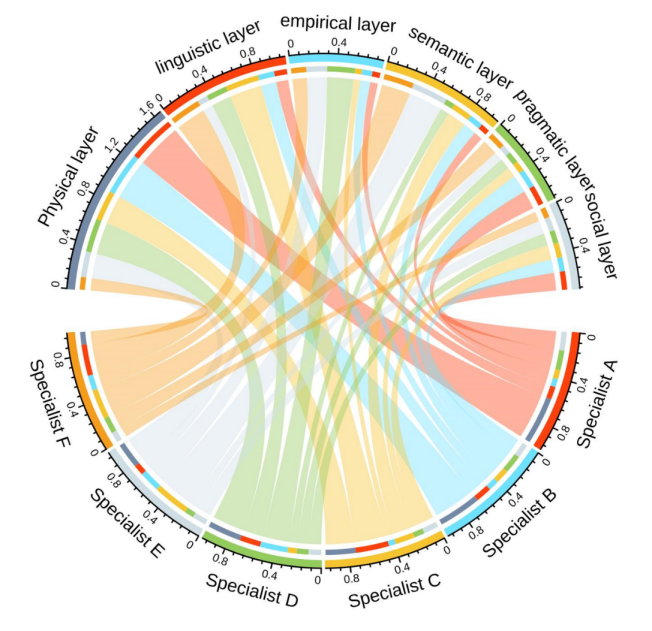
Figure 3. visualization methods
From the experimental results of the chord diagram data, we can easily see that the differences in experts’ cognitive connections of the meaning dimensions within the SAPAD efficacy are not large, and the overall cognitive level difference for some parts of the large framework in the SAPAD meaning cluster is not greater than 100%. of 30. This is due to the experts’ deep grasp of design standards. Therefore, we need to further analyze the TOPSIS method.
First, we construct a decision matrix from the experts’ scoring distribution results  :
:
\( X=[\begin{matrix}0.41 & 0.37 & 0.26 & 0.29 & 0.22 & 0.11 \\ 0.11 & 0.14 & 0.29 & 0.18 & 0.09 & 0.27 \\ 0.07 & 0.09 & 0.06 & 0.24 & 0.18 & 0.13 \\ 0.08 & 0.12 & 0.17 & 0.08 & 0.31 & 0.26 \\ 0.17 & 0.16 & 0.09 & 0.10 & 0.08 & 0.14 \\ 0.16 & 0.12 & 0.13 & 0.11 & 0.12 & 0.09 \\ \end{matrix}] \) (1)
Then, we introduce the formula of the standardized decision matrix for calculation:
\( X_{ij}^{*}=\frac{{X_{ij}}}{\sqrt[]{\sum _{i=1}^{m}X_{ij}^{2}}} \) (2)
Through calculation, we can determine the weight vector W, and then calculate the weighted standardized decision matrix R:
\( {r_{ij}}={w_{j}}\cdot x_{ij}^{*} \) (3)
Next step, determine the ideal solution  and the negative ideal solution
  :
:
\( a_{j}^{+}=max({r_{1j}},{r_{2j}},…,{τ_{mj}}) \) (4)
\( a_{j}^{-}=min({r_{1j}},{r_{2j}},…,{r_{mj}}) \) (5)
After obtaining the corresponding results, calculate the distance between each alternative and the ideal solution and the negative ideal solution.  and
and
\( D_{i}^{+}=\sqrt[]{\sum _{j=1}^{n}{({r_{ij}}-a_{j}^{+})^{2}}} \) (6)
\( D_{i}^{-}=\sqrt[]{\sum _{j=1}^{n}{({r_{ij}}-a_{j}^{-})^{2}}}\ \ \ (7) \)
Finally, calculate the overall score 
\( {C_{i}}=\frac{D_{i}^{-}}{D_{i}^{+}+D_{i}^{-}} \) (8)
After data extraction and calculation, the comprehensive score of each alternative is obtained. Cias follows:
\( \begin{matrix}{C_{1}} & ≈0 \\ {C_{2}} & ≈0.699 \\ {C_{3}} & ≈0.551 \\ {C_{4}} & ≈0.534 \\ {C_{5}} & ≈0.289 \\ {C_{6}} & ≈0 \\ \end{matrix} \) (9)
Now, sort the alternatives according to the comprehensive score Ci, and select the one with the highest comprehensive score as the optimal solution. The alternative with the highest overall score is Alternative 2 (Expert B).
Therefore, according to the TOPSIS method, expert B's plan was selected as the optimal solution. This result may be influenced by several factors. First of all, expert B may have rich experience and in-depth research in the design field, and his proposed solution is more in line with professional standards and actual needs under the SAPAD performance framework. Secondly, Expert B may have high ability in understanding and applying SAPAD theory, and can combine theory with practice to propose more realistic design solutions. In addition, expert B's solution may be balanced in multiple dimensions and meet the requirements of the optimal solution.
2.2. Experimental methodology
Correlation heatmaps [24] play a key role in data analysis and visualization. By graphically displaying the correlation structure between variables in the data set, they help quickly identify the relationship patterns between variables and discover potential patterns and trends. . It guides feature selection, identifies multicollinearity problems, and can be used to communicate and display data analysis results, providing data analysts with effective tools and visualization methods to gain a deeper understanding of the interrelationships between features of the data set. Extract the dimensions of expert B's SAPAD comments and form a correlation heat map (Corrplot) to display detailed data.
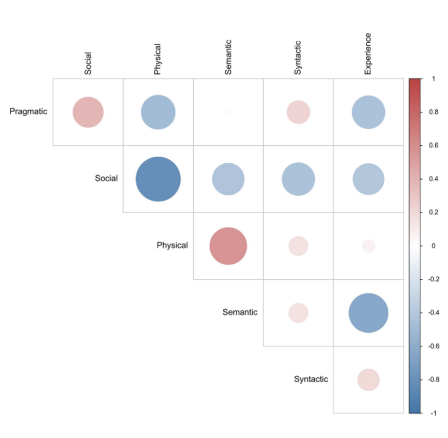
Figure 4. heat map
2.3. Primary conclusions
In expert B's correlation matrix, there are several relatively important and obvious correlation values. Let us expand and interpret them:
①. Physical layer and semantic layer: The correlation coefficient is 0.59. This shows that there is a strong positive correlation between the physical layer and the semantic layer. In design, there is a certain degree of consistency or interaction between physical properties (such as size, shape, material) and semantic meaning (such as the meaning of symbols, images, text). This means that the physical form of a design may be closely related to the meaning it conveys. For example, the appearance and materials of a product may affect people's understanding of its meaning and message.
②. Linguistic layer and pragmatic layer: the correlation coefficient is 0.53. This shows that there is a strong positive correlation between the semantic layer and the pragmatic layer. In design, there is a certain degree of consistency or mutual influence between the way elements are connected (structural layer) and the role and effect of the design in actual use (pragmatic layer). This means that the structural characteristics of the design may affect its function and effect in practical applications. For example, the rationality of the layout may affect the transmission of information and the guidance of user attention.
③. Social layer and pragmatic layer: the correlation coefficient is 0.46. This suggests that there is a certain degree of positive correlation between the social and pragmatic levels. In design, there is a certain degree of consistency or mutual influence between the meaning and impact of design in the socio-cultural context (social level) and the role and effect of design in actual use (pragmatic level). This means that the meaning of design in the socio-cultural environment may affect its functions and effects in practical applications. For example, design may have different functions and effects in different cultural backgrounds.
The characteristics of these correlation values provide a certain understanding of the relationship between different levels in this theme design, and help to gain a deeper understanding of the comprehensive impact and significance of poster interaction.
According to the correlation matrix results of expert B’s design concept, it is not difficult to see that the relationship between different levels such as the physical layer, semantic layer, semantic layer, pragmatic layer, and social layer should be comprehensively considered in the design process to ensure that the design can Aspects such as form, structural features, user experience, meaning conveyance, functional effects and social impact have all been fully considered and coordinated. Specific considerations are as follows:
①. Comprehensively consider the design of the physical layer and semantic layer: Since there is a strong positive correlation between the physical layer and the semantic layer, the design process should comprehensively consider the appearance, size, material and other physical attributes of the product as well as the symbols and symbols conveyed. The relationship between semantic meanings such as images and texts. It is recommended to pay attention to the consistency between the physical form and the conveyed meaning during the design process to ensure that the appearance and materials of the product can effectively convey the design intention and information.
②. Pay attention to the coordination between the semantic layer and the pragmatic layer: Since there is a strong positive correlation between the semantic layer and the pragmatic layer, the design process should pay attention to the connection between the design elements (the semantic layer) and the design Coordination between functions and effects (pragmatic level) in actual use. It is recommended that the information transmission effect and user attention guidance be taken into consideration when designing the layout and structure, and ensure that the structural features of the design can support its functions and effects in actual use.
③. Pay attention to the impact of the social layer and the pragmatic layer: Since there is a certain degree of positive correlation between the social layer and the pragmatic layer, the meaning and impact of the design in the socio-cultural context (social layer) may affect its actual use. functions and effects (pragmatic layer). It is recommended that the design significance and impact in different social and cultural environments be taken into consideration during the design process to ensure that the design can produce positive effects and effects in different contexts.
In the above levels, visual function compensation may compensate for visual loss through other senses (such as touch, hearing) or cognitive strategies (such as memory, anticipation), thereby realizing the perception and understanding of the design. Design at these levels may need to take into account the special needs and abilities of people with visual impairments to ensure that the design effectively meets their functional and experiential requirements.
3. Design practice
Integrating innovative design concepts and technical means to promote the integration and development of cultural traditions and modern design is also one of the concepts of the SAPAD-TOPSIS framework, because the issue of visual function compensation is global and cannot be limited to a single country or country. When conducting research on a single regional project, the problem should be studied from a broader perspective. Therefore, based on the obtained data and methodology, the design team decided to conduct some Chinese and Western cultural poster design competitions based on the results of the previous research, and strive to achieve good design effects.
First of all: the basic visual colors displayed by the SAPAD-TOPSIS framework should be divided into red, orange, yellow, green, cyan, blue and purple. This perception of color results from stimulation of the human eye's cone cells by electromagnetic radiation in the visible spectrum. [26] Therefore, for the compensation of color function, we can set and analyze the spectral data:

Figure 5. spectral data
The longer the wavelength of a color, usually means it's located closer to the red end of the visible spectrum. This will have the following effects on color:
1. Color perception: Colors with longer wavelengths will look closer to red, such as orange, yellow and red. These colors are visually perceived as warmer and brighter.
2. Penetration of light: Long wavelength light penetrates media more easily, such as air, water and glass, so the colors presented in these media may be slightly different.
3. Energy characteristics: Light with longer wavelength has lower frequency and energy. Therefore, red and colors near red are generally considered lower energy colors.
4. Emotional impact: Long wavelength colors may have different emotional effects. For example, red is thought to have motivating, energizing, and enthusiastic qualities, while orange has a feeling of warmth and vitality.
Therefore, longer color wavelengths may affect people's perception of color, the penetrability of light, and the emotional effect conveyed by color. In this design practice, these influences will be better integrated with the SAPAD framework. Therefore, we can choose colors with longer wavelengths for poster design. Before designing, we can also divide the data obtained from the design wavelength into the TOPSIS framework, and the result is:
Table 1. result
Color | Normalized Wavelength | Normalized Frequency | Euclidean Distance |
Red | 1 | 0 | 0 |
Orange | 0.75 | 0.25 | 60.82 |
Yellow | 0.5 | 0.5 | 108.66 |
Green | 0.25 | 0.75 | 131.56 |
Cyan | 0 | 1 | 138.18 |
Blue | 0.25 | 0.875 | 131.56 |
Indigo | 0.5 | 0.75 | 108.66 |
The results show that red has the smallest Euclidean distance in the color selection scheme and is therefore the most preferred color. This suggests that in a design where you want to attract attention or create a strong visual effect, red may be a good choice. And adjusting the weight of wavelength can affect the selection of the final color scheme. But while red is the best solution, other colors still have their uses. Orange, yellow, and green are also close to optimal and therefore good choices in the design. Cyan, blue, and violet are considered poor choices in this example, but may still have their uses in certain situations (e.g., parallax stimulation, counterexample substitution, etc.).
4. Concrete practice
In specific practice, we will actively participate in international design competitions to showcase our design concepts and creativity that incorporate the SAPAD-TOPSIS framework and visual function compensation theory. [27,28] First, we will select design themes with global significance and influence to attract the attention of the international community. To this end, based on the previous research results, the design team participated in the "International Cultural and Art Design Exhibition for the 50th Anniversary of the Establishment of Diplomatic Relations between China and the West" and achieved good specific design practices. The following are specific design practices:
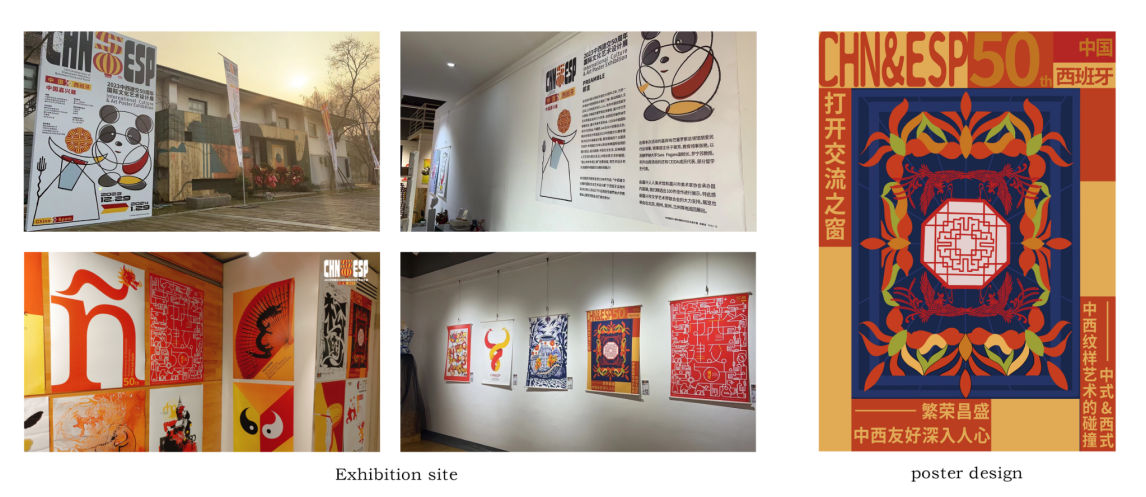
Figure 6. design practices
The exhibition process involves experts reviewing outstanding design works for inclusion in the exhibition. This design team’s poster design received a good ranking. In terms of visual function, we randomly conducted a questionnaire survey among people who visited the site and obtained some experimental data. Moreover, we summarized the Likert scale method in the specific practice questionnaire [25] and asked relevant questions about the details of the poster design through the SAPAD-TOPSIS framework. Got good data feedback.
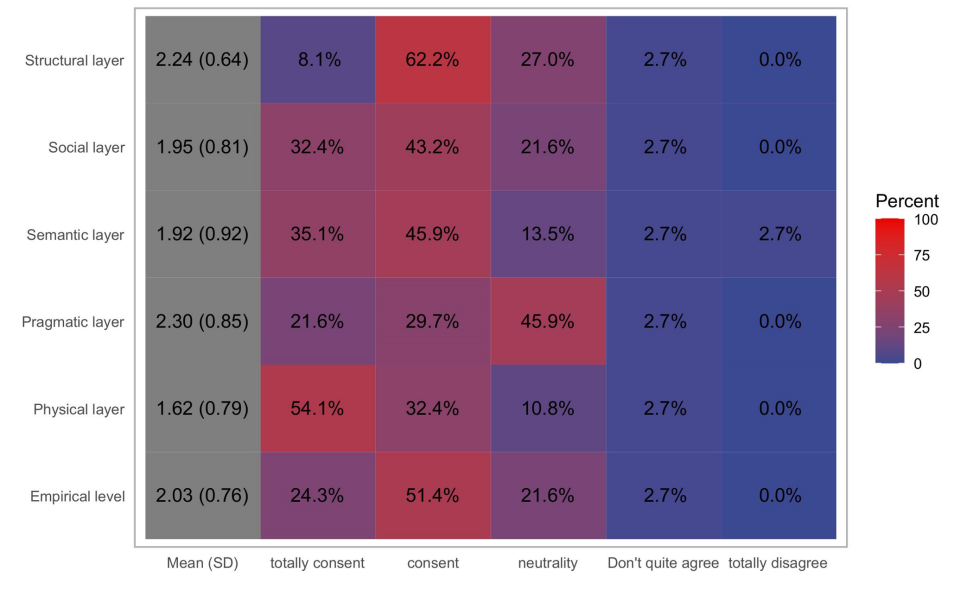
Figure 7. SAPAD-TOPSIS framework
Based on the attitudes of the 37 respondents and the Likert heat map analysis results of the posters based on the SAPAD-TOPSIS framework, the respondents with neutral and above attitudes at six levels are the majority of the population, so the design team Basically the following conclusions are drawn:
①. On the physical layer, the font size, color and contrast of the poster can attract the attention of the target audience, which was recognized by the interviewees.
②. In terms of language structure, the layout and structure of the poster clearly conveyed the information and guided the audience's reading order, which was affirmed by the interviewees.
③. At the experience level, the images and icons used in the posters intuitively express the characteristics and value of the product or activity, and are recognized by the interviewees.
④. At the semantic level, the design of the poster improves the readability and understandability of the information, allowing the audience to quickly obtain key information, which was affirmed by the interviewees.
⑤. At the pragmatic level, the visual elements of the poster are attractive enough to stimulate the audience's interest and emotional resonance, which was recognized by the interviewees.
⑥. At the social level, the design of the poster conforms to the values and cultural background of the target audience, arouses their resonance and recognition, and is recognized by the interviewees.
Through the investigation and analysis of six aspects of poster design: physical, linguistic structure, experience, semantics, pragmatics and society, it was found that design can attract attention, convey information, express features and values, improve readability and understandability, and inspire Good results have been achieved in terms of interest and emotional resonance, and in line with the values and cultural background of the target audience. [25,26] Therefore, the poster design has been recognized and affirmed as a whole, providing effective information transmission and visual experience for the target audience.
5. Conclusion and outlook
This study uses the interpretation of the "behavior-meaning-object" effectiveness in the SAPAD theoretical framework and integrates the TOPSIS method into the evaluation process of poster design to explore a new paradigm of visual function compensation interactive cognitive poster design. Through the exploration and evaluation of diversified interaction methods, we can more objectively evaluate the pros and cons of design solutions and guide designers to formulate more effective design strategies. [30] Among them, the design team conducted actual design practice based on the results explored through this visual function compensation framework, and obtained good feedback. However, at the same time, there are still certain shortcomings in the design research process:
First of all, this research is still limited to exploration at the theoretical level, and the scope of actual design practice is relatively narrow. Future research can strengthen empirical research, expand the scope of verification, and verify the effectiveness and feasibility of the proposed design framework and methods through the analysis and evaluation of actual cases. [30,31]
Secondly, this study still needs to be improved in the construction and evaluation methods of the interactive cognitive framework. Since there are not many cases to discuss the integration of the SAPAD framework and the TOPSIS method, there are some deficiencies in the construction of the design process. Future research can further improve the theoretical system of the interactive cognitive framework, explore more systematic and scientific evaluation methods, and improve the objectivity and accuracy of evaluation results.
Finally, this study also has certain limitations in data collection and analysis methods. For example, although the Likert analysis method described below can roughly analyze the audience's views on this design activity, the amount of data is small and there are problems with the questionnaire setting. It is hoped that problems such as inadequacy will be solved in future designs. [31] Future researchers can use more diverse and multi-angle data sources and combine them with more advanced data analysis techniques to obtain more in-depth and comprehensive research conclusions.
References
[1]. Lou M ,Iwatsuki M ,Wu X , et al.ASO Visual Abstract: Cancer-Associated Fibroblast-Derived IL-8 Upregulates PD-L1 Expression in Gastric Cancer Through the NF-κB Pathway.[J].Annals of surgical oncology,2024,31(3):1802-1803.
[2]. Mengnan S ,Chen C ,Bo X , et al.Vision-Based Detection Method for Construction Site Monitoring by Integrating Data Augmentation and Semisupervised Learning[J].Journal of Construction Engineering and Management,2024,150(5):
[3]. Lipp B .Robot Drama: Investigating Frictions between Vision and Demonstration in Care Robotics[J].Science, Technology, Human Values,2024,49(2):318-343.
[4]. Luo W ,Wang J ,Wang C , et al.Research on the Visual Imagery of Posters Based on the Culture Code Theory of Design.[J].Frontiers in psychology,2022,13861366-861366.
[5]. Palczewski H C .Posters for Peace: Visual Rhetoric and Civic Action[J].Quarterly Journal of Speech,2017,103(4):431-434.
[6]. Weller M J ,Bennemann M ,Tourtas T , et al.Differences in Guttae Ultramorphology in Relation to Visual Function in Fuchs Endothelial Corneal Dystrophy.[J].Cornea,2024,
[7]. Crotti M ,Ortibus E ,Mailleux L , et al.Visual, perceptual functions, and functional vision in children with unilateral cerebral palsy compared to children with neurotypical development.[J].Developmental medicine and child neurology,2024,
[8]. Tsai H L ,Chen Y B ,Su C K , et al.The status of binocular visual functions among Taiwan high-tech industry engineers and its correlation with computer vision symptom.[J].Scientific reports,2024,14(1):826-826.
[9]. Pilar C ,Mario C ,Francisco L , et al.Assessing the role of visual dysfunctions in the association between visual symptomatology and the use of digital devices[J].Journal of Optometry,2024,17(3):100510-.
[10]. Suzuki S ,Kamiya K ,Iizuka T , et al.Wavelength Characteristics and Visual Function of Photochromic Contact Lenses in Indoor and Outdoor Conditions[J].Journal of Clinical Medicine,2023,12(23):
[11]. Luo B .Títul Mobile visual media design based on digital media technology and augmented reality[J].Applied Mathematics and Nonlinear Sciences,2024,9(1):
[12]. Keiichi S ,Fei H ,Kun Z , et al.Meaningful Experience in Service Design: Case Study of SAPAD Framework Application[J].Advances in Transdisciplinary Engineering,2018,7526-535.
[13]. Fei H ,Jun L ,Wei W , et al.Meaningful Experience in Service Design for the Elderly: SAPAD Framework and its Case Study[J].Proceedings of the Design Society: International Conference on Engineering Design,2019,1(1):3081-3090.
[14]. Hu F ,Jin Y ,Zhan X .A Study on Healthy Food Service Designing for Semi-disabled Elderly Based on SAPAD[J].Procedia CIRP,2019,83506-512.
[15]. Qing W ,Man L ,Yanghao Y , et al.Experience Design for Cognitive Education Based on the SAPAD-AHP Vocational Rehabilitation for Mental Retardation People[J].The Frontiers of Society, Science and Technology,2022,4(10):
[16]. Hu Fei, Shen Xipeng, Wang Xingyu, et al. Research on the Design of Integrated Cabinets Based on SAPAD [J]. Journal of Nanjing Arts Institute (Fine Arts and Design), 2015(05): 188-192.
[17]. Yang Bolin, He Renke. Research on the Design of Online Learning Interactive Products Based on SAPAD and Scenario-Based Thinking [J]. Packaging Engineering, 2023, 44(02): 167-179.
[18]. Chen Shanshan, Duan Qijun, Li Yajun. Research on the Design of Children's Dental Service System Based on SAPAD-AHP [J]. Packaging Engineering, 2021, 42(10): 115-123. DOI:10.19554/j.cnki.1001-3563.2021.10.016.
[19]. Zhang Zhang, Pan Yezhou, Sun Ying, et al. Research on the Design of Community Smart Supply Station Service System Based on PSPL-SAPAD-AHP [J]. Packaging Engineering, 2023, 44(18): 426-435. DOI:10.19554/j.cnki.1001-3563.2023.18.051.
[20]. Wang Chao, Gu Meili, Long Ruojia, et al. Research on the Innovative Design of Train Sleeper Layout Based on Passenger Behavior Analysis [J]. Packaging Engineering, 2023, 44(18): 27-34+51. DOI:10.19554/j.cnki.1001-3563.2023.18.004.
[21]. Wang Wei, Hu Fei. Local Knowledge and Contextual Reconstruction in Home Appliance Design [J]. Decoration, 2021(08): 24-29. DOI:10.16272/j.cnki.cn11-1392/j.2021.08.009.
[22]. Mohd. N ,Chaudhary M W ,Mohd. S .A comparison between fuzzy AHP and fuzzy TOPSIS methods to software requirements selection[J].Alexandria Engineering Journal,2022,61(12):10851-10870.
[23]. Huang X ,Gui P,Yao J, et al.An Applied View to Determine the Weights of Experts' Scores Based on an Evidential Reasoning Approach Under Two-Dimensional Frameworks[J].IAENG International Journal of Computer Science,2023,50(3):
[24]. S L .Utilizing heat maps as explainable artificial intelligence for detecting abnormalities on wrist and elbow radiographs.[J].Radiography (London, England : 1995),2023,29(6):1132-1138.
[25]. R K P ,T R A ,Nithyasri B , et al.The many foibles of Likert scales challenge claims that self-report measures of self-control are better than performance-based measures.[J].Behavior research methods,2023,56(2):908-933.
[26]. Jahan I M ,Faruque I R M ,Mugren A K .Polarization-incident angle independent metamaterial wave absorber for enhanced electromagnetic energy harvesting in ultraviolet-B, visible spectrum, and near-infrared frequency range[J].Materials Today Communications,2024,38108229-.
[27]. Wang F ,Wang X .Theme Analysis and Participation Strategies for the Innovation Design Competition for Mechanical Engineering[J].Advances in Educational Technology and Psychology,2023,7(5):
[28]. Yiğit A ,Gönülnur D ,Melek K .Data and discourse: an assessment of Taksim urban design competition in terms of populism and participation[J].Journal of Urban Design,2023,28(6):682-698.
[29]. Jian J .Computer-aided visual communication design based on image detail enhancement algorithm[J].Optical and Quantum Electronics,2024,56(4):
[30]. Zhiyang L ,Seokwon C .A study of digital exhibition visual design led by digital twin and VR technology[J].Measurement: Sensors,2024,31100970-.
[31]. Yan H ,Jiang H ,Wang J , et al.Audience-oriented Aesthetic and Creative Research on Animated Films Based on Visual Communication Design[J].Applied Mathematics and Nonlinear Sciences,2024,9(1):
Cite this article
Li,Y.;Song,P.;Zhou,B. (2024). Interactive cognitive poster design based on visual function compensation from the perspective of SAPAD-TOPSIS. Applied and Computational Engineering,92,40-51.
Data availability
The datasets used and/or analyzed during the current study will be available from the authors upon reasonable request.
Disclaimer/Publisher's Note
The statements, opinions and data contained in all publications are solely those of the individual author(s) and contributor(s) and not of EWA Publishing and/or the editor(s). EWA Publishing and/or the editor(s) disclaim responsibility for any injury to people or property resulting from any ideas, methods, instructions or products referred to in the content.
About volume
Volume title: Proceedings of the 6th International Conference on Computing and Data Science
© 2024 by the author(s). Licensee EWA Publishing, Oxford, UK. This article is an open access article distributed under the terms and
conditions of the Creative Commons Attribution (CC BY) license. Authors who
publish this series agree to the following terms:
1. Authors retain copyright and grant the series right of first publication with the work simultaneously licensed under a Creative Commons
Attribution License that allows others to share the work with an acknowledgment of the work's authorship and initial publication in this
series.
2. Authors are able to enter into separate, additional contractual arrangements for the non-exclusive distribution of the series's published
version of the work (e.g., post it to an institutional repository or publish it in a book), with an acknowledgment of its initial
publication in this series.
3. Authors are permitted and encouraged to post their work online (e.g., in institutional repositories or on their website) prior to and
during the submission process, as it can lead to productive exchanges, as well as earlier and greater citation of published work (See
Open access policy for details).
References
[1]. Lou M ,Iwatsuki M ,Wu X , et al.ASO Visual Abstract: Cancer-Associated Fibroblast-Derived IL-8 Upregulates PD-L1 Expression in Gastric Cancer Through the NF-κB Pathway.[J].Annals of surgical oncology,2024,31(3):1802-1803.
[2]. Mengnan S ,Chen C ,Bo X , et al.Vision-Based Detection Method for Construction Site Monitoring by Integrating Data Augmentation and Semisupervised Learning[J].Journal of Construction Engineering and Management,2024,150(5):
[3]. Lipp B .Robot Drama: Investigating Frictions between Vision and Demonstration in Care Robotics[J].Science, Technology, Human Values,2024,49(2):318-343.
[4]. Luo W ,Wang J ,Wang C , et al.Research on the Visual Imagery of Posters Based on the Culture Code Theory of Design.[J].Frontiers in psychology,2022,13861366-861366.
[5]. Palczewski H C .Posters for Peace: Visual Rhetoric and Civic Action[J].Quarterly Journal of Speech,2017,103(4):431-434.
[6]. Weller M J ,Bennemann M ,Tourtas T , et al.Differences in Guttae Ultramorphology in Relation to Visual Function in Fuchs Endothelial Corneal Dystrophy.[J].Cornea,2024,
[7]. Crotti M ,Ortibus E ,Mailleux L , et al.Visual, perceptual functions, and functional vision in children with unilateral cerebral palsy compared to children with neurotypical development.[J].Developmental medicine and child neurology,2024,
[8]. Tsai H L ,Chen Y B ,Su C K , et al.The status of binocular visual functions among Taiwan high-tech industry engineers and its correlation with computer vision symptom.[J].Scientific reports,2024,14(1):826-826.
[9]. Pilar C ,Mario C ,Francisco L , et al.Assessing the role of visual dysfunctions in the association between visual symptomatology and the use of digital devices[J].Journal of Optometry,2024,17(3):100510-.
[10]. Suzuki S ,Kamiya K ,Iizuka T , et al.Wavelength Characteristics and Visual Function of Photochromic Contact Lenses in Indoor and Outdoor Conditions[J].Journal of Clinical Medicine,2023,12(23):
[11]. Luo B .Títul Mobile visual media design based on digital media technology and augmented reality[J].Applied Mathematics and Nonlinear Sciences,2024,9(1):
[12]. Keiichi S ,Fei H ,Kun Z , et al.Meaningful Experience in Service Design: Case Study of SAPAD Framework Application[J].Advances in Transdisciplinary Engineering,2018,7526-535.
[13]. Fei H ,Jun L ,Wei W , et al.Meaningful Experience in Service Design for the Elderly: SAPAD Framework and its Case Study[J].Proceedings of the Design Society: International Conference on Engineering Design,2019,1(1):3081-3090.
[14]. Hu F ,Jin Y ,Zhan X .A Study on Healthy Food Service Designing for Semi-disabled Elderly Based on SAPAD[J].Procedia CIRP,2019,83506-512.
[15]. Qing W ,Man L ,Yanghao Y , et al.Experience Design for Cognitive Education Based on the SAPAD-AHP Vocational Rehabilitation for Mental Retardation People[J].The Frontiers of Society, Science and Technology,2022,4(10):
[16]. Hu Fei, Shen Xipeng, Wang Xingyu, et al. Research on the Design of Integrated Cabinets Based on SAPAD [J]. Journal of Nanjing Arts Institute (Fine Arts and Design), 2015(05): 188-192.
[17]. Yang Bolin, He Renke. Research on the Design of Online Learning Interactive Products Based on SAPAD and Scenario-Based Thinking [J]. Packaging Engineering, 2023, 44(02): 167-179.
[18]. Chen Shanshan, Duan Qijun, Li Yajun. Research on the Design of Children's Dental Service System Based on SAPAD-AHP [J]. Packaging Engineering, 2021, 42(10): 115-123. DOI:10.19554/j.cnki.1001-3563.2021.10.016.
[19]. Zhang Zhang, Pan Yezhou, Sun Ying, et al. Research on the Design of Community Smart Supply Station Service System Based on PSPL-SAPAD-AHP [J]. Packaging Engineering, 2023, 44(18): 426-435. DOI:10.19554/j.cnki.1001-3563.2023.18.051.
[20]. Wang Chao, Gu Meili, Long Ruojia, et al. Research on the Innovative Design of Train Sleeper Layout Based on Passenger Behavior Analysis [J]. Packaging Engineering, 2023, 44(18): 27-34+51. DOI:10.19554/j.cnki.1001-3563.2023.18.004.
[21]. Wang Wei, Hu Fei. Local Knowledge and Contextual Reconstruction in Home Appliance Design [J]. Decoration, 2021(08): 24-29. DOI:10.16272/j.cnki.cn11-1392/j.2021.08.009.
[22]. Mohd. N ,Chaudhary M W ,Mohd. S .A comparison between fuzzy AHP and fuzzy TOPSIS methods to software requirements selection[J].Alexandria Engineering Journal,2022,61(12):10851-10870.
[23]. Huang X ,Gui P,Yao J, et al.An Applied View to Determine the Weights of Experts' Scores Based on an Evidential Reasoning Approach Under Two-Dimensional Frameworks[J].IAENG International Journal of Computer Science,2023,50(3):
[24]. S L .Utilizing heat maps as explainable artificial intelligence for detecting abnormalities on wrist and elbow radiographs.[J].Radiography (London, England : 1995),2023,29(6):1132-1138.
[25]. R K P ,T R A ,Nithyasri B , et al.The many foibles of Likert scales challenge claims that self-report measures of self-control are better than performance-based measures.[J].Behavior research methods,2023,56(2):908-933.
[26]. Jahan I M ,Faruque I R M ,Mugren A K .Polarization-incident angle independent metamaterial wave absorber for enhanced electromagnetic energy harvesting in ultraviolet-B, visible spectrum, and near-infrared frequency range[J].Materials Today Communications,2024,38108229-.
[27]. Wang F ,Wang X .Theme Analysis and Participation Strategies for the Innovation Design Competition for Mechanical Engineering[J].Advances in Educational Technology and Psychology,2023,7(5):
[28]. Yiğit A ,Gönülnur D ,Melek K .Data and discourse: an assessment of Taksim urban design competition in terms of populism and participation[J].Journal of Urban Design,2023,28(6):682-698.
[29]. Jian J .Computer-aided visual communication design based on image detail enhancement algorithm[J].Optical and Quantum Electronics,2024,56(4):
[30]. Zhiyang L ,Seokwon C .A study of digital exhibition visual design led by digital twin and VR technology[J].Measurement: Sensors,2024,31100970-.
[31]. Yan H ,Jiang H ,Wang J , et al.Audience-oriented Aesthetic and Creative Research on Animated Films Based on Visual Communication Design[J].Applied Mathematics and Nonlinear Sciences,2024,9(1):