


1. Introduction
The rise of quantitative trading is in part due to incorporating machine learning (ML) techniques. Nowadays, traders and hedge funds have been using ML to predict price movements and optimise trading strategies. In the realm of trading ML, supervised learning, reinforcement learning, and deep learning are the main areas where major impacts have made. Supervised learning refers to the process of building a model that analyses historical trading data to predict future data. There are three main subareas of supervised learning: regression analysis, classification models, and time series prediction. Using regression analysis, traders can model the relationship between market variables to predict future prices, such as changes in stock prices or commodities. Classification models, on the other hand, predict binary outcomes that display a non-linear relationship. For instance, are stock prices likely to go up or down tomorrow? The add-on of time series prediction enhances the knowledge of foreseeing market trends based on temporal dependencies. Reinforcement learning (RL) refers to the agent’s learning from interaction with the trading environment. RL agents develop their trading strategies through maximising cumulative rewards with dynamic and complex environments. RL agents can adapt to new market conditions and tweak their decisions over time. Therefore, RL is particularly well-suited to dynamic and complex financial markets. Deep learning deals with learning from large volumes of data to model non-linear relationships and capture highly complex patterns. In particular, deep neural networks, such as convolutional neural networks (CNN) and recurrent neural networks (RNN), can handle large quantities of temporal data and sequential inputs, which are critical for financial trading and decision-making. In this paper, we review and analyse the main ML algorithms and their applications in quantitative trading [1]. We shed light on the theoretical background, practical applications, and examples of ML tools used in trading, and highlight the challenges and limitations of these approaches. Subsequently, we will discuss future prospects for ML applications in finance.
2. Supervised Learning
2.1. Regression Analysis
Regression analysis is a fundamental supervised learning technique used to predict continuous outcomes based on historical data. In quantitative trading, regression models are employed to forecast future asset prices by identifying relationships between various market variables. The basic mathematical model for linear regression is given by:
\( y={β_{0}}+{β_{1}}{x_{1}}+{β_{2}}{x_{2}}+⋯+{β_{p}}{x_{p}}+ϵ \) (1)
where \( y \) is the dependent variable (e.g, future price), \( {x_{1}},{x_{2}},…,{x_{p}} \) are the independent variables (e.g., historical prices, volumes), \( {β_{0}} \) is the intercept, \( {β_{1}},{β_{2}},…,{β_{p}} \) are the coefficients, and \( ϵ \) is the error term. By minimising the sum of squared errors (one of the loss functions), the regression models are trained on a given data. If the training data is a sequence of historical market outcomes, estimates for coefficients are provided. These can be further generalised to multiple regression (having multiple predictors) and to polynomial regression (modelling nonlinear relationship) [2]. The power of the regression analysis depends on the informative features, where features selection and engineering become important parts of the modelling process. Table 1 shows how an example of regression analysis is done, to predict the future price of a stock based on the historical data of trading volume where each feature is estimated (for linear regression) and the whole prediction model is built based on the informative features.
Table 1. Example of Regression Analysis in Quantitative Trading
Date | Historical Price (x1) | Trading Volume (x2) | Future Price (y) | Predicted Future Price (y^) |
2023-01-01 | 100 | 1500 | 102 | 101.5 |
2023-01-02 | 102 | 1600 | 105 | 104.0 |
2023-01-03 | 105 | 1550 | 107 | 106.2 |
2023-01-04 | 107 | 1580 | 110 | 109.0 |
2023-01-05 | 110 | 1620 | 113 | 112.3 |
Parameters of the Regression Model: Intercept \( ({β_{0}}):0.5, \) Coefficient for Historical Price (β1):0.8, Coefficient for Trading Volume \( ({β_{2}}):0.001 \)
Regression Equation
\( \hat{y}={β_{0}}+{β_{1}}{x_{1}}+{β_{2}}{x_{2}} \)
Using the parameters provided: \( \hat{y}=0.5+0.8\cdot {x_{1}}+0.001\cdot {x_{2}} \)
For the first row:
\( \hat{y}=0.5+0.8\cdot 100+0.001\cdot 1500=0.5+80+1.5=82 \)
2.2. Classification Models
Classification models are used to categorize data into predefined classes and are particularly useful in trading for predicting binary outcomes, such as whether a stock will go up or down. Logistic regression is a common classification technique, where the probability of a class is modeled using the logistic function:
\( P(y=1|x)=\frac{1}{1+{e^{-({β_{0}}+{β_{1}}{x_{1}}+{β_{2}}{x_{2}}+⋯+{β_{p}}{x_{p}})}}} \) (2)
Here, \( P(y=1|x) \) represents the probability of the positive class (e.g., price increase), and the loqistic function ensures that the output is between 0 and 1. Similarly, classification models such as decision trees and support vector machines (SVM) can be used for trading. Decision trees recursively split the feature space according to feature value of the data, which results in formation of tree-like structure in which data points are classified. An SVM model learns a hyperplane that separates the classes in the feature space [3]. All these models are trained on labelled historical data, where the mode learns to map the input features (features that determine specific rules) to the output classes. Classification models are often used in trading in conjunction with other techniques to develop adaptive trading strategies that detect market trends and anticipate possible price movements.
2.3. Time Series Prediction
Time series prediction involves forecasting future values based on previously observed values, making it an essential tool in quantitative trading. Autoregressive integrated moving average (ARIMA) models are commonly used for time series prediction. The ARIMA model is expressed as:
\( \begin{matrix} & {y_{t}}=c+{ϕ_{1}}{y_{t-1}}+{ϕ_{2}}{y_{t-2}}+⋯+{ϕ_{p}}{y_{t-p}}+{θ_{1}}{ϵ_{t-1}}+{θ_{2}}{ϵ_{t-2}}+⋯+ \\ & {θ_{q}}{ϵ_{t-q}}+{ϵ_{t}} \\ \end{matrix} \) (3)
where \( {y_{t}} \) is the value at time \( t,c \) is a constant, \( {ϕ_{i}} \) are the autoregressive parameters, \( {θ_{i}} \) are the moving average parameters, and \( {ϵ_{t}} \) is the error term. The first class of models – ARIMA (autoregressive integrated moving average) models – uses autoregression, differencing and moving averages as roots to capture the temporal dependencies in the time series. The second class – exponential smoothing methods – uses exponentially decreasing weights for the past observations, making them more responsive to the most recent changes. The last class is the deep learning models. Among them, the recurrent neural networks (RNN) such as Long Short-Term Memory (LSTM) networks are good choices for modelling sequential data, as they maintain a from previous time steps. Thus, they are well suited for modelling temporal dependencies and trends [4]. Time series prediction is important in trading since most strategies try to benefit from predicting market trends.
3. Reinforcement Learning
3.1. Basic Principles
Reinforcement learning (RL) is a type of machine learning where an agent learns to make decisions by interacting with its environment. In the context of trading, the RL agent learns to execute trades by maximizing cumulative rewards, which are typically defined in terms of financial returns. The RL framework consists of states \( (s) \) ,actions \( (a) \) ,and rewards \( (r). \) [5]The agent observes the state of the market \( ({s_{t}}) \) ,takes an action \( ({a_{t}}) \) ,and receives a reward \( ({r_{t}}) \) based on the action’s outcome. The objective is to learn a policy \( (π) \) that maximizes the expected cumulative reward. The Bellman equation, which underlies many RL algorithms, defines the value of a state as:
\( V(s)=\underset{a}{max}[r(s,a)+γ\sum _{s \prime }^{}P(s \prime |s,a)V(s \prime )] \) (4)
where \( γ \) is the discount factor, \( P({s^{ \prime }}|s,a) \) is the transition probability, and \( V(s) \) is the value function. This iterative process of learning through interaction makes RL a powerful tool for developing adaptive trading strategies.
3.2. Q-Learning
Q-learning is a model-free RL algorithm that seeks to learn the optimal action-selection policy by estimating the Q-values, which represent the expected utility of taking a given action in a given state. The Q-learning algorithm updates its estimates of Q-values using the Bellman equation, gradually improving its policy as it experiences more interactions with the environment. The update rule for Q-values is given by:
\( Q(s,a)←Q(s,a)+α[r+γ\underset{a \prime }{max}Q(s \prime ,a \prime )-Q(s,a)] \) (5)
where \( α \) is the learning rate, \( γ \) is the discount factor, \( r \) is the reward, and \( {s^{ \prime }} \) is the next state.In trading, Credit: T M Aubry and R M RyanSpecifically, through Q-learning, one can develop a strategy that adapts to market activity. This strategy is continually updated to better human-like expectations of future returns, leveraging the agent’s past experience (historical data) and real-time state observations (market information). A critical aspect of developing a market strategy using Q-learning is the definition of its internal representation of the world, which is given as the state representation. This representation is often obtained using stock market indices, as well as the selected reward function linked to the overall goal, whether it is maximising the rate of cumulative return or minimising the number of trades. Figure 1 below shows the Q-values associated with Buy, Sell and Hold actions for a series of iterations in a Q-learning algorithm applied to a simple trading scenario. The learning rate (α), discount factor (γ), reward (r), and next state (s') contribute to the updates of these Q-values as the agent learns and refines its trading strategy.
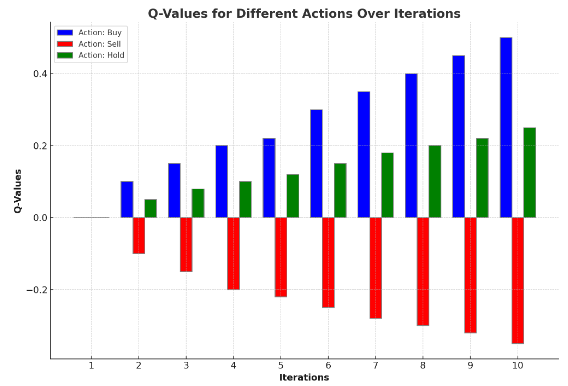 Figure 1. O-Values for Different Actions Over Iterations
3.3. Deep Q-Networks (DQN)
Deep Q-Networks (DQN) combine Q-learning with deep neural networks to handle high-dimensional state spaces, making them suitable for complex trading environments. In DQN, a neural network approximates the Q-values, allowing the agent to learn effective policies even when the state space is large. The network is trained using a replay buffer, which stores past experiences and samples them randomly to break the correlation between consecutive updates [7]. This improves the stability and convergence of the learning process. The loss function for training the Q-network is given by:
\( L(θ)=E[{(r+γ\underset{{a^{ \prime }}}{max}Q({s^{ \prime }},{a^{ \prime }};{θ^{ \prime }})-Q(s,a;θ))^{2}}] \) (6)
where \( θ \) and \( {θ^{ \prime }} \) are the parameters of the current and target Q-networks, respectively. This approach has been applied in many trading contexts, including where the DQN learns to buy or sell assets by observing market states, and trying to maximise long-term returns. In deep Q-Learning, this deep learning helps to capture more sophisticated market data patterns and dependencies to develop more sophisticated trading strategies. [8]
4. Deep Learning
4.1. Neural Networks
Neural networks, particularly deep neural networks (DNN), have gained prominence in quantitative trading due to their ability to model complex nonlinear relationships. A typical neural network consists of multiple layers of interconnected nodes (neurons), each layer transforming the input data through weighted sums and activation functions. The mathematical representation of a single neuron is:
\( \begin{matrix} & z=\sum _{i=1}^{n}{w_{i}}{x_{i}}+b \\ & a=σ(z) \\ \end{matrix} \) (7)
where \( {x_{i}} \) are the input features, \( {w_{i}} \) are the weights, \( b \) is the bias, \( z \) is the linear combination of inputs and weights, and \( σ \) is the activation function. Neural networks can perform various quantitative tasks in trading, such as price prediction, generation of trading signals, and feature extraction. Convolutional neural networks (CNN), and recurrent neural networks (RNN) are two types of neural network architectures that are powerful to capture patterns in space and time, respectively [9]. CNNs, originally developed for image processing, can be used for financial data to detect and identify changes in time series, and RNNs are particularly good at processing sequential data, which makes them useful for forecasting and trend analysis. Figure 2 showcases the performance of a neural network, which is applied to a quantitative trading task such as price prediction.
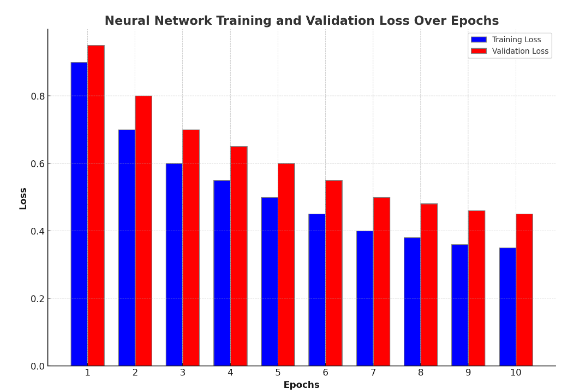 Figure 2. Neural Network Training and Validation Loss Over Epochs
4.2. Convolutional Neural Networks (CNN)
Convolutional Neural Networks (CNN) are designed to process grid-like data structures, such as images and time series, by applying convolutional layers that extract local features. The mathematical operation of a convolutional layer is:
\( (f*g)(t)=\int _{-∞}^{∞}f(τ)g(t-τ) dτ \) (8)
CNNs can be trained on candlestick charts and other visual representations of historical market data, and recognise spatial features that are correlated to future price movements. Such spatial patterns can be recognised because CNNs possess a hierarchical structure where low-level features such as edges and textures are detected in the bottom layers, and high-level features such as shapes and patterns in the upper layers [10]. CNNs can be trained on historical data to recognise visual features that are linked to specific market regimes, trading conditions and price movements, and create a catalogue of trading signals. CNNs are particularly suitable for quantitative trading because of their ability to process large amounts of data.
5. Conclusion
The introduction of ML techniques into quant trading introduced a new array of tools like advaced predictive modelling, strategy optimization and multidimensional data processing. Supervised learning employs regression analysis and classification models to predict the future outlook of an asset and combine these predictions with time series modelling techniques to forecast the trend of a market. Reinforcement learning is a good fit for building dynamic and adaptive strategies due to the reinforcement mechanism built into an RL agent, continuously learning from its own experiences interacting with the market. Q-learning and its recent application of Deep Q-Networks (DQN) demonstrate how RL can learn to make predictions and select the most profitable actions in order to maximise its accummulated reward. Deep learning models based on neural networks, CNNs and RNNs have the capability to encode and model nonlinear relationships and complex patterns with a greater degree of accuracy compared with traditional ML techniques. It is indeed fascinating to see how these ML techniques are evolving and continuing to provide competitive advantage to any trading strategy. This paper has clearly showcased the practical applications of these techniques to trading problems that are available for the traders community to improve trading performance and risk management. This provides a good overview for the practitioner or ML researcher to understand the current state and future directions on how ML is applied in quant trading.
References
[1]. Sahu, Santosh Kumar, Anil Mokhade, and Neeraj Dhanraj Bokde. "An overview of machine learning, deep learning, and reinforcement learning-based techniques in quantitative finance: recent progress and challenges." Applied Sciences 13.3 (2023): 1956.
[2]. Alameer, Ali, Haitham Saleh, and Khaled Alshehri. "Reinforcement learning in quantitative trading: A survey." Authorea Preprints (2023).
[3]. Caplar R and Kulisic P 1973 Proc. Int. Conf. on Nuclear Physics (Munich) vol 1 (Amsterdam:North-Holland/American Elsevier) p 517
[4]. Cagliero, Luca, Jacopo Fior, and Paolo Garza. "Shortlisting machine learning-based stock trading recommendations using candlestick pattern recognition." Expert Systems with Applications 216 (2023): 119493.
[5]. Ullah, AKM Amanat, et al. "Combining machine learning and effective feature selection for real-time stock trading in variable time-frames." International Journal of Computational Science and Engineering 26.1 (2023): 28-44.
[6]. Rani, Veenu, et al. "Self-supervised learning: A succinct review." Archives of Computational Methods in Engineering 30.4 (2023): 2761-2775.
[7]. Assran, Mahmoud, et al. "Self-supervised learning from images with a joint-embedding predictive architecture." Proceedings of the IEEE/CVF Conference on Computer Vision and Pattern Recognition. 2023.
[8]. uarte, José Marcio, and Lilian Berton. "A review of semi-supervised learning for text classification." Artificial intelligence review 56.9 (2023): 9401-9469.
[9]. Ben-Shaul, Ido, et al. "Reverse engineering self-supervised learning." Advances in Neural Information Processing Systems 36 (2023): 58324-58345.
[10]. Cabannes, Vivien, et al. "Active self-supervised learning: A few low-cost relationships are all you need." Proceedings of the IEEE/CVF International Conference on Computer Vision. 2023.
Cite this article
Gao,J. (2024). Applications of machine learning in quantitative trading. Applied and Computational Engineering,82,124-129.
Data availability
The datasets used and/or analyzed during the current study will be available from the authors upon reasonable request.
Disclaimer/Publisher's Note
The statements, opinions and data contained in all publications are solely those of the individual author(s) and contributor(s) and not of EWA Publishing and/or the editor(s). EWA Publishing and/or the editor(s) disclaim responsibility for any injury to people or property resulting from any ideas, methods, instructions or products referred to in the content.
About volume
Volume title: Proceedings of the 2nd International Conference on Machine Learning and Automation
© 2024 by the author(s). Licensee EWA Publishing, Oxford, UK. This article is an open access article distributed under the terms and
conditions of the Creative Commons Attribution (CC BY) license. Authors who
publish this series agree to the following terms:
1. Authors retain copyright and grant the series right of first publication with the work simultaneously licensed under a Creative Commons
Attribution License that allows others to share the work with an acknowledgment of the work's authorship and initial publication in this
series.
2. Authors are able to enter into separate, additional contractual arrangements for the non-exclusive distribution of the series's published
version of the work (e.g., post it to an institutional repository or publish it in a book), with an acknowledgment of its initial
publication in this series.
3. Authors are permitted and encouraged to post their work online (e.g., in institutional repositories or on their website) prior to and
during the submission process, as it can lead to productive exchanges, as well as earlier and greater citation of published work (See
Open access policy for details).
References
[1]. Sahu, Santosh Kumar, Anil Mokhade, and Neeraj Dhanraj Bokde. "An overview of machine learning, deep learning, and reinforcement learning-based techniques in quantitative finance: recent progress and challenges." Applied Sciences 13.3 (2023): 1956.
[2]. Alameer, Ali, Haitham Saleh, and Khaled Alshehri. "Reinforcement learning in quantitative trading: A survey." Authorea Preprints (2023).
[3]. Caplar R and Kulisic P 1973 Proc. Int. Conf. on Nuclear Physics (Munich) vol 1 (Amsterdam:North-Holland/American Elsevier) p 517
[4]. Cagliero, Luca, Jacopo Fior, and Paolo Garza. "Shortlisting machine learning-based stock trading recommendations using candlestick pattern recognition." Expert Systems with Applications 216 (2023): 119493.
[5]. Ullah, AKM Amanat, et al. "Combining machine learning and effective feature selection for real-time stock trading in variable time-frames." International Journal of Computational Science and Engineering 26.1 (2023): 28-44.
[6]. Rani, Veenu, et al. "Self-supervised learning: A succinct review." Archives of Computational Methods in Engineering 30.4 (2023): 2761-2775.
[7]. Assran, Mahmoud, et al. "Self-supervised learning from images with a joint-embedding predictive architecture." Proceedings of the IEEE/CVF Conference on Computer Vision and Pattern Recognition. 2023.
[8]. uarte, José Marcio, and Lilian Berton. "A review of semi-supervised learning for text classification." Artificial intelligence review 56.9 (2023): 9401-9469.
[9]. Ben-Shaul, Ido, et al. "Reverse engineering self-supervised learning." Advances in Neural Information Processing Systems 36 (2023): 58324-58345.
[10]. Cabannes, Vivien, et al. "Active self-supervised learning: A few low-cost relationships are all you need." Proceedings of the IEEE/CVF International Conference on Computer Vision. 2023.