


1. Introduction
Diabetes, a disease that affects the body's hormone insulin producing ability seriously. It therefore results in aberrant carbohydrate metabolism and raises the level of blood glucose, which may heart the organ. A diabetes person usually suffers from high sugar in blood. some of the symptoms may happen including increased hunger, increased thirst and frequent urination because of high blood sugar. If the serious disease is left without treated, many complications can occur [1]. According to the International Diabetes Federation, in 2017, 451 million individuals globally suffered from diabetes. Over the following 26 years, a rise in this number is anticipated, affecting 693 million people [2].
Recent studies have shown that more than half of middle-aged and older adults are neither aware of diabetes prevention nor know how to manage their own diabetes prevention [3]. Therefor there is no better method than early identify, to “stay away from the complications” [4]. Researchers in both biology and computing are working to produce tools for diabetes prediction. Now KNN, linear model, SVM, GBDT are common algorithms. Gupta and Goel did prediction work with K-Nearest Neighbors (KNN) model [5]. They were searching the best value of K. The data was selected by normalization method, such that each feature had a mean of 0 and a variance of 1. With multiple measurement indicators including F1 score, error rate, accuracy, the research gives out the conclusion that k=45 will give the best result of 77.78% F1 score and 87.01% accuracy in certain data set.
Kumari et al. used multiple models and had a comparison, which included linear model (LR) [6]. They used 10-fold cross validation and percentage split technique for training. From a hospital in Bangladesh, they collected diabetic data from 529 individuals The method uses Multinomial Logistic Regression and Ridge Estimation inside the linear model. However, in the end they came to the conclusion that the linear model was not as good as random forest. Yu et al. were trying to do classification in the model of support vector machine (SVM) [7]. The data they used were collected from the 1999-2004 NHANES, knows as National Health and Nutrition Examination Survey. They applied the 10-fold cross-validation in the training data set, and applied the area under curve (AUC) as a performance evaluator. This study concludes with important influences and find out the linear kernel function performs best. Based on the outcomes of AUC, the study concluded that SVM is as good as traditional linear model. Wang et al. built the XGBoost model to do prediction of diabetes. Information on 380 elderly persons was collected through a survey document, including personal information, dietary habits, exercise status, family medical history and so on. Using the AUC index as a evaluator, the team compare the outcome of several machine learning model in certain data set. And they find out that the XGBoost model performs best and the AUC was 0.9182. Then they concluded that the architecture is the most superior [8].
This study's main goal is to investigate and contrast the effectiveness of four different machine learning models, i.e., Support Vector Machine (SVM), K-Nearest Neighbors (KNN), Logistic Regression (LR), and XGBoost, for the prediction of diabetes. Given the great danger of diabetes, one wanted to compare and contrast which model was the most reliable thereby helping healthcare professionals to make timely decisions. This study will acquire and process the data and then train the data in separate models to produce results. The models will be evaluated using AUC to compare and analyze the differences in results from the models. Practical application possibilities are discussed and the potential practical application of the models in a clinical setting is discussed. In the future, one may explore hybrid models that take full advantage of the features of each model.
2. Data and method
This dataset was found from Kaggle. The dataset includes information on gender, age, location, ethnicity, high blood pressure, heart disease, smoking history, BMI, HbA1c levels, blood glucose levels, and diabetes status, and includes health and demographic data for 100,000 people. the aim was to use a cut-off to determine diabetes. Considering that location is not a major influence on diabetes, this study removed location. The information on diabetes status was then used as the dependent variable and the rest of the information as the independent variables to form the dataset. One randomly divided the dataset and test set in a ratio of 1:4.
Nearest Neighbor is a supervised machine learning algorithm and is non-parametric for solving regression and classification problems. In certain situations, KNN produces better results and is simple to implement. To categorize the samples into various class labels, KNN included the concept of similarity measure, distance, proximity in the data items of the dataset. The value of k represents how many the nearest neighboring data items should be considered. The neighboring group or nearest class of the data item is the output label of the class. One may compute the similarity measure between different data points in a dataset using any of the Manhattan distance methods, Euclidean distance and Minkowski distance [8]. By trying k in the range of 1-10, k equal to 5 performed best.
The linear connection between the dependent variable and one or more independent variables is analyzed using linear regression models. Its basic form can be expressed as:
\( y={β_{0}}+{β_{1}}{x_{1}}+…+{β_{n}}{x_{n}}+ϵ\ \ \ (1) \)
Here, y is the dependent variable to predict or explain, x are the independent variables, β0 is the intercept term, β1-βn are coefficients that indicate the amount of change in the dependent variable corresponding to each unit increase in the independent variable; ϵ is the error term. By minimizing the predicted and true values, one can obtain the best-fitting model.
The support vector machine algorithm classifies by constructing a multidimensional hyperplane and in response to two data clusters, optimizing the margin between them in to the maximum. By transforming the input space into a multidimensional space through a kernel function, the algorithm makes to high discriminative power [9, 10]. By comparison, one finds that the polynomial kernel function is slightly better than other models, which including the linear kernel function, and one deduces that the dataset may be better with a non-linear function, so this study uses the polynomial kernel function.
XGBoost is an efficient machine learning algorithm specifically designed to process large-scale datasets. It optimizes the ability to process sparse data through a novel sparse-aware algorithm. In addition, XGBoost introduces weighted quantile sketching, a theoretically sound method for efficiently handling instance weights in approximate tree learning. The performance and scalability of XGBoost is due to its in-depth optimizations of cache access modes, data compression, and slicing techniques [11], which allow it to scale up to billions of samples in resource-limited scenarios, providing fast running speed and excellent prediction accuracy.
AUC (Area Under the Curve) is an important measure for measuring the how it performs of classification models and is particularly applicable to the evaluation of unbalanced datasets. It quantifies the overall classification ability of the model by calculating the area under the ROC (Receiver Operating Characteristic) curve. The advantage of AUC is that it is independent of the selection of specific thresholds, and can fully reflect the performance of the model under various thresholds. In addition, AUC takes into account both the False Positive Rate (FPR) and True Positive Rate (TPR). That enables it to make an accurate performance evaluation when facing the problem of imbalance data. The interpretation of the AUC value is intuitive and simple, and its value ranges between 0 and 1, with a larger value indicating the better classification performance of the model.
3. Results and discussion
This study obtained the ROC of each model as shown in Fig. 1. One can find out then that the LR model performs the best, whose AUC value is much larger than other models. XGBoost model performs great, since it gets AUC=0.84 which is bigger than 0.8. KNN and SVM are very close in performance, with AUC=0.79. For sensitivity (TPR), a high sensitivity indicates that the model can correctly classify individuals as real cases of diabetes who actually have diabetes (i.e. true cases). This helps to ensure that those patients who really need treatment are diagnosed and treated in a timely manner. As for specificity (1-FPR), high specificity indicates that the model can correctly classify those who do not have the disease (i.e., true negative cases). This helps to reduce unnecessary medical interventions and patient anxiety. The linear model exhibits a very high TPR at almost all FPR levels, suggesting that it is very effective in identifying diabetic patients in a variety of situations. At the same time, the model maintains high specificity at low FPR levels, which means it is very effective in identifying true diabetic patients while reducing misdiagnosis.
The other three models all behave similarly, with a rapid rise followed by a levelling off. They were able to better identify diabetic patients while maintaining a lower misdiagnosis rate. At higher FPR, the curve flattens out, suggesting that a certain amount of accurate identification of the healthy population may be sacrificed in the pursuit of higher confirmation rates. The smoothness of the curve can reflect the stability of the model under different thresholds.
|
|
|
|
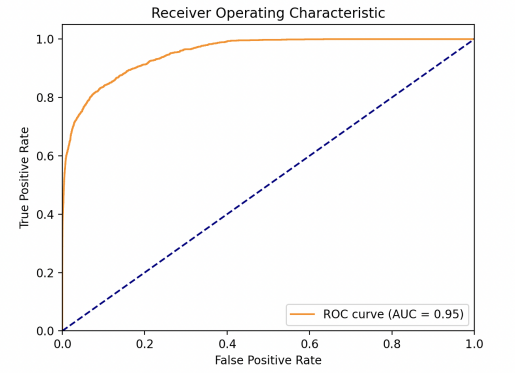
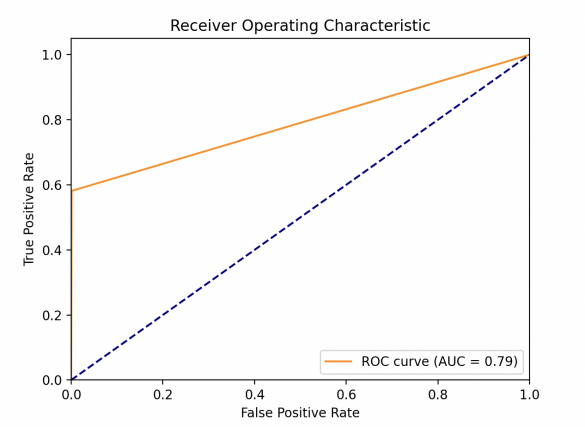
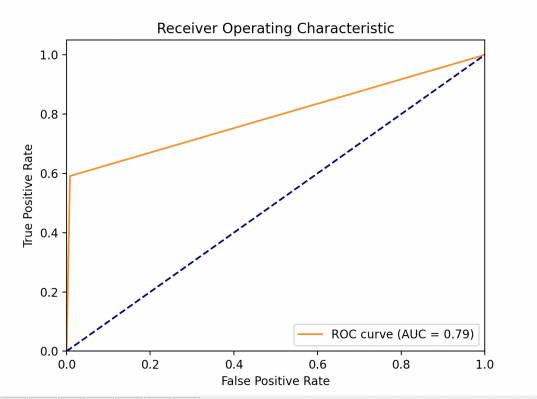
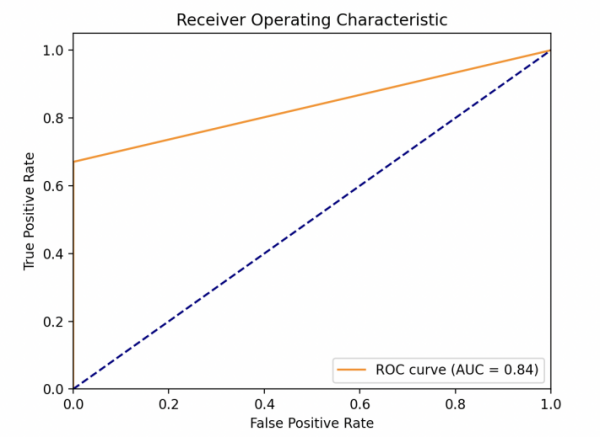
Figure 1. Model performances for LR (left upper), KNN (right upper), (lower left) and XGBoost (lower right) (Photo/Picture credit: Original).
A smooth curve indicates that the model's performance does not change much under different thresholds. IR has a significantly better smoothed curve while the remaining three models all show a more pronounced turnaround. The dataset was derived from Kaggle, and although the sample size is large, it may not be fully representative of the global diversity of people with diabetes. Geographic and population limitations of the data may affect the generalization ability of the model. The model needs to be tested with more clinical data to ensure the validity and reliability of its practical application. The model has various parameters and the way one tunes the parameters in the experiments is to pick a range and then make multiple attempts to pick the parameter with the highest AUC. Such an approach may not be the best result for the model. To optimization, one can:
• Expand data sources to include populations from different geographic regions, ethnicities, and age groups to improve the generalization ability and representativeness of the model. With a large amount of data, the generalization of this model becomes better and better.
• Adopt a more systematic approach to model parameter tuning. Some of the researches are doing the mathematical tasks, aiming to find out the best parameters which can be improved. One can using these methods to make the parameters more reliable.
One also learnt that there is other more ways to optimize the algorithm, model fusion being one of them, which including Boosting, Voting [12]. The former is when a model is trained and another model is used to rectify the prior model's mistakes. While the latter uses multiple models that are fitted and then voted on to get the best result. Model Ensemble improve overall predictive accuracy, stability and generalization by combining predictions from multiple models. Because of using multiple models, the overfitting of a certain model can be prevented, and the method can bring more stability.
4. Conclusion
We utilize multiple machine learning model to do diabetes prediction and compare their performance, demonstrates the potential of these algorithms to identify individuals at risk of diabetes. This study tried KNN, LR, SVM, XGBoost models separately and evaluated their performance based on AUC values. One ends up find out that the linear regression model performs the best with AUC=0.95, and at the same time the model shows the best stability. XGBoost also demonstrated commendable predictive accuracy, showing that it can predict diabetes risk, particularly due to its ability to efficiently handle large-scale datasets. The SVM and KNN models, although with slightly lower AUC values, still provided robust prediction. In the future, one can apply more data in the model, explore more diverse and extensive datasets and boost the generalization capability. Applying more methods like Model Ensemble can significantly improve model performance. Diabetes often has no obvious symptoms in its early stages, and predictive modelling can help detect diabetes early, enabling early diagnosis and intervention. The future of diabetes prediction lies in continually improving existing models and exploring new algorithms that allow these prediction tools to use cutting-edge technology to better predict
References
[1]. Kumar D A and Govindasamy R 2015 Performance and evaluation of classification data mining techniques in diabetes International Journal of Computer Science and Information Technologies vol 6(2) pp 1312-1319
[2]. Larabi-Marie-Sainte S, Aburahmah L, Almohaini R and Saba T 2019 Current techniques for diabetes prediction: review and case study Applied Sciences vol 9(21) p 4604
[3]. Ahola A J and Groop P H 2013 Barriers to self‐management of diabetes Diabetic medicine vol 30(4) pp 413-420
[4]. Sisodia D 2018 Prediction of diabetes using classification algorithms Procedia computer science vol 132 pp 1578-1585
[5]. Gupta S C and Goel N 2020 Performance enhancement of diabetes prediction by finding optimum K for KNN classifier with feature selection method Third International Conference on Smart Systems and Inventive Technology (ICSSIT) pp 980-986
[6]. Islam M M, Ferdousi R, Rahman S and Bushra H Y 2020 Likelihood prediction of diabetes at early stage using data mining techniques Computer vision and machine intelligence in medical image analysis pp 113-125
[7]. Yu W, Liu T, Valdez R, Gwinn M and Khoury M J 2010 Application of support vector machine modeling for prediction of common diseases: the case of diabetes and pre-diabetes BMC medical informatics and decision making vol 10 pp 1-7
[8]. Azrar A, Ali Y, Awais M and Zaheer K 2018 Data mining models comparison for diabetes prediction Int J Adv Comput Sci Appl vol 9(8) pp 320-323
[9]. Lehmann E L and Scheffé H 2011 Completeness similar regions and unbiased estimation-Part I Selected works of EL Lehmann pp 233-268
[10]. Cover T M 1965 Geometrical and statistical properties of systems of linear inequalities with applications in pattern recognition IEEE transactions on electronic computers vol 3 pp 326-334
[11]. Chen T and Guestrin C 2016 Xgboost: A scalable tree boosting system Proceedings of the 22nd acm sigkdd international conference on knowledge discovery and data mining pp 785-794
[12]. Dong X, Yu Z, Cao W, Shi Y and Ma Q 2020 A survey on ensemble learning Frontiers of Computer Science vol 14 pp 241-258
Cite this article
Yang,S. (2024). Diabetes Prediction Based on KNN, XGBoost, SVM and LR model. Applied and Computational Engineering,104,91-95.
Data availability
The datasets used and/or analyzed during the current study will be available from the authors upon reasonable request.
Disclaimer/Publisher's Note
The statements, opinions and data contained in all publications are solely those of the individual author(s) and contributor(s) and not of EWA Publishing and/or the editor(s). EWA Publishing and/or the editor(s) disclaim responsibility for any injury to people or property resulting from any ideas, methods, instructions or products referred to in the content.
About volume
Volume title: Proceedings of the 2nd International Conference on Machine Learning and Automation
© 2024 by the author(s). Licensee EWA Publishing, Oxford, UK. This article is an open access article distributed under the terms and
conditions of the Creative Commons Attribution (CC BY) license. Authors who
publish this series agree to the following terms:
1. Authors retain copyright and grant the series right of first publication with the work simultaneously licensed under a Creative Commons
Attribution License that allows others to share the work with an acknowledgment of the work's authorship and initial publication in this
series.
2. Authors are able to enter into separate, additional contractual arrangements for the non-exclusive distribution of the series's published
version of the work (e.g., post it to an institutional repository or publish it in a book), with an acknowledgment of its initial
publication in this series.
3. Authors are permitted and encouraged to post their work online (e.g., in institutional repositories or on their website) prior to and
during the submission process, as it can lead to productive exchanges, as well as earlier and greater citation of published work (See
Open access policy for details).
References
[1]. Kumar D A and Govindasamy R 2015 Performance and evaluation of classification data mining techniques in diabetes International Journal of Computer Science and Information Technologies vol 6(2) pp 1312-1319
[2]. Larabi-Marie-Sainte S, Aburahmah L, Almohaini R and Saba T 2019 Current techniques for diabetes prediction: review and case study Applied Sciences vol 9(21) p 4604
[3]. Ahola A J and Groop P H 2013 Barriers to self‐management of diabetes Diabetic medicine vol 30(4) pp 413-420
[4]. Sisodia D 2018 Prediction of diabetes using classification algorithms Procedia computer science vol 132 pp 1578-1585
[5]. Gupta S C and Goel N 2020 Performance enhancement of diabetes prediction by finding optimum K for KNN classifier with feature selection method Third International Conference on Smart Systems and Inventive Technology (ICSSIT) pp 980-986
[6]. Islam M M, Ferdousi R, Rahman S and Bushra H Y 2020 Likelihood prediction of diabetes at early stage using data mining techniques Computer vision and machine intelligence in medical image analysis pp 113-125
[7]. Yu W, Liu T, Valdez R, Gwinn M and Khoury M J 2010 Application of support vector machine modeling for prediction of common diseases: the case of diabetes and pre-diabetes BMC medical informatics and decision making vol 10 pp 1-7
[8]. Azrar A, Ali Y, Awais M and Zaheer K 2018 Data mining models comparison for diabetes prediction Int J Adv Comput Sci Appl vol 9(8) pp 320-323
[9]. Lehmann E L and Scheffé H 2011 Completeness similar regions and unbiased estimation-Part I Selected works of EL Lehmann pp 233-268
[10]. Cover T M 1965 Geometrical and statistical properties of systems of linear inequalities with applications in pattern recognition IEEE transactions on electronic computers vol 3 pp 326-334
[11]. Chen T and Guestrin C 2016 Xgboost: A scalable tree boosting system Proceedings of the 22nd acm sigkdd international conference on knowledge discovery and data mining pp 785-794
[12]. Dong X, Yu Z, Cao W, Shi Y and Ma Q 2020 A survey on ensemble learning Frontiers of Computer Science vol 14 pp 241-258