


1. Introduction
Amid the rapid advancement of artificial intelligence technology, AI-generated video tools are becoming increasingly important in digital content creation. According to Leiker et al., these tools lower the technical barriers to video production by automatically generating high-quality video content, thereby facilitating rapid content creation and dissemination [1]. For example, tools such as Lumen5 and Pictory can automatically generate videos from input text, facilitating the creation of professional-quality video content by non-experts [2-4]. However, despite the clear advantages of AI-generated video tools in saving time and enhancing creative expression, their widespread adoption still faces several challenges.
User acceptance and attitudes toward these tools vary significantly depending on individual preferences, technical expertise, and content needs. Therefore, a deeper exploration of user behavior and preferences is essential to further advance these tools. Current research on user behavior and demands related to AI-generated video tools is still in its infancy. The existing literature primarily focuses on technical applications and market analysis, with a lack of in-depth exploration of user psychology and behavior. For example, studies by Zhang and Vayadande et al. mainly focused on market analysis without delving deeply into user habits and attitudes [5, 6].
This study aims to explore user acceptance, usage behavior, and preferences regarding AI-generated video tools through a questionnaire survey and online review analysis. Unlike traditional research that emphasizes the technical aspects, this study focuses more on user experience, aiming to uncover the key factors influencing user behavior and providing a solid basis for tool development and optimization.
In analyzing questionnaire data, Ridge regression is employed to examine the key factors influencing user satisfaction and tool usage. Ridge regression addresses multicollinearity issues effectively and quantifies the impact of various tool characteristics (such as familiarity, usage frequency, and data security concerns) on user satisfaction, thereby identifying main drivers of user behavior [7]. Subsequently, K-means clustering analysis is used to refine user group characteristics, identify different user types, and develop targeted product optimization and market promotion strategies [8].
For online review data, this study utilized keyword extraction, topic modeling (LDA), and sentiment analysis to identify the main opinions and needs of users regarding different AI-generated video tools. Keyword extraction and topic modeling help us understand the core concerns users have about each tool, while sentiment analysis reveals user satisfaction and potential issues [9, 10].
Through an in-depth analysis of user needs and behavior patterns, this study not only expands the theoretical understanding of AI-generated video tools but also provides practical guidance for product development and marketing strategies. These findings will help developers better understand the needs of their target users, optimize product features, and enhance user satisfaction and loyalty, thereby promoting continuous innovation and development of AI-generated video tools in digital content creation.
2. Methodology
2.1. Data sources and description
The data sources for this study include survey data and online review data. The survey data was collected through the Wenjuanxing platform, with a total of 1,535 completed questionnaires, of which 1,527 valid responses were selected for analysis. The questionnaire covered users' basic information (such as age, gender, education level), familiarity with AI-generated video tools, usage frequency, satisfaction, data security concerns, and price acceptance.
All indicators in the questionnaire are categorical data, including age, gender, education level, familiarity, usage frequency, satisfaction, data security concerns, and price acceptance. These categorical data were numerically coded in subsequent analyses and served as the foundational data for Ridge regression and K-means clustering analyses.
Table 1. Overview of survey data.
Feature | Data Type | Description |
Education Level | Ordinal Data | User's highest educational attainment |
Familiarity | Ordinal Data | Familiarity with AI video tools |
Usage Frequency | Ordinal Data | Frequency of using AI video tools |
Satisfaction | Ordinal Data | Satisfaction with AI video tools |
Data Security | Ordinal Data | Concerns about data security |
Price Acceptance | Ordinal Data | Acceptance of tool pricing |
Table 1 presents the types of features included in the survey and provides a brief description of each. Additionally, the online review data were collected from the G2.com website, covering user evaluations of five AI-generated video tools: Animoto, Invideo, Lumen5, Pictory, and Synthesia. These review data provided valuable insights into users' actual experiences, functionality assessments, and satisfaction with each tool. Sentiment analysis and topic modeling (Latent Dirichlet Allocation) were employed to further understand user needs based on these reviews.
2.2. Methodology introduction
This study employed a variety of data analysis methods to comprehensively reveal user behavior patterns and preferences related to AI-generated video tools. The primary methods included Ridge regression analysis, K-means clustering analysis, and natural language processing (NLP)-based sentiment analysis and Latent Dirichlet Allocation (LDA) topic modeling.
2.2.1. Reliability and validity analysis. Before the formal survey, a pilot survey was conducted, collecting a total of 100 questionnaires. The reliability and validity of the questionnaire were analyzed using SPSSAU software. The results indicated that the questionnaire had good reliability (Cronbach's α = 0.735) and validity (KMO value = 0.771, Bartlett's test of sphericity was significant at p < 0.001), effectively measuring users' evaluations of AI-generated video tools (Table 2).
Table 2. Reliability and validity analysis results of the pilot survey.
Analysis Type | Indicator | Result |
Reliability Analysis | Cronbach's \( α \) | 0.735 |
Validity Analysis | KMO Value | 0.771 |
Bartlett's Test | p < 0.001 |
2.2.2. Ridge regression analysis. To identify the key factors influencing user satisfaction, Ridge regression analysis was utilized. Ridge regression helps address multicollinearity issues, allowing us to quantify the impact of various tool characteristics (such as usage frequency, familiarity, and data security concerns) on user satisfaction, thereby determining the primary drivers of user behavior.
2.2.3. K-means clustering analysis. Based on the key variables identified in the Ridge regression analysis, K-means clustering analysis was conducted. By grouping users into different clusters, this study identified distinct user group characteristics, providing a foundation for developing targeted product optimization and marketing strategies.
2.2.4. Sentiment analysis and LDA topic modeling. For the online review data, sentiment analysis and LDA topic modeling were employed. Sentiment analysis was used to evaluate the emotional tone of user reviews, while LDA topic modeling helped extract the core themes from user feedback. These methods allowed for a deeper understanding of specific user needs and opinions regarding AI-generated video tools, offering insights for further product improvement.
2.2.5. Research methodology flowchart. Figure 1 presents the research methodology flowchart, which outlines the key steps undertaken in this study. The flowchart begins with the data collection phase, encompassing both the questionnaire survey and online review data. The data preprocessing steps for both sources are illustrated separately, highlighting the distinct approaches taken for each. The subsequent steps involve Ridge regression analysis and K-means clustering for the questionnaire data, and sentiment analysis and LDA topic modeling for the online review data. Finally, the flowchart demonstrates how these analyses are integrated to form the basis for the study's conclusions and practical applications. This visual representation aids in providing a clear overview of the study’s methodological approach, ensuring that each step is logically connected and contributes to the overall research objectives.
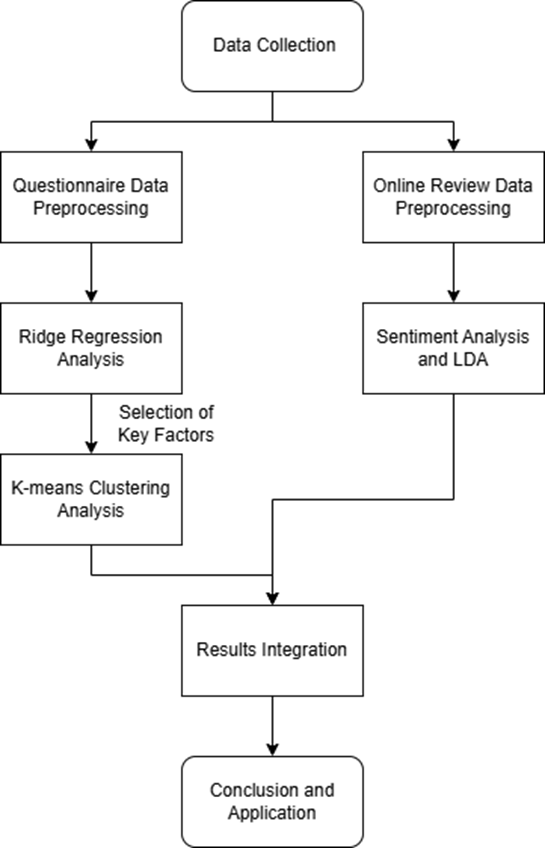
Figure 1. Research methodology flowchart.
3. Result and discussion
3.1. Ridge regression analysis
To identify the primary factors influencing user satisfaction with AI-generated video tools, a Ridge regression analysis was conducted. This method effectively addresses multicollinearity, allowing for precise quantification of each variable's impact on satisfaction. The model yielded a coefficient of determination (R2) of 0.541, indicating that 54.1% of the variability in user satisfaction is explained by the selected variables. This suggests that the model has moderate explanatory power, capturing key factors that influence user satisfaction.
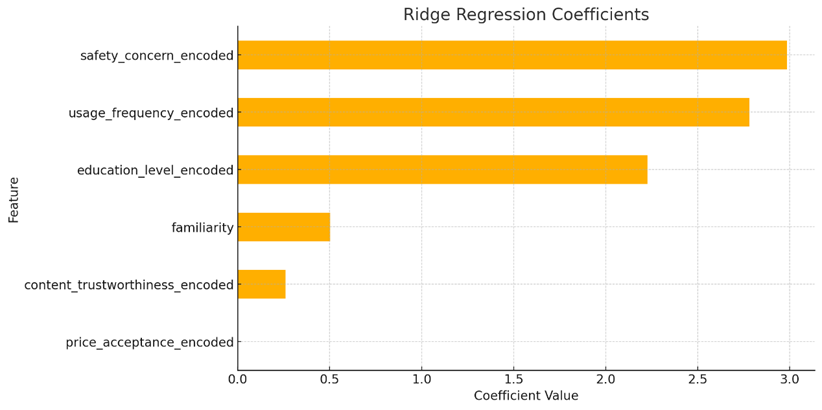
Figure 2. Ridge regression coefficient bar chart.
Table 3. Regression coefficients.
Variable | Regression Coefficient |
Safety Concern | 2.9861 |
Usage Frequency | 2.7809 |
Education Level | 2.2272 |
Familiarity | 0.5036 |
Content Trustworthiness | 0.2597 |
Price Acceptance | 0 |
The regression coefficients in Figure 2 and Table 3 clearly indicate that "Safety Concern" and "Usage Frequency" are the most significant factors influencing user satisfaction with AI-generated video tools. The high coefficients for these variables underscore their importance in shaping how users perceive and evaluate the tools. Specifically, "Safety Concern," with the highest coefficient, highlights the critical role of data security and privacy in user decision-making. Users appear to place significant value on the protection of their personal information and the security features provided by the tools they use, making this a key area for developers to focus on.
Similarly, "Usage Frequency" also emerges as a crucial predictor, suggesting that users who interact more frequently with these tools tend to report higher satisfaction levels. This could be because frequent use fosters familiarity with the tools' features and builds confidence in their capabilities. By encouraging more regular usage, developers may be able to further enhance user satisfaction over time.
In contrast, "Price Acceptance" has a coefficient of zero, indicating that the cost of these tools does not play a significant role in determining user satisfaction. This suggests that users are more concerned with the tools’ performance and security features than with their price, indicating that tool quality and reliability are the primary drivers of satisfaction in this context.
The analysis of residuals further validated the model's robustness. Residuals were approximately normally distributed around the zero line, indicating that the model does not suffer from systematic bias. This was confirmed by both the residual distribution plot (Figure 3) and the Q-Q plot (Figure 4), which supported the assumption of normality in the residuals.
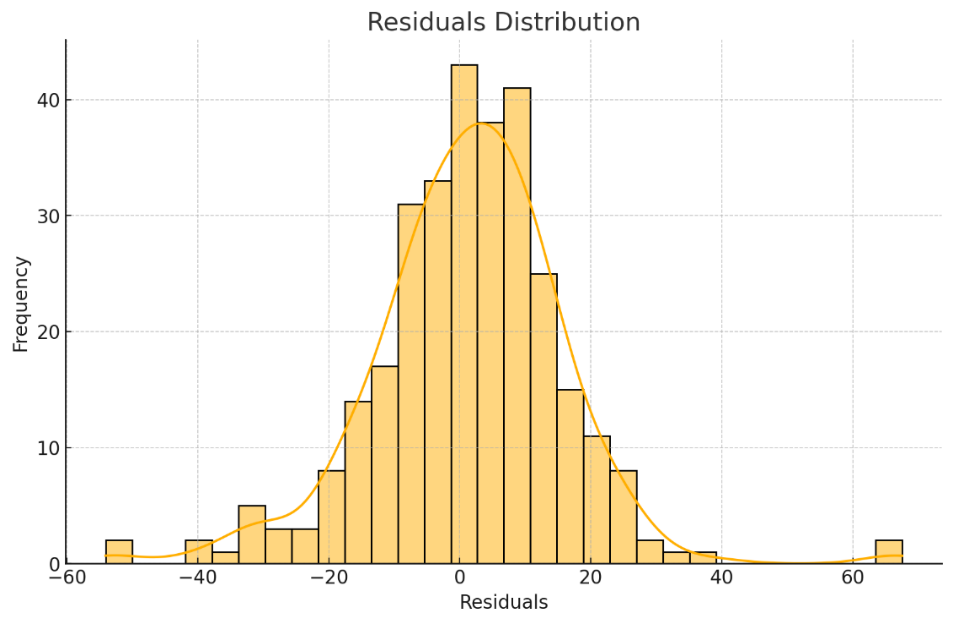
Figure 3. Residual distribution plot.
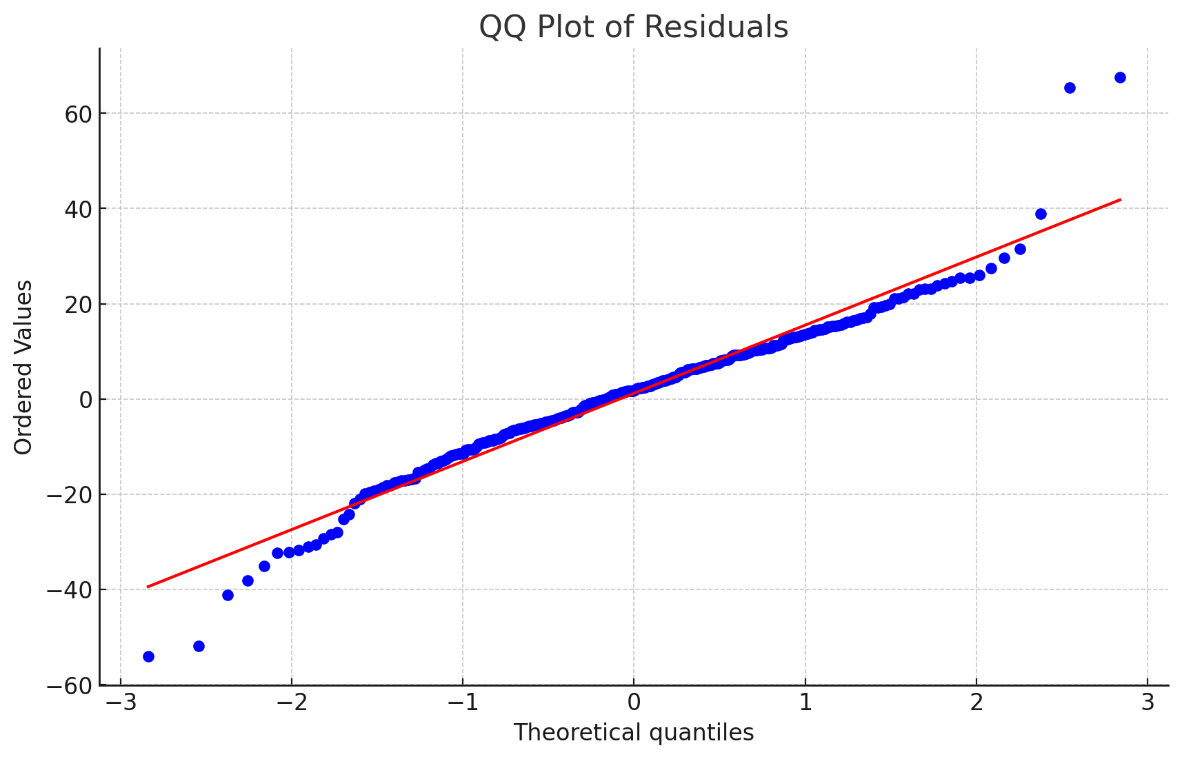
Figure 4. Q-Q plot.
The findings from this regression analysis underscore the importance of increasing usage frequency and enhancing data security features to improve user satisfaction with AI-generated video tools. Furthermore, the significance of familiarity suggests that user education and training could play a pivotal role in boosting satisfaction levels.
3.2. K-means clustering analysis
Building on the key variables identified through Ridge regression, K-means clustering analysis was conducted to classify users into distinct segments. The Elbow Method determined that three clusters were optimal (Figure 5).
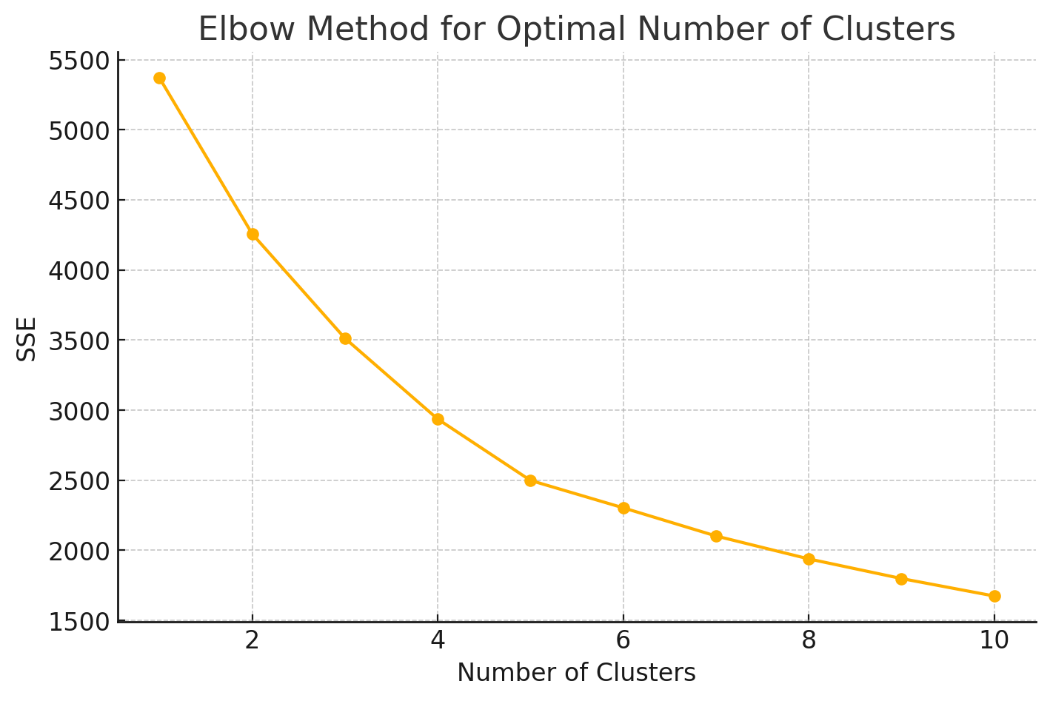
Figure 5. Elbow method for determining the optimal number of clusters.
Table 4. Key characteristics of user segments.
Segment Name | Usage Frequency | Security Concern | Familiarity | Satisfaction | ||
Security Focused | High | Security | Moderate | Low | ||
Functionality-Seeking | Moderate | Functionality | High | High | ||
Casual Users | Low | Basic Use | Low | High |
The K-means clustering revealed three distinct user segments (Table 4). The "Security-Focused" segment is characterized by high security concerns and moderate familiarity, leading to lower satisfaction. The "Functionality-Seeking" segment, with moderate usage frequency and high familiarity, shows the highest satisfaction due to their demand for robust functionality. "Casual Users," who use the tools infrequently and have low familiarity, still report high satisfaction, likely because their needs are basic. These findings provide actionable insights for tailoring product development strategies to each user segment. For example, addressing security concerns for the "Security-Focused" segment or enhancing ease-of-use for "Casual Users" could significantly boost overall satisfaction.
3.3. Analysis of online reviews
In addition to survey analysis, this study examined online reviews for five AI-generated video tools: Animoto, Invideo, Lumen5, Pictory, and Synthesia. Sentiment analysis, keyword extraction, and LDA topic modeling were used to identify user opinions and preferences.
Table 5. Overall rating table.
Tool Name | Ease of Use | Functionality | Number of Templates | User Satisfaction | Negative Sentiment Ratio |
Animoto | 4.3 | 3.8 | 4 | 4.2 | 0.08 |
Invideo | 4.5 | 4.3 | 4.1 | 4.4 | 0.1 |
Lumen5 | 4.2 | 4.1 | 3.9 | 4 | 0.12 |
Pictory | 3.9 | 3.7 | 3.8 | 3.8 | 0.18 |
Synthesia | 4.4 | 4.2 | 4 | 4.5 | 0.1 |
From Table 5, there are certain differences in the performance of various AI-generated video tools across different dimensions. Invideo and Synthesia excel in ease of use and user satisfaction, scoring high marks of 4.5 and 4.4, respectively, indicating that users have had a positive experience with these tools. Additionally, Invideo received the highest score in functionality richness, reaching 4.3, suggesting that it has a significant advantage in feature diversity. Animoto and Synthesia received relatively high scores for the number of templates available, both scoring 4.0, indicating that they provide users with a wide variety of template options. However, Pictory performed poorly across several dimensions, particularly in the proportion of negative sentiment, which reached 0.18, reflecting a higher level of user dissatisfaction.
Table 6. Usage scenario preference table.
Tool Name | Social Media Content Creation | Marketing Video Production | Education & Training | Internal Corporate Communication | Personal Creation |
Animoto | 19.50% | 43.40% | 10.60% | 17.70% | 8.80% |
Invideo | 19.50% | 43.90% | 17.70% | 12.80% | 6.10% |
Lumen5 | 34.50% | 31.60% | 4.50% | 6.80% | 22.60% |
Pictory | 20.40% | 31.10% | 18.40% | 6.80% | 23.30% |
Synthesia | 3.30% | 26.70% | 30.10% | 33.40% | 6.50% |
Table 6 further reveals the applicability of each tool in specific usage scenarios. Lumen5 stands out in the field of social media content creation, capturing 34.5% of user preference, indicating its widespread use in short video and social media content production. For marketing video creation, Invideo and Animoto are the preferred tools, with preference rates of 43.9% and 43.4%, respectively. In the education and training scenario, Synthesia leads with a preference rate of 30.1%, making it particularly suitable for educational videos that require AI and role-playing features. Synthesia also excels in corporate internal communication, with a high preference rate of 33.4%. For personal creation, Pictory and Lumen5 are relatively more popular, with preference rates of 23.3% and 22.6%, respectively.
In summary, these analysis results not only highlight the significant differences in user experience, functional characteristics, and suitability for various use cases among different AI-generated video tools but also provide valuable reference points for users in selecting the most appropriate tool. For developers, these findings indicate key areas for future improvement and optimization, particularly where user experience is lacking or where negative feedback is prevalent. By continuously enhancing product features and improving user experience, these tools are likely to achieve higher user satisfaction and broader adoption in the future market.
3.4. Integrated analysis
Integrating the user segmentation results with the analysis of tool performance offers valuable insights into how different tools cater to specific user needs. The Security-Focused segment, which prioritizes data security, finds Synthesia to be a suitable tool due to its strong security features and overall high satisfaction scores. Conversely, Pictory, which has a higher negative sentiment and lower satisfaction, does not meet the stringent security and performance requirements of this segment.
For the Functionality-Seeking segment, which demands advanced features and functionalities, Invideo emerges as a leading choice. Its high ratings in functionality and overall satisfaction align well with the needs of this user group. Lumen5, while also strong in functionality, excels particularly in social media content creation, making it a good fit for users who require specialized features in this area.
Casual Users, who have basic needs, benefit from tools that offer simplicity and ease of use. Animoto and Pictory are well-suited to this segment. Animoto is favored for its user-friendly interface, while Pictory, despite its lower scores in other areas, still caters to casual users with its straightforward features.
Overall, these findings suggest that developers should focus on enhancing security features for the Security-Focused segment, expanding functionality for the Functionality-Seeking segment, and simplifying interfaces for Casual Users. By aligning tool development and marketing strategies with these insights, developers can better meet the diverse needs of users and improve overall satisfaction.
4. Conclusion
This study investigated user behavior, satisfaction, and preferences concerning AI-generated video tools by analyzing both survey data and online reviews. The Ridge regression analysis highlighted that usage frequency and data security concerns are the primary determinants of user satisfaction, with familiarity and education level also playing significant roles. These findings suggest that users prioritize tool performance and security over cost, and that increased usage frequency is associated with higher satisfaction.
The K-means clustering analysis identified three distinct user segments: Security-Focused, Functionality-Seeking, and Casual Users. The Security-Focused segment, which emphasizes data security, is less satisfied with tools that fail to address these concerns. Conversely, the Functionality-Seeking segment, which values advanced features, reports the highest levels of satisfaction with tools that offer comprehensive functionalities. Casual Users, who use the tools less frequently and have basic needs, demonstrate high satisfaction with user-friendly tools.
Analysis of online reviews, including sentiment analysis and LDA topic modeling, further supports these insights. Lumen5 stands out for its effectiveness in social media content creation, while Pictory is noted for its lower user satisfaction and higher negative sentiment. Invideo and Synthesia are praised for their functionality and overall user satisfaction, aligning with the needs of Functionality-Seeking users. Animoto is preferred for its ease of use, catering well to Casual Users.
The results of this study suggest that developers should focus on enhancing features related to usage frequency and data security to boost user satisfaction. Additionally, adopting tailored strategies for each user segment—such as improving security for Security-Focused users, expanding functionalities for Functionality-Seeking users, and simplifying interfaces for Casual Users—can help address diverse user needs more effectively.
While the study offers valuable insights, it is limited by the scope of the sample and review data. Future research should aim to include a broader range of data to provide a more comprehensive analysis.
In conclusion, this study provides important insights into user preferences and behaviors regarding AI-generated video tools. The findings offer actionable recommendations for developers to enhance tool features and user experience, thereby fostering continued innovation and higher user satisfaction in this dynamic field.
References
[1]. Leiker D, Gyllen A R, Eldesouky I and Cukurova M 2023 Generative AI for learning: Investigating the potential of synthetic learning videos. Working paper.
[2]. Isler M, Yesilbel B R, Santos V and Bacalhau L M 2023 Usage of Artificial Intelligence for Advertising Creation for Social Media Marketing: ChatGPT Combined with Pictory and DALL· E. In International Conference on Marketing and Smart Technologies, Springer Nature,73-85.
[3]. Kaur G, Kaur A and Khurana M 2024 A Survey of Computational Techniques for Automated Video Creation and their Evaluation. 2024 11th International Conference on Reliability, Infocom Technologies and Optimization (Trends and Future Directions) (ICRITO), 1-6.
[4]. Nuramila N, et al. 2024 Pembuatan Media Pembelajaran Berbasis Virtual Assistant Pictory & Fliki AI (Artificial Intelligence) Di SMP Negeri 6 Kota Gorontalo. Jurnal Pengabdian Bersama Masyarakat Indonesia, 2(1), 55-65.
[5]. Vayadande K, Bohri M, Chawala M, Kulkarni A M and Mursal A 2024 The Rise of AI-Generated News Videos: A Detailed Review. How Machine Learning is Innovating Today's World: A Concise Technical Guide, 423-451.
[6]. Zhang X 2023 How does AI-generated voice affect online video creation: evidence from TikTok. Doctoral dissertation, University of British Columbia.
[7]. Arashi M, Roozbeh M, Hamzah N A and Gasparini M 2021 Ridge regression and its applications in genetic studies. Plos one, 16(4), e0245376.
[8]. Chi D 2021 Research on the Application of K-Means Clustering Algorithm in Student Achievement. 2021 IEEE International Conference on Consumer Electronics and Computer Engineering (ICCECE), 435-438.
[9]. Barik K and Misra S 2024 Analysis of customer reviews with an improved VADER lexicon classifier. Journal of Big Data, 11(1), 10.
[10]. Rishu K V 2024 Comic exploration and Insights: Recent trends in LDA-Based recognition studies. Expert Systems with Applications, 255, 124732.
Cite this article
Hu,Y. (2024). User Behavior and Satisfaction in AI-Generated Video Tools: Insights from Surveys and Online Comments. Applied and Computational Engineering,94,136-145.
Data availability
The datasets used and/or analyzed during the current study will be available from the authors upon reasonable request.
Disclaimer/Publisher's Note
The statements, opinions and data contained in all publications are solely those of the individual author(s) and contributor(s) and not of EWA Publishing and/or the editor(s). EWA Publishing and/or the editor(s) disclaim responsibility for any injury to people or property resulting from any ideas, methods, instructions or products referred to in the content.
About volume
Volume title: Proceedings of CONF-MLA 2024 Workshop: Securing the Future: Empowering Cyber Defense with Machine Learning and Deep Learning
© 2024 by the author(s). Licensee EWA Publishing, Oxford, UK. This article is an open access article distributed under the terms and
conditions of the Creative Commons Attribution (CC BY) license. Authors who
publish this series agree to the following terms:
1. Authors retain copyright and grant the series right of first publication with the work simultaneously licensed under a Creative Commons
Attribution License that allows others to share the work with an acknowledgment of the work's authorship and initial publication in this
series.
2. Authors are able to enter into separate, additional contractual arrangements for the non-exclusive distribution of the series's published
version of the work (e.g., post it to an institutional repository or publish it in a book), with an acknowledgment of its initial
publication in this series.
3. Authors are permitted and encouraged to post their work online (e.g., in institutional repositories or on their website) prior to and
during the submission process, as it can lead to productive exchanges, as well as earlier and greater citation of published work (See
Open access policy for details).
References
[1]. Leiker D, Gyllen A R, Eldesouky I and Cukurova M 2023 Generative AI for learning: Investigating the potential of synthetic learning videos. Working paper.
[2]. Isler M, Yesilbel B R, Santos V and Bacalhau L M 2023 Usage of Artificial Intelligence for Advertising Creation for Social Media Marketing: ChatGPT Combined with Pictory and DALL· E. In International Conference on Marketing and Smart Technologies, Springer Nature,73-85.
[3]. Kaur G, Kaur A and Khurana M 2024 A Survey of Computational Techniques for Automated Video Creation and their Evaluation. 2024 11th International Conference on Reliability, Infocom Technologies and Optimization (Trends and Future Directions) (ICRITO), 1-6.
[4]. Nuramila N, et al. 2024 Pembuatan Media Pembelajaran Berbasis Virtual Assistant Pictory & Fliki AI (Artificial Intelligence) Di SMP Negeri 6 Kota Gorontalo. Jurnal Pengabdian Bersama Masyarakat Indonesia, 2(1), 55-65.
[5]. Vayadande K, Bohri M, Chawala M, Kulkarni A M and Mursal A 2024 The Rise of AI-Generated News Videos: A Detailed Review. How Machine Learning is Innovating Today's World: A Concise Technical Guide, 423-451.
[6]. Zhang X 2023 How does AI-generated voice affect online video creation: evidence from TikTok. Doctoral dissertation, University of British Columbia.
[7]. Arashi M, Roozbeh M, Hamzah N A and Gasparini M 2021 Ridge regression and its applications in genetic studies. Plos one, 16(4), e0245376.
[8]. Chi D 2021 Research on the Application of K-Means Clustering Algorithm in Student Achievement. 2021 IEEE International Conference on Consumer Electronics and Computer Engineering (ICCECE), 435-438.
[9]. Barik K and Misra S 2024 Analysis of customer reviews with an improved VADER lexicon classifier. Journal of Big Data, 11(1), 10.
[10]. Rishu K V 2024 Comic exploration and Insights: Recent trends in LDA-Based recognition studies. Expert Systems with Applications, 255, 124732.