


1. Introduction
Predicting stock prices is always a topic of great interest because it holds the key to wealth [1]. Some people believe that there are some connections between these prices, so they tried various type of tools and analysis indicators with the hope to capture the trend of the price movement. However, this is also a particularly challenging task because of the large chaos and complexity of the stock prices data, only a few individuals and models can achieve success in the market. With the rapid advancement of technology, particularly in the field of machine learning, there is an increasing optimism regarding the potential to leverage data-driven methodologies to improve the accuracy of stock price predictions. With the rise of quantitative trading in these years, machine learning has already been extremely popular in the financial market, algorithms like Random Forest emerge as a powerful tool for such predictions [2].
This paper will focus on the usage of Random Forest, a typical machine learning algorithm that is one of the famous examples of ensemble learning, and use the Random Forest model to predict the stock prices. The Random Forest model was chosen for this task because of its ability to handle large datasets with complex relationships and various features, as well as its effectiveness in alleviating overfitting issues, which makes it suitable for analyzing stock price data. When creating the model, this paper is going to introduce several key technical indicators into the Random Forest model as features, such as Simple Moving Average (SMA), Exponential Moving Average (EMA), Relative Strength Index (RSI), Bolling band, Moving Average Convergence Divergence (MACD) and Stochastic Oscillators [2]. By integrating these indicators, we can generate a Random Forest model that not only captures the major trends in stock prices but also succeeds in improving the accuracy of forecasts.
To evaluate the performance of the Random Forest model, we will use a number of statistical metrics and compare them with simple linear regression models to help us visualize the accuracy of the model, such as Root Mean Square Error (RMSE) and Mean Absolute Percentage Error (MAPE) [3]. These indicators will provide us with a rigorous assessment of the quality of the model's predictions [1]. In addition, we will develop an investment strategy and use the prediction results generated by the Random Forest model constructed above and simple linear regression to apply it to the market, then use the Return on Investment (ROI) of each model to give us further insight into the practical performance of the model in trading [4].
Through this method, a model based on the Random Forest algorithm can be formed successfully, and its performance can be comprehensively evaluated.
2. Methodology and Analysis
2.1. Data Processing and Feature Selection
Data Collection and Preparation:
The historical stock price data for NVIDIA is downloaded from Yahoo Finance, ranging from 2000 to 2019. The headlines of the dataset of NVIDIA will be shown below. For model training, the data from 2000 to 2018 is used and subsequently tested the strategy based on the model on the 2019 data.
## Date Open High Low Close Adj.Close Volume
## 1 2000-01-03 0.098438 0.099219 0.091927 0.097526 0.089453 300912000
## 2 2000-01-04 0.095833 0.096094 0.090104 0.094922 0.087065 300480000
## 3 2000-01-05 0.092188 0.093750 0.090495 0.091797 0.084199 188352000
## 4 2000-01-06 0.091797 0.091797 0.082292 0.085807 0.078705 120480000
## 5 2000-01-07 0.085417 0.088151 0.084115 0.087240 0.080019 71184000
## 6 2000-01-10 0.087500 0.093750 0.085938 0.090104 0.082646 239856000
Incorporation of SMA and EMA:
The EMA and SMA are both popular indicators that are used to smooth the data, they can help us capture the trend of the price movement [2].
Calculation of SMA:
The formula for an n-day SMA is:
\( {SMA_{n}}=\frac{{P_{1}}+{P_{2}}+…+{P_{n}}}{n}\ \ \ (1) \)
Where:
- \( {P_{1}},{P_{2}},…,{P_{n}} \) are the closing prices over the last n days.
- n is the number of days.
This calculation would be repeated across the whole dataset, and SMA3, SMA7, SMA10, and SMA20 will be calculated respectively.
The SMA gives equal weight to all data points in its period, offering a more stable view of the trend and it is also very easy to compute.
The EMA is also a technical indicator that is used to smooth the price data, by giving more weight to recent prices, the indicator can be more responsive to recent market changes. It is calculated using:
\( {EMA_{t}}={P_{t}}×\frac{2}{n+1}+{EMA_{t-1}}×(1-\frac{2}{n+1})\ \ \ (2) \)
Similarly, the EMA will be calculated for 3, 7, 10, 20 days.
Advantages of Using Both in Random Forest:
- Diverse Perspectives: Combining SMA and EMA in the model can help us capture both short-term price movements (EMA) and long-term trends (SMA), making the model to be more comprehensive.
- Enhanced Predictive Power: The combination of sensitivity (EMA) and stability (SMA) enhances the ability of the Random Forest model to identify nuanced patterns, which may improve prediction accuracy.
2.2. Technical Indicators Used
2.2.1. RSI. RSI (Relative Strength Index) The formula of RSI is shown below:
\( RSI=100-\frac{100}{1+RS}\ \ \ (3) \)
Where RS is the average gain of rising periods during a specified number of days divided by the average loss of decreasing periods.
This article is going to use a 14-period RSI, which is also a common choice. The RSI values range from 0 to 100. An RSI exceeding 70 usually indicates the overbought conditions, whereas a value falling below 30 suggests potential oversold conditions [2].
2.2.2. Bollinger Bands. Bollinger Bands are one of the technical analysis tools, which consists of three lines plotted on a price chart:
1. Middle Band: This is typically a 20-period Simple Moving Average (SMA) of the price.
2. Upper Band: This is the Middle Band plus two standard deviations of the price.
3. Lower Band: This is the Middle Band minus two standard deviations of the price.
The bands fluctuate in size in response to changes in the market. When the stock price is turbulent, the bands will go wider, and when the price of the stock enters a steady phase, they will get smaller. They are particularly helpful in the model for capturing volatility and possible price reversals.
2.2.3. Moving Average Convergence Divergence. MACD is widely used in identifying the changes in the strength, direction, momentum, and duration of the price trend [2].
2.2.4. Stochastic Oscillator. The Stochastic Oscillator follows the momentum of the stock prices by measuring the closing price in relation to the maximum and minimum prices over a specified period, providing insights into price momentum, thereby assisting in predicting future price trends and providing us with overbuy/oversold signals [2].
2.3. Building the Random Forest Model
Random Forest is a well-known example of machine learning, that is based on decision trees. While a single decision tree might go overboard and overfit to the data, basically getting too specific and catching on to noise, Random Forest addresses this issue by constructing multiple decision trees, and each tree is trained by a random subset sampled with replacement of both the entire dataset and its features [5]. Below are some key principles of Random Forest:
Bootstrap Aggregation (Bagging): Random Forest uses a technique called bagging, where each tree in the forest is trained by a different random subset of the training data, that is created by sampling with replacement, this technique helps to reduce variance, meaning the model is less likely to get thrown off by quirks in the data.
Feature Randomness: At each split in the decision tree, a random subset of features will be selected, and in the classification process, features are chosen based on criteria like Entropy or Gini impurity, helping the trees figure out the best splits [5], the feature randomness helps to form trees with low similarity, and various decision trees will contribute to the prevention of overfitting.
Decision-Making: Random Forest is a famous example of ensemble learning, the final prediction of the Random Forest is an aggregation of entire set of the predictions from all the individual trees, so the Random Forest is very comprehensive [5].
The article doesn’t dive into the fundamental theorem of Random Forest, what’s most important to know is that it’s a solid tool for avoiding overfitting and improving predictive accuracy. The article is going to use the randomForest package in R to create the Random Forest model [6].
2.4. Evaluating the model
2.4.1. RMSE. The RMSE is a common way to evaluate the precision of the model, which takes a look over the difference between the prediction and the true value, the formula is shown below,
\( RMSE=\sqrt[]{\frac{1}{n}\sum _{i=1}^{n}{({y_{i}}-\hat{{y_{i}}})^{2}}}\ \ \ (4) \)
Where:
- n is the number of observations,
- \( {y_{i}} \) is the i th observation(data),
- \( \hat{{y_{i}}} \) is the predicted value for the i th observation.
Where the \( |{y_{i}}-\hat{{y_{i}}}| \) is the residuals, if the RMSE is low, then we regard it as a good model. In order to evaluate the performance better, the simple linear regression will be used to compare with the Random Forest model, enabling the determination of whether it is a superior model [7].
2.4.2. MAPE. The MAPE is also a fashionable indicator that used to examine the precision of the model, which measures the size of the error in percentage terms, the formula is shown below,
\( MAPE=\frac{1}{n}\sum _{i=1}^{n}|\frac{{y_{i}}-\hat{{y_{i}}}}{{y_{i}}}|×100\%\ \ \ (5) \)
Where:
- n is the number of observations,
- \( {y_{i}} \) is the i th observation(data),
- \( \hat{{y_{i}}} \) is the predicted value for the i th observation.
A lower MAPE value indicates the model has a better accuracy, while a higher MAPE means the model has a lower precision [3].
Similarly, the comparison of MAPE will be taken between the Random Forest model and the simple linear regression model in order to decide whether it is a better model [8].
2.4.3. The strategy and its ROI. The performance on the stock market will also be an important criterion of the model. A strategy based on the simple linear regression and the Random Forest model is going to be generated to determine whether the Random Forest model will assist investors in gaining more fortune on the stock market. Since the closing price of n+1 days is being predicted, and first the model is trained by the data of each company's stock from 2010 to 2018, then the strategy will be designed as follows: Each account will initially possess a total of $10,000,
Trading Strategy:
1. Buy Signal: When the model predicts the price will increase by more than 1% on the following day, purchase the stock at the adjusted closing price.
2. Sell Signal: To simplify the model, the following methods will be used. When the model predicts that the price will decrease the next day, the asset is sold at the adjusted closed price.
Risk Management with Stop-Loss and Take-Profit:
1. Stop-Loss: If the stock price decreases by more than a set percentage (e.g., 5%) from the purchase price, sell to limit losses.
2. Take-Profit: If the stock price increases by more than a set percentage (e.g., 10%) from the purchase price, sell to secure profits.
Partial selling:
When the account is going to sell, only 50% of the current shares are going to be sold instead of all shares. The number of shares to be sold is calculated as shares_to_sell <- rf_shares * 0.5 for both the prediction-based sell signal and the stop-loss/take-profit logic, thereby contributing to a reduction in risks.
Then the model will be used to trade by the strategy above in the dataset from 2019-2020, to see which model will be better.
ROI Calculation In order to simplify the experiment, we are going to ignore the transaction cost in trade.
\( ROI=\frac{Profit}{Investment Amount}×100\%\ \ \ (6) \)
Total ROI: The total ROI over the whole period will be calculated as a key indicator of model performance.
Based on the above experiment, each model's ROI can be compared to decide whether the Random Forest model will be better and ideal for stock price prediction [4].
3. Results
3.1. Model Evaluation (RMSE, MAPE)
library(quantmod)
library(TTR)
library(randomForest)
## [1] "Random Forest RMSE (Close): 0.012109001578224"
## [1] "Random Forest MAPE (Close): 0.510935932636761"
## [1] "Linear Regression RMSE (SMA20, Close): 0.11310753986673"
## [1] "Linear Regression MAPE (SMA20, Close): 6.92121506586462"
##
## Call:
## randomForest(formula = Close ~ SMA3_nvidia + SMA7_nvidia + SMA10_nvidia + SMA20_nvidia + EMA3_nvidia + EMA7_nvidia + EMA10_nvidia + EMA20_nvidia + RSI14_nvidia + BB_upper_nvidia + BB_lower_nvidia + MACD_nvidia + MACD_signal_nvidia + Stochastic_nvidia, data = nvidia_data, importance = TRUE, proximity = TRUE)
## Type of random forest: regression
## Number of trees: 500
## No. of variables tried at each split: 4
##
## Mean of squared residuals: 0.0008147067
## % Var explained: 99.96
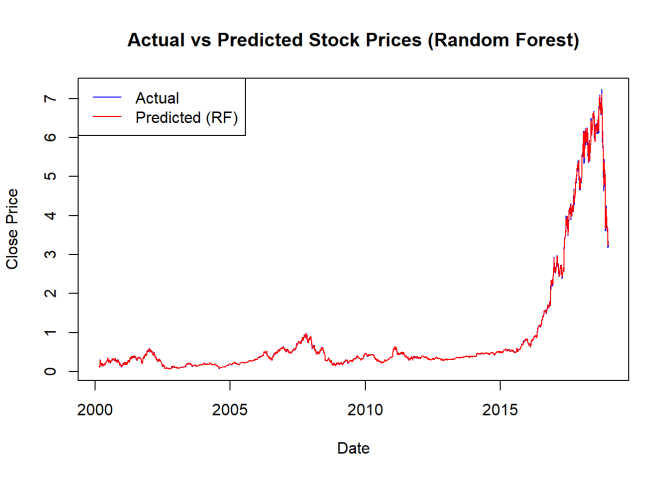
Figure 1. Actual vs Predicted Stock Prices (Random Forest)
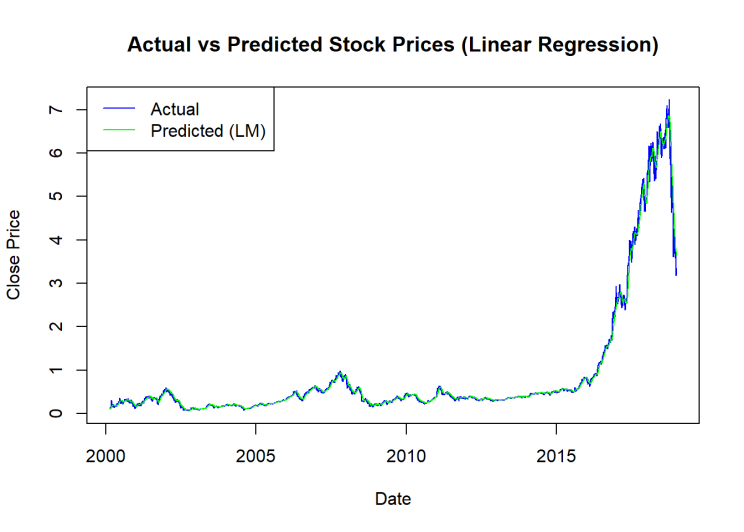
Figure 2. Actual vs Predicted Stock Prices (Linear Regression)
It is evident from Figures 1 and 2 that both models provide accurate stock price predictions. Also, it can be noted that the RMSE and MAPE of the Random Forest model are much lower than those of the simple linear regression model, showing that the Random Forest model has a higher performance than the basic linear regression model. This suggests that the stock forecast can benefit from the Random Forest model's use to improve accuracy.
3.2. Strategy Implementation and ROI
## [1] "Total ROI for Random Forest (with partial selling): 46.2067371330331 %"
## [1] "Total ROI for Linear Regression (with partial selling): 5.38757130147995 %"
During the 2019-2020 period, the performance of the Random Forest model was notably impressive. The Random Forest model achieved a return rate of approximately 46.21%, which is significantly higher than the ROI of the linear regression model, which stood at only about 5.39%. This suggests that the Random Forest model is a suitable approach for application in the stock market. It has the potential to enhance our ability to predict stock prices with greater accuracy, thereby facilitating increased profitability.
4. Conclusion
Overall, the historical data continues to demonstrate Random Forest's potent ability to identify intricate patterns and dependencies in stock price movements. It also demonstrates the model's somewhat increased accuracy and profitability, indicating that Random Forest can be effectively applied in the stock market. Another well-liked development in stock trading will be the application of machine learning concepts.
The Random Forest model still has a great deal of potential for improved performance in stock price prediction, which has not yet been shown in this article. Additionally, by using techniques like grid search with cross-validation, adding more indicators from different aspects into the model can facilitate the identification of optimal model settings and generate a more precise model.
Furthermore, the trading strategy presented in this article is relatively simple, more comprehensive trading approach could potentially yield a higher ROI than what can be achieved through the Random Forest method.
References
[1]. Hu, Z., Zhao, Y., & Khushi, M. (2021). A survey of forex and stock price prediction using deep learning. Applied System Innovation, 4(1), 9. https://doi.org/10.3390/asi4010009
[2]. Khaidem, L., Saha, S., & Dey, S. R. (2016). Predicting the direction of stock market prices using random forest. arXiv preprint arXiv:1605.00003. https://doi.org/10.48550/arXiv.1605.00003
[3]. Vijh, M., Chandola, D., Tikkiwal, V. A., & Kumar, A. (2020). Stock closing price prediction using machine learning techniques. Procedia Computer Science, 167, 599-606. https://doi.org/10.1016/j.procs.2020.03.326
[4]. Jacobson, R. (1987). The validity of ROI as a measure of business performance. The American Economic Review, 77(3), 470-478. https://www.jstor.org/stable/1814548
[5]. Sarica, A., Cerasa, A., & Quattrone, A. (2017). Random forest algorithm for the classification of neuroimaging data in Alzheimer's disease: A systematic review. Frontiers in Aging Neuroscience, 9, 329. https://doi.org/10.3389/fnagi.2017.00329
[6]. Wright, M. N., & Ziegler, A. (2015). Ranger: A fast implementation of random forests for high dimensional data in C++ and R. arXiv preprint arXiv:1508.04409. https://doi.org/10.48550/arXiv.1508.04409
[7]. Chai, T., & Draxler, R. R. (2014). Root mean square error (RMSE) or mean absolute error (MAE)?–Arguments against avoiding RMSE in the literature. Geoscientific Model Development, 7(3), 1247-1250. https://doi.org/10.5194/gmd-7-1247-2014
[8]. Emioma, C. C., & Edeki, S. O. (2021). Stock price prediction using machine learning on least-squares linear regression basis. Journal of Physics: Conference Series, 1734(1), 012045. https://doi.org/10.1088/1742-6596/1734/1/012045
Cite this article
Sun,Z. (2024). The Approaches to Predict Stock Prices by Random Forest. Applied and Computational Engineering,96,162-168.
Data availability
The datasets used and/or analyzed during the current study will be available from the authors upon reasonable request.
Disclaimer/Publisher's Note
The statements, opinions and data contained in all publications are solely those of the individual author(s) and contributor(s) and not of EWA Publishing and/or the editor(s). EWA Publishing and/or the editor(s) disclaim responsibility for any injury to people or property resulting from any ideas, methods, instructions or products referred to in the content.
About volume
Volume title: Proceedings of the 2nd International Conference on Machine Learning and Automation
© 2024 by the author(s). Licensee EWA Publishing, Oxford, UK. This article is an open access article distributed under the terms and
conditions of the Creative Commons Attribution (CC BY) license. Authors who
publish this series agree to the following terms:
1. Authors retain copyright and grant the series right of first publication with the work simultaneously licensed under a Creative Commons
Attribution License that allows others to share the work with an acknowledgment of the work's authorship and initial publication in this
series.
2. Authors are able to enter into separate, additional contractual arrangements for the non-exclusive distribution of the series's published
version of the work (e.g., post it to an institutional repository or publish it in a book), with an acknowledgment of its initial
publication in this series.
3. Authors are permitted and encouraged to post their work online (e.g., in institutional repositories or on their website) prior to and
during the submission process, as it can lead to productive exchanges, as well as earlier and greater citation of published work (See
Open access policy for details).
References
[1]. Hu, Z., Zhao, Y., & Khushi, M. (2021). A survey of forex and stock price prediction using deep learning. Applied System Innovation, 4(1), 9. https://doi.org/10.3390/asi4010009
[2]. Khaidem, L., Saha, S., & Dey, S. R. (2016). Predicting the direction of stock market prices using random forest. arXiv preprint arXiv:1605.00003. https://doi.org/10.48550/arXiv.1605.00003
[3]. Vijh, M., Chandola, D., Tikkiwal, V. A., & Kumar, A. (2020). Stock closing price prediction using machine learning techniques. Procedia Computer Science, 167, 599-606. https://doi.org/10.1016/j.procs.2020.03.326
[4]. Jacobson, R. (1987). The validity of ROI as a measure of business performance. The American Economic Review, 77(3), 470-478. https://www.jstor.org/stable/1814548
[5]. Sarica, A., Cerasa, A., & Quattrone, A. (2017). Random forest algorithm for the classification of neuroimaging data in Alzheimer's disease: A systematic review. Frontiers in Aging Neuroscience, 9, 329. https://doi.org/10.3389/fnagi.2017.00329
[6]. Wright, M. N., & Ziegler, A. (2015). Ranger: A fast implementation of random forests for high dimensional data in C++ and R. arXiv preprint arXiv:1508.04409. https://doi.org/10.48550/arXiv.1508.04409
[7]. Chai, T., & Draxler, R. R. (2014). Root mean square error (RMSE) or mean absolute error (MAE)?–Arguments against avoiding RMSE in the literature. Geoscientific Model Development, 7(3), 1247-1250. https://doi.org/10.5194/gmd-7-1247-2014
[8]. Emioma, C. C., & Edeki, S. O. (2021). Stock price prediction using machine learning on least-squares linear regression basis. Journal of Physics: Conference Series, 1734(1), 012045. https://doi.org/10.1088/1742-6596/1734/1/012045