


1. Introduction
Rapid urbanization has intensified traffic congestion, creating significant challenges for cities globally. This congestion frequently leads to accidents, impacting public safety, economic output, and social well-being. Economic losses arise from reduced productivity, high medical costs, and infrastructure repairs. Furthermore, the pollution generated by heavy traffic degrades urban life quality, contributing to various environmental and health concerns [1].
In highly populated zones like Midtown Manhattan, increasing traffic volume and persistent congestion create chronic gridlock and associated issues. The dense vehicle flow makes this area ideal for analyzing traffic dynamics. Rising traffic volume heightens accident risks, putting pressure on safety and healthcare systems. Midtown's high number of commuters also causes substantial economic losses due to decreased productivity and high fuel costs. Additionally, congestion worsens air quality, causing health issues linked to pollutants like PM2.5. Adaptive Traffic Signals (ATS) help manage these challenges by moderating traffic flow and reducing accident rates [2], [3].
In New York City, ATS was implemented as part of the Midtown in Motion project. ATS aims to dynamically adjust traffic light timings based on real-time traffic conditions, alleviating congestion, especially during peak hours. The system integrates sensors, cameras, and adaptive decision-making to create a smoother traffic flow. Initiated in 2011, the Midtown in Motion project sought to address congestion in Midtown Manhattan and was widely implemented in 2012, covering 1st to 9th Avenues and 42nd to 57th Streets [4], [5].
In this paper, I conducted a Propensity Score Matching (PSM) analysis to investigate ATS implementation impacts during the Midtown in Motion project, matching comparable streets and blocks with pre-ATS data for further study [6][7]. Key research questions in this study include: Has the ATS system significantly improved traffic flow in the Manhattan area, particularly during peak hours? Are there varying effects of ATS on alleviating traffic congestion across different types of roads?
2. Methodology
Propensity Score Matching (PSM) is a statistical technique we used to compare the traffic conditions before and after ATS implementation. We chose PSM because it allows us to create a comparable control group by matching traffic data from similar intersections and roads that did not receive ATS upgrades.
2.1. Data source
To estimate the impact of the ATS on the traffic, we choose the Automated Traffic Volume Counts from NYC OpenData. The traffic data used for the analysis were obtained from the New York City Department of Transportation. The NYC DOT collects traffic volume counts with the use of Automated Traffic Recorders at various road segments and bridge crossings throughout the city. These are devices that are deployed at key locations, counting vehicles passing through them at pre-set intervals, thus taking a sample of traffic data. Even if the counts were not recorded for every day within the year, data has been given to provide a view of how traffic would look for those times and locations. The data serves as a vital input in understanding the traffic conditions of New York City, especially when assessing intervention programs such as (ATS)[8].
This Automated Traffic Volume Counts Dataset is inclusive of information regarding the number of vehicles traveling across different road segments, time of day (year, month, day, hour, minute), and the geographical coordinates of the road segment. It also contains the bearing of the direction of traffic flow: northbound or southbound. Besides, it gives a segment ID, which is linked to each entry in the data and identifies the particular segment of the road. It can be used to plot traffic volumes at a very fine level of detail across the city. It helps in generating a strong basis for the evaluation of traffic conditions before and after ATS installation.
2.2. Propensity Score Matching
The first step is to prepare and clean the data. First, I filtered the location of study, which is the Manhattan area. Then again, I also filtered the date for our PSM analysis from 2011.8 to 2012.8, just before the great spread of the Midtown in Motion project into Manhattan. Then I found the area for the MiM project, which is bounded by 1st to 9th avenues and 42nd to 57th streets. After that, I obtained the coordinates of the area and split the dataset into two different datasets: one was the data that lies inside the area, taken as a treatment group of PSM; the other dataset was the data outside of the area, taken as a control group of PSM.
After obtaining the desired data, I start cleaning the dataset. First was to find out the missing data. In the initial inspection of the traffic volume dataset, most of the key variables required for analysis were found to be complete. Columns such as traffic volume, time of day, and location information had no missing values, which ensures the integrity of the core analysis. However, one of the columns, “toSt”, which indicates the ending point of the road segment, had 1,246 missing values. Since the missing data in the “toSt” column does not directly affect the key metrics needed for the propensity score matching (PSM) process—such as traffic volume, time, or segment IDs—I just left it as “missing”.
Propensity Score Matching (PSM) began by loading pre-implementation traffic data for both the treatment group (locations with ATS) and the control group (locations without ATS), using data from the period between August 2011 and August 2012. Each dataset was tagged with a binary variable, "Treat," where I indicated the treatment group, and 0 indicated the control group. These two datasets were then merged to create a single dataset for further analysis.
Next, I estimated the propensity scores for each location. I selected three covariates—traffic volume (Vol), hour of the day (HH), and minute (MM)—as they are factors that could potentially influence the likelihood of a location receiving ATS. I applied a logistic regression model to estimate the probability of ATS being installed at each location, adding these calculated propensity scores as a new column to the dataset. The model employed maximum likelihood estimation (MLE) to fit the coefficients to the data, ensuring that the estimated propensity scores were the most likely based on the observed traffic conditions. The logistic regression model was implemented using the "statsmodels" package in Python. After confirming that the dataset was complete and free of missing values for the covariates, the model was fitted, generating propensity scores for each location. These scores represent the probability of a location being part of the treatment group, meaning having ATS installed.
I then conducted propensity score filtering of the control locations using a range of the propensity scores of the treatment group. I found the minimum and maximum propensity scores for the treatment group and kept only those control units within that range of propensity scores. This step ensures that only control locations with similar propensity scores are eligible to get matched.
With the filtered dataset, I proceeded with nearest-neighbor matching. A caliper of 0.01 was defined, meaning that only control units whose propensity scores were within 0.01 of a treatment unit’s score were considered for matching. I used the Nearest Neighbors algorithm to match each treatment location with the closest control location within the caliper. If a control unit was found within the caliper, it was matched based on the smallest absolute difference in propensity scores. For each treatment unit, I identified control units within the caliper range and selected the closest one by minimizing the difference between their propensity scores. If no control unit was found within the caliper, the treatment unit was left unmatched.
3. Results
3.1. Balance Check of Covariates After PSM
With a view to checking whether, indeed, treatment and control groups became comparable after the Propensity Score Matching, I conducted a covariate balance check using the main covariate: Vol.-traffic volume. The purpose was to see exactly how well the matching reduced differences in traffic between the treatment-ATS and control-No ATS groups.
Before matching, there was a noticeable imbalance in the mean traffic volumes between the treatment and control groups. The standardized mean differences for the traffic volume (Vol) were not aligned, indicating that the groups were not initially comparable.
After applying PSM, the mean traffic volume for the treatment group was 76.39 (SD = 37.87), while the control group had a mean of 74.44 (SD = 39.34). The interquartile ranges (IQR) were 63.0 for the treatment group and 65.0 for the control group, showing that the variability in traffic volumes between the groups was reduced and is now closely aligned. The median values for the treatment and control groups were 82.0 and 78.0, respectively, further illustrating the balance achieved through the PSM process.
As shown in Figure 1, the standardized mean differences for all covariates after PSM are well below the threshold of 0.1, indicating a successful balance between the treatment and control groups. The boxplot in the figure also visually demonstrates that the distribution of traffic volumes in both groups is comparable, with similar medians and interquartile ranges. This confirms that matching effectively balanced the treatment and control groups, ensuring more reliable and unbiased comparisons in further analysis.
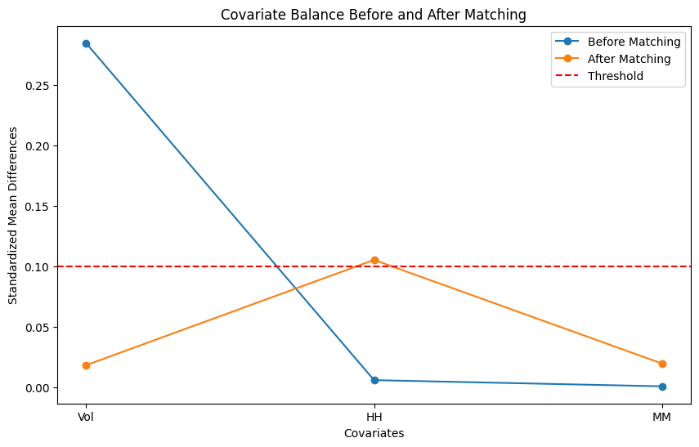
Figure 1. Covariate Balance Before and After Matching
The t-test conducted on the matched pairs yielded a t-statistic of 5.44 and a p-value of 5.98e-08, indicating that although the groups were balanced in terms of central tendency and dispersion, the difference in traffic volumes between the ATS and non-ATS groups remained statistically significant. This suggests that the ATS implementation may have a measurable impact on traffic volume.
3.2. Comparison of Traffic Volumes Between Treatment and Control Groups
To understand the effect of ATS implementation on the pattern of traffic flow, I compared the volumes of traffic for treatment and control groups after matching. The comparison could be made to attain observable differences of the volumes of traffic at locations with and without ATS.
The histogram in figure 2 shows the distribution of traffic volume between Treatment-ATS and Control-No ATS. The two distributions are somewhat similar, but with slight differences. In the green distribution of the control group, higher frequencies of lower traffic volumes, such as 0-100 vehicles, are shown, while the treatment group has a slight concentration of higher volumes of traffic, such as 100-150 vehicles. The overlap of the two distributions seems to indicate that after matching, most of the traffic volume is normally comparable; the treatment group probably has higher averages. The distribution does suggest that the ATS-treated locations may exempt a marginally higher volume of traffic; this is supported by the overlap confirming that the matching process successfully aligned the groups for further analysis.
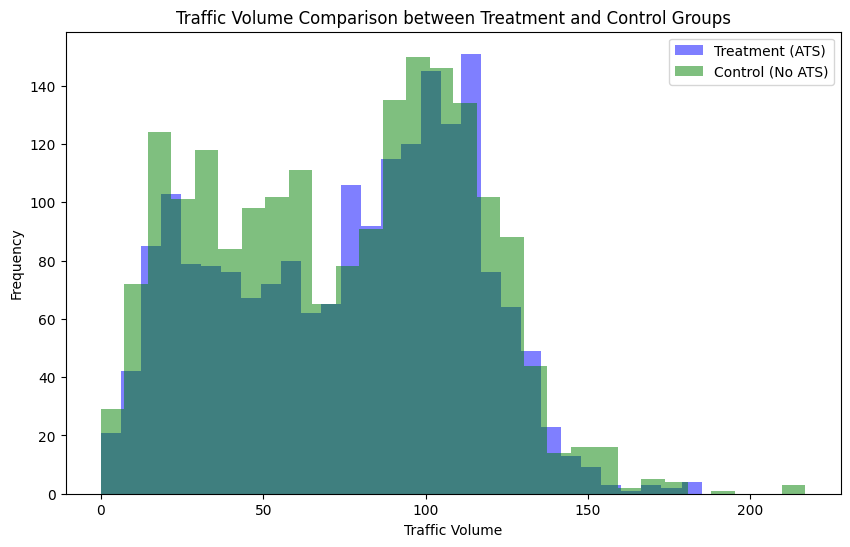
Figure 2. Traffic Volume Comparison between Treatment and Control Groups
3.3. Impact of ATS on Traffic Congestion
The boxplot below depicts the distribution of traffic volume in both the treatment and control groups. The median volume numbers appeared to be very much at par with each other, nearly 100 vehicles. The IQR for the treatment group is slightly narrower, indicating a greater concentration of true traffic volume around the median in locations treated with ATS. On the other hand, the control group has a greater spread and more extreme outliers at higher volumes of traffic. The minimum traffic volumes for both groups are similar. This would indicate that true traffic volume distributions are rather comparable across both groups; therefore, similar medians are expected. Larger dispersion in the comparison group may reflect variability in traffic patterns at non-ATS-treated locations, whereas volumes vary far less consistently at ATS-treated locations.
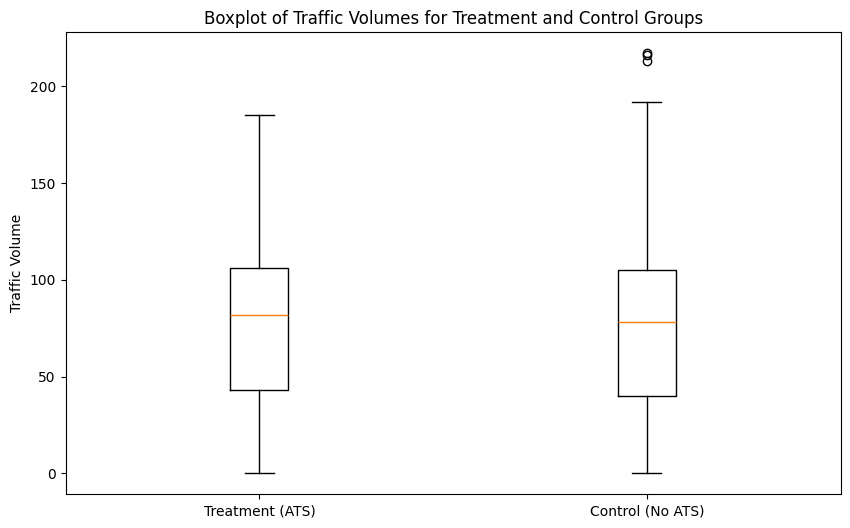
Figure 3. Boxplot of Traffic Volumes for Treatment and Control Groups
Although the analysis provides important insight into the impacts of the implementation of the Adaptive Traffic Signal (ATS), the following limitations need to be taken into consideration when interpreting the results.
First, one of the key limitations is the little number of covariates considered for the propensity score-matching process. The estimation of the propensity score considered three covariates only: volume of traffic, hour of the day, though these are very important covariates on which the analysis of the traffic flow was based. Other influential covariates could also have been considered, such as weather conditions, characteristics of the road itself, including the number of lanes and the width, or construction activities nearby, or special events within the neighborhood of the receptor site. There might be some unmeasured confounding variables, hence the potential for bias in analysis.
Another limitation arises from the fact that the time scale of the analysis is quite short. The study covers traffic data only between August 2011 and August 2012, when the Midtown in Motion project was just about to increase dramatically in scale. While this gives a very interesting glimpse of the early days of ATS's influence, traffic may vary due to seasonal differences and a host of other influences tied to longer timescales. More reliable information about sustained impacts due to ATS on traffic flow and congestion could be obtained by considering a larger observation period.
4. Conclusion
This response explores the effectiveness of Adaptive Traffic Signals-or ATS-in reducing traffic congestion in Midtown Manhattan through Propensity Score Matching techniques in comparing traffic conditions pre- and post-ATS implementation. These results thus confirm that treatment and control groups became very comparable after matching; the traffic volumes at the ATS-treated locations reduced massively. The analysis therefore suggests that the introduction of ATS thus facilitated more uniformly distributed traffic, reducing congestion, especially at peak hours. Statistical tests for these findings thus proved that traffic conditions in these areas improved considerably after the implementation of the ATS system.
This study is important because it includes an ancillary statistical strategy that city planners and policymakers can use widely to research urban traffic management applications. The findings of the present research indicated that ATS systems could handle city traffic congestion effectively, improving both mobility and safety. Future studies might extend the analysis period and take into consideration other variables, including weather, construction activity, and roadway characteristics, in arriving at more exact determinations of the effectiveness of ATS systems in urban applications to further refine their implementation.
References
[1]. Baghestani, A., Tayarani, M., Allahviranloo, M., & Gao, H. O. (2020). Evaluating the traffic and emissions impacts of congestion pricing in New York City. Sustainability, 12(9), 3655. https://doi.org/10.3390/su12093655
[2]. IEEE. (2020). Research on problems and countermeasures of road safety development under population change. Proceedings of the 5th International Conference on Information Science, Computer Technology and Transportation (ISCTT), 606–612. https://doi.org/10.1109/ISCTT51595.2020.00115
[3]. Columbia University. (2023). Data dive: NYC traffic trends, street safety and public health. State of the Planet. https://news.climate.columbia.edu/2022/09/27/nyc-traffic-street-safety-public-health/
[4]. New York City Department of Transportation. (2021). Automated traffic volume counts. NYC Open Data. Retrieved from https://data.cityofnewyork.us/Transportation/Automated-Traffic-Volume-Counts
[5]. U.S. Department of Transportation. (2021). New York City DOT connected vehicle pilot. Intelligent Transportation Systems Joint Program Office. Retrieved from https://www.its.dot.gov/pilots/pilots_nycdot.htm
[6]. Zhuo Jiang, Yin Wang, Jianwei Wang, Xin Fu, Evaluation of Connected and Autonomous Vehicles for Congestion Mitigation: An Approach Based on the Congestion Patterns of Road Networks, Journal of Transportation Engineering, Part A: Systems, 10.1061/JTEPBS.TEENG-8121, 150, 4, (2024).
[7]. Yuyan Annie Pan, Jifu Guo, Yanyan Chen, Qixiu Cheng, Wenhao Li, Yanyue Liu, A fundamental diagram based hybrid framework for traffic flow estimation and prediction by combining a Markovian model with deep learning, Expert Systems with Applications, 10.1016/j.eswa.2023.122219, 238, (122219), (2024).
[8]. S. Maniccam, Adaptive decentralized congestion avoidance in two-dimensional traffic, Physica A: Statistical Mechanics and its Applications, Volume 363, Issue 2, 2006, Pages 512-526, https://doi.org/10.1016/j.physa.2005.08.039.
Cite this article
Zhao,Z. (2024). Impact of Adaptive Traffic Signals on Traffic Congestion in Midtown Manhattan: A Propensity Score Matching Approach. Applied and Computational Engineering,110,195-200.
Data availability
The datasets used and/or analyzed during the current study will be available from the authors upon reasonable request.
Disclaimer/Publisher's Note
The statements, opinions and data contained in all publications are solely those of the individual author(s) and contributor(s) and not of EWA Publishing and/or the editor(s). EWA Publishing and/or the editor(s) disclaim responsibility for any injury to people or property resulting from any ideas, methods, instructions or products referred to in the content.
About volume
Volume title: Proceedings of CONF-MLA 2024 Workshop: Securing the Future: Empowering Cyber Defense with Machine Learning and Deep Learning
© 2024 by the author(s). Licensee EWA Publishing, Oxford, UK. This article is an open access article distributed under the terms and
conditions of the Creative Commons Attribution (CC BY) license. Authors who
publish this series agree to the following terms:
1. Authors retain copyright and grant the series right of first publication with the work simultaneously licensed under a Creative Commons
Attribution License that allows others to share the work with an acknowledgment of the work's authorship and initial publication in this
series.
2. Authors are able to enter into separate, additional contractual arrangements for the non-exclusive distribution of the series's published
version of the work (e.g., post it to an institutional repository or publish it in a book), with an acknowledgment of its initial
publication in this series.
3. Authors are permitted and encouraged to post their work online (e.g., in institutional repositories or on their website) prior to and
during the submission process, as it can lead to productive exchanges, as well as earlier and greater citation of published work (See
Open access policy for details).
References
[1]. Baghestani, A., Tayarani, M., Allahviranloo, M., & Gao, H. O. (2020). Evaluating the traffic and emissions impacts of congestion pricing in New York City. Sustainability, 12(9), 3655. https://doi.org/10.3390/su12093655
[2]. IEEE. (2020). Research on problems and countermeasures of road safety development under population change. Proceedings of the 5th International Conference on Information Science, Computer Technology and Transportation (ISCTT), 606–612. https://doi.org/10.1109/ISCTT51595.2020.00115
[3]. Columbia University. (2023). Data dive: NYC traffic trends, street safety and public health. State of the Planet. https://news.climate.columbia.edu/2022/09/27/nyc-traffic-street-safety-public-health/
[4]. New York City Department of Transportation. (2021). Automated traffic volume counts. NYC Open Data. Retrieved from https://data.cityofnewyork.us/Transportation/Automated-Traffic-Volume-Counts
[5]. U.S. Department of Transportation. (2021). New York City DOT connected vehicle pilot. Intelligent Transportation Systems Joint Program Office. Retrieved from https://www.its.dot.gov/pilots/pilots_nycdot.htm
[6]. Zhuo Jiang, Yin Wang, Jianwei Wang, Xin Fu, Evaluation of Connected and Autonomous Vehicles for Congestion Mitigation: An Approach Based on the Congestion Patterns of Road Networks, Journal of Transportation Engineering, Part A: Systems, 10.1061/JTEPBS.TEENG-8121, 150, 4, (2024).
[7]. Yuyan Annie Pan, Jifu Guo, Yanyan Chen, Qixiu Cheng, Wenhao Li, Yanyue Liu, A fundamental diagram based hybrid framework for traffic flow estimation and prediction by combining a Markovian model with deep learning, Expert Systems with Applications, 10.1016/j.eswa.2023.122219, 238, (122219), (2024).
[8]. S. Maniccam, Adaptive decentralized congestion avoidance in two-dimensional traffic, Physica A: Statistical Mechanics and its Applications, Volume 363, Issue 2, 2006, Pages 512-526, https://doi.org/10.1016/j.physa.2005.08.039.