


1. Introduction
For many individuals and families, residential housing is one of the most important living resources and properties. In the cities, houses not only provide living space for people in society but also serve as an attractive market for investors [1]. As a result, housing price is an important indicator to measure the economic condition and market vitality of a country or region, so the change and formulation of housing price usually cause widely concerns among the people. The housing price forecast that aims to predict the change of price in future has always been one of the important factors affecting the national real estate planning and the government's formulation of relevant policies [2]. For individuals, housing price is also vital for their planning as the house is an important part of private assets, it not only provides the needs of human life, but also an important way of investment. However, building an accurate housing price forecasting model is a major challenge for the real estate macro market as well as individual investors or demanders. With the acceleration of urbanization and the continuous complexity of the real estate market, the volatility and prediction of housing prices are becoming more and more difficult. Therefore, the establishment of an effective housing price forecasting model can help the government to formulate a reasonable real estate policy. Obtaining accurate house price forecasts is also crucial to the decision-making of developers and investors. The establishment of a perfect housing price forecast model can also provide rational reference for buyers.
According to previous researches, housing price prediction, as a complex and multi-dimensional problem, has been widely studied and applied in statistics, machine learning, deep learning and other fields [3]. By using big data resources and combining various methods, researchers attempt to further improve the accuracy and practicability of housing price prediction and provide scientific basis for government, enterprise and individual decision-making [4]. It is also necessary to continuously improve relevant models. Prospective research directions may include multi-source data fusion, improving model interpretability, developing real-time prediction models, and carrying out cross-regional and transnational research [5]. There are many models that predicts house prices, so researchers need to build different types of data models in order to compare and find out the most optimistic and accurate ones. The most widely used models include economic models, statistical models, and machine learning models [6]. Machine learning technology is increasingly used in traditional technology. Because from a prediction point of view, using different models for deep learning provides strong accuracy for real-world problems. They are particularly useful for studying the housing market, for example, when applied to data collected by disaggregating advertising by region. For example, [7] used machine learning technology to track and forecast daily prices across five UK portals. In Asia, [8] developed a housing price index for 274 cities in China based on data provided by local real estate websites, which is undoubtedly a reasonable use of machine learning. Statistical models, including traditional linear regression models, are classical predictive models built with historical data and statistical assumptions. Machine learning models including decision trees, random forests and neural networks appeared with the development of data science and machine learning technology in recent years. They have also been widely used in housing price prediction, and the complexity of these models can effectively handle complex non-linear relationships and large-scale data [9]. Admittedly, different forecasting methods have different emphasis. Most previous studies focus on the effective prediction of macro housing price trend, and these housing price prediction models are not helpful to individuals [10]. In order to fill this research gap, this study focuses on the forecast of single housing price, which can effectively fit the need of an individual’s private housing demand.
This paper aims to explore the key factors affecting the housing price through regression analysis, and establish the corresponding forecast model, to provide a new perspective and method for related research. In this paper, we use linear regression and ridge regression to forecast the price of single house. Linear regression is a simple and effective regression analysis method, which is suitable for exploring and predicting the linear relationship between dependent and independent variables. Although it has certain limitations, it is chosen as the algorithm for this study because of its solid theoretical foundation and easy to understand and explain. This paper analyzes the main factors affecting the housing price in detail, including but not limited to the building area and the number of functional areas. Through the regression analysis method, the housing price forecasting model is established, and the model is evaluated and discussed in depth. Regression analysis can effectively use the relationship between various features to provide an explanatory model for the formation process of housing prices.
Our experiments indicates that using regression analysis for house price forecasting can clearly quantify the extent to which various factors affect house prices and provide interpretable model results. Through the analysis of each room type (such as the number of bedrooms, whether to have water heaters and other factors) to get the price corresponding to different room types, concise and concise comparison, will not produce illogical contradictions, can be well used in the same area housing price prediction and comparison. In short, this paper not only theoretically discusses the mechanism and influencing factors of house price formation, but also provides an effective forecasting model in terms of methods, which provides different research ideas for related research and has important reference value for accurately predicting single house.
2. Materials and Methods
2.1. The standard linear regression model
Linear regression is a common statistical method used to analyze linear relationships between two or more variables. Its basic form is to establish a linear relationship between a dependent variable (in this study house prices) and one or more independent variables (factors affecting house prices) [11].
The mathematical expression of multivariate linear regression is shown as follows:
\( y={β_{0}}+{β_{1}}{x_{1}}+{β_{2}}{x_{2}}+⋯+{β_{p}}{x_{p}}+ϵ\ \ \ (1) \)
Among them, \( y \) is the dependent variable (house price), \( {x_{2}} \) , \( {x_{2}} \) ,..., \( {x_{p}} \) are independent variables (such as housing size, whether there is a bathroom, etc.), \( {β_{0}} \) , \( {β_{1}} \) ,..., \( {β_{p}} \) are the model parameters, \( ϵ \) is the error term. Linear regression is simple and intuitive, but requires high linear assumptions of data [12].
The application of linear regression model relies on the following basic assumptions:
Linear relationship: There is a linear relationship between the dependent variable and the independent variable.
Independence: The observations are independent of each other.
Homoscedasticity: Different values of the independent variable correspond to the same variance of the dependent variable.
Normality: The error term follows a normal distribution.
No multicollinearity: There should be no strong linear correlation between independent variables.
These assumptions provide a theoretical basis for the validity and reliability of the linear regression model. The reliability of a model depends on whether these assumptions are met. In practice, deviations from assumptions may affect the forecasting performance of the model [11].
2.2. Preparation of data
In this study, we used a publicly available dataset that contains information about various houses and their corresponding prices. The dataset includes features such as the area of the house, the number of bedrooms, the number of bathrooms, and other relevant characteristics. These features will be treated as independent variables, while the house prices will serve as the dependent variable.
The data used in this study is derived from the Kaggle dataset "Housing Prices Dataset", which is a common dataset used in predictive modeling tasks related to real estate [13]. The data includes a wide range of physical characteristics of houses, which makes it ideal for building a linear regression model.
Table 1. The Kaggle dataset "Housing Prices Dataset" used in the research.
price | Area | bathrooms | stories | mainroad | guestroom | basement | hotwaterheating | airconditioning | parking | prefarea | furnishingstatus | |
0 | 13300000 | 7420 | 4 | 2 | 3 | Yes | No | No | Yes | 2 | yes | furnished |
1 | 12250000 | 8960 | 4 | 4 | 4 | Yes | No | No | Yes | 3 | No | furnished |
2 | 12250000 | 9960 | 3 | 2 | 2 | Yes | No | Yes | No | 2 | Yes | semi-furnished |
3 | 12215000 | 7500 | 4 | 2 | 2 | Yes | No | Yes | Yes | 3 | Yes | furnished |
4 | 11410000 | 7420 | 4 | 1 | 2 | Yes | Yes | Yes | yes | 2 | No | furnished |
Because data sets are now getting larger and larger, there will be inconsistencies in the arrangement and format of data sets[14]. Once the dataset is selected, it is important to clean the data to ensure that it is suitable for modeling. The following steps are typically involved in the data cleaning process [15]:
Handling Missing Values: Missing values are common in real-world datasets and they can adversely affect the performance of the linear regression model. There are several ways to handle missing values, such as imputing them with the mean or median of the variable, using more sophisticated techniques like K-nearest neighbors (KNN) imputation, or simply removing rows or columns with missing data. In our research, for the numerical data, we use the method of finding the median to supplement the missing values, and for the data to judge whether we have, we directly discard the method used in this study
Outlier Detection and Treatment: Outliers can have a significant impact on the performance of the linear regression model, as they can distort the relationship between the variables. Outliers can be detected using methods such as box plots or z-scores, and they can be dealt with by either removing them or transforming the data. We discard outliers and take data that do not significantly affect the regression model to build and test the model
Normalization and Scaling: In order to improve the convergence of the model and ensure that all variables are on a comparable scale, it is often necessary to normalize or scale the data. This is especially important when using gradient-based optimization methods. Common techniques for normalization include min-max scaling and z-score normalization.
2.3. Building linear regression model
2.3.1. Univariate linear regression
First, we used a single independent variable to construct a linear regression model. We assume the area of the house as the only independent variable, and the model is shown as the following:
\( y={β_{0}}+{β_{1}}×house area+ϵ\ \ \ (2) \)
This study uses the least squares (OLS) to estimate the parameters and in the model. With the training data, we can obtain estimates of the intercept and regression coefficients.
2.3.2. Multivariable linear regression
Univariate models use a limited number of variables to predict a single characteristic. In order to improve the prediction accuracy of the model, the program introduces several features and constructs a multivariate linear regression model. Multiple characteristics are accounted in this model (e.g. area, number of bedrooms, number of bathrooms, etc.), and the model is shown as the following:
\( y={β_{0}}+{β_{1}}{x_{1}}+{β_{2}}{x_{2}}+…+{β_{n}}{x_{n}}+ϵ\ \ \ (3) \)
Similarly, this research use the least squares method to estimate the various regression coefficients and fit the model with the training data.
2.3.3. Model evaluation
Model evaluation is a key step in measuring the quality of a model. Commonly used evaluation indicators include Mean square error (MSE), The coefficient of determination and Adjusted R-squared. In this research, we used all three parameters for evaluation. The formulas to calculate these parameters are listed as follows:
Mean square error (MSE): MSE measures the difference between the predicted value and the true value, and is calculated as follows:
\( MSE=\frac{1}{n}\sum _{i=1}^{n}{({y_{i}}-{\hat{y}_{i}})^{2}}\ \ \ (4) \)
The coefficient of determination: The coefficient of determination is the proportion that explains the fluctuation of the dependent variable, and the closer the value is to 1, the more explanatory power the model has.
\( {R^{2}}=1-\frac{∑{({y_{i}}-{\hat{y}_{i}})^{2}}}{∑{({y_{i}}-\overline{y})^{2}}}\ \ \ (5) \)
Adjusted R-squared: Unlike R-squared which increases with the number of variables, the adjusted R-squared accounts for the number of predictor variables and increases only if the new variable improves the model.
These metrics help us determine the accuracy and reliability of the linear regression model. Depending on the results, we may need to fine-tune the model or try alternative approaches.
3. Results
We plotted the pairwise relativity between housing price, housing area, number of bedrooms, number of bathrooms, floor location and number of parking lots, as shown in figure 1. This figure shows that there is a statistically significant positive relationship between residential property size and respective market prices, with larger houses being more expensive than smaller houses. The price increases when housing area increases. There is no clear relationship between other parameters. In addition, the distribution of house prices shows a clear right-skewed trend, indicating that low-price properties occur more frequently and gradually move closer to high-price properties. While most properties fall within a certain price range, there are some outliers whose prices are much higher, resulting in a tilt to the right.
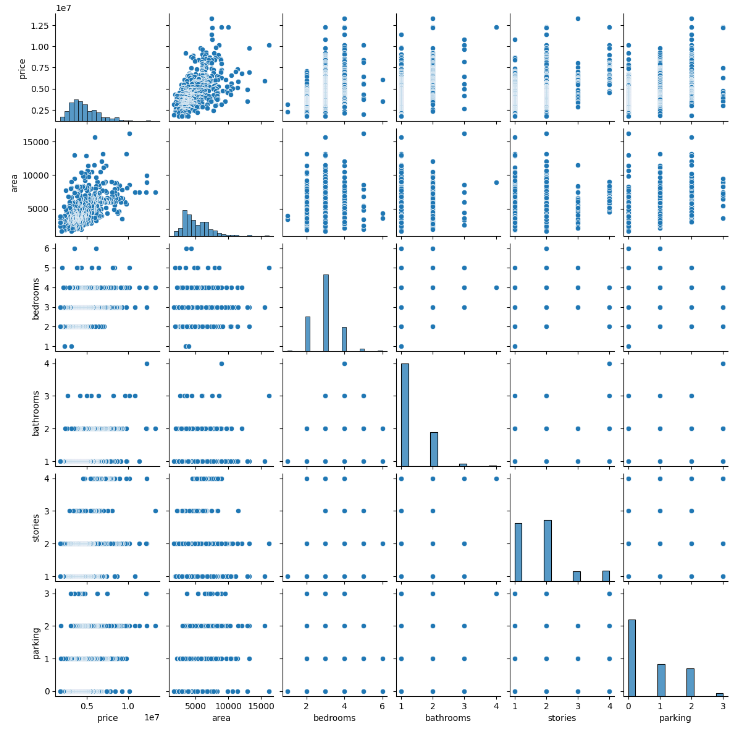
Figure 1. Relationship between housing price and different parameters. From up to down, left to right: price, area, bedrooms, bathrooms, stories and parking lots.
According to the correlation matrix shown in figure 2, there is a strong correlation between the price of the house and the size of the house (r = 0.54). Area is the most correlated factor what affects price. Other significant correlations exist between bathrooms and price (r = 0.52), air conditioning and price (r = 0.45), stories and price (r = 0.42), stories and bedrooms (r = 0.41). The most important factors that affects prices are areas, bathrooms, air conditioning, parking and bedrooms. There is also a negative correlation between furnishing status and price (r = -0.30). The second most correlated with house prices is the number of bathrooms in the home, which can be attributed to the fact that bathrooms are essential amenities. The least relevant variable is hot water heating, which may be due to the widespread availability and relatively low cost of hot water heating systems, which are often considered standard features of residential properties.
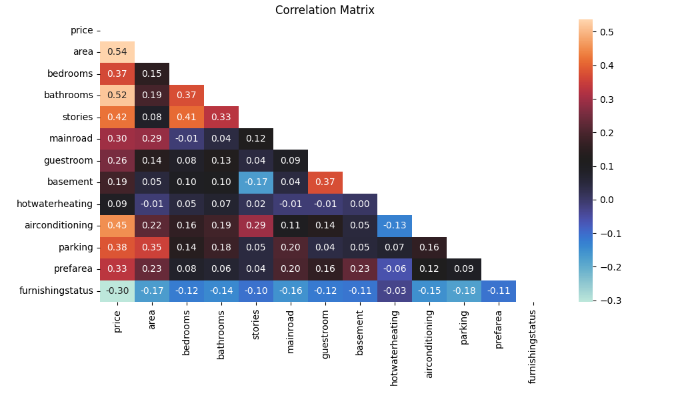
Figure 2. Correlation Matrix between parameters. From up to down, left to right: price, area, bedrooms, bathrooms, stories, main road, guestroom, basement, hot water heating, air conditioning, parking lots, pref area, and furnishing status.
We verified the accuracy of both univariate model and multivariate model by compare the predicted value with actual data, as shown in figure 3. The coefficient of determination R-square of the univariate model is 34.58%, while this value is 61.97% for multivariate model with outliers and 54.97% for multivariate models with outliers removed. This value indicates that only 34.58 percent of the variation in house prices can be explained by area variation alone. While floor space is undoubtedly a factor in determining house prices, the relatively low R-squared value suggests that it is not the only determinant. Thus, relying solely on acreage to predict house prices can lead to considerable inaccuracy. Other relevant characteristics and factors should be incorporated into the analysis of the study.
When multiple parameters are accounted into the linear regression model, including price and other factors, the decidability coefficient ( \( {R^{2}} \) ) increases to 61.97%, which significantly improves the predictive ability of the model. This means that 61.97 percent of the variance in house prices is now explained not only by square meters, but also by other factors such as bathrooms, bedrooms, and even the number of floors of the house. However, despite the significant differences in model performance, it is necessary to acknowledge the presence of outliers. We attempted to remove the outliers, but while our predictions are much better on the graph, the models’ scores drop from 61.97% (with outliers) to 54.97% (without outliers).
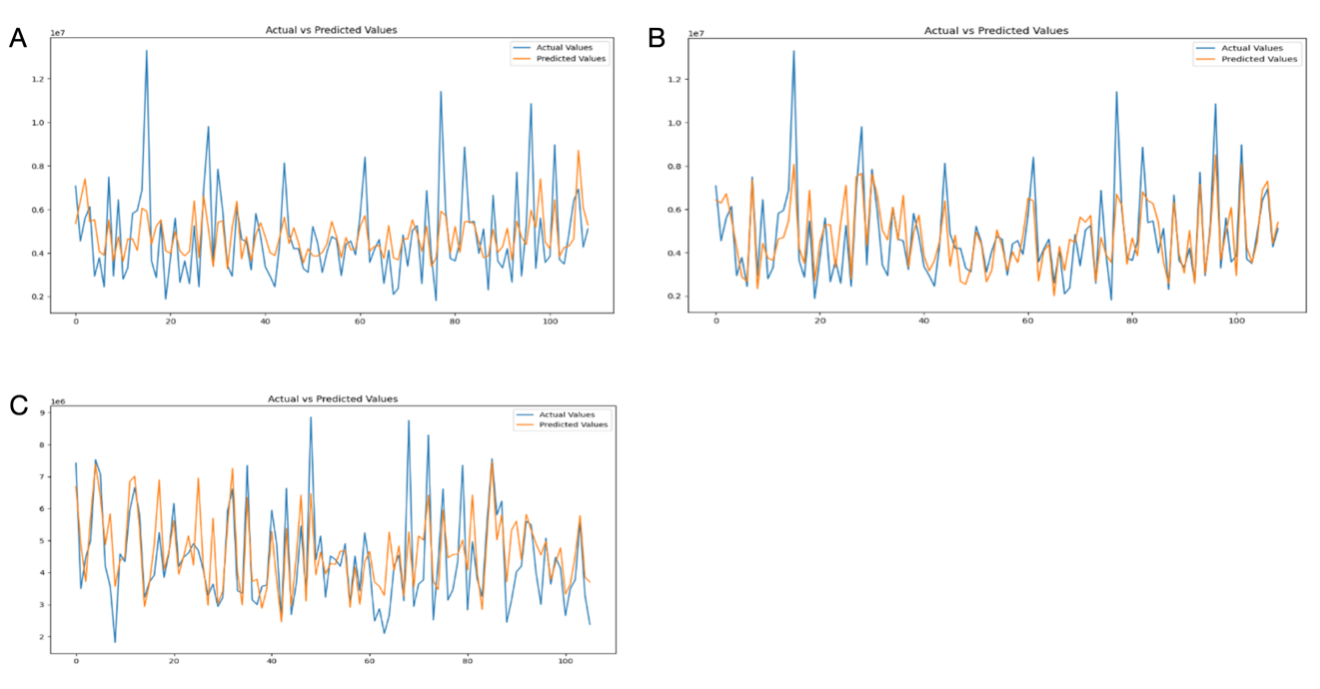
Figure 3. Comparison between predicted and actual values of different values. (A) Univariate model. (B) Multivariate model with outliers. (C) Multivariate models with outliers removed.
4. Discussion
In our research, we successfully constructed linear models to predict the changes and fluctuations in housing price. We find out several key factors that affects housing price including area, bathrooms, air conditioning and stories through statistical analysis. The prediction can reach a relatively high accuracy ( \( {R^{2}} \) = 61.97%) with multivariate linear models, and it performs significantly better than univariate models. The multiple linear regression model not only considers the size of the house, but also introduces several factors, such as the number of bathrooms and bedrooms, which significantly improves the predictive performance of the model. In the multiple regression model, the coefficient of determination ( \( {R^{2}} \) ) is significantly increased, indicating that the explanatory power of the model for housing prices is greatly enhanced. However, despite the improved performance of multivariate models, the problem of outliers still needs to be treated with caution when dealing with data.
When outliers are removed, the coefficient of determination ( \( {R^{2}} \) ) decreased, this may be due to loss of information, model sensitivity and overfitting. In a dataset, outliers may contain valuable information about rare events or extremes. Removing them leads to a loss of information that is essential for the model to generalize well to unseen data. Also, some models are more sensitive than others, so removing outliers may confound the assumptions of the model and cause it to perform worse than before. It is also possible that the model overfits outliers, and removing outliers can help mitigate overfitting.
The presence of outliers has a dual effect on the performance of the model. On the one hand, outliers may reflect rare or extreme conditions in the market, such as luxury homes or properties in special locations, and these outliers may contain important information for house price forecasting. On the other hand, outliers may disturb the stability of the model and cause the model to overfit or deviate from reality. Therefore, in practice, how to deal with outliers becomes the key issue. Researchers should be careful in the data preprocessing stage, not only to avoid the excessive influence of outliers on the model, but also to retain the important information in order to improve the robustness and accuracy of the model.
As a classical statistical method, linear regression model mainly has the advantages of simplicity, high computational efficiency and interpretable model results. By setting a simple linear relationship, linear regression can quickly build models and make predictions, which is very suitable for dealing with more intuitive relationships, such as the linear correlation between house size and price. Also, linear regression has high computational efficiency, especially for small and medium-sized data sets, so it has good practicability in many practical applications. The results of the linear regression clearly show the influence of each variable on the target variable through the regression coefficients, which is convenient for interpretation and analysis. However, linear regression also has some obvious shortcomings, especially when dealing with complex and multi-dimensional practical problems. First of all, linear regression assumes that there is a linear relationship between variables, but in reality, the relationship between many variables is often nonlinear or there are more complex interactions, which makes it difficult for linear regression to accurately capture these relationships. Secondly, linear regression is sensitive to outliers, and extreme values can significantly affect the fitting effect and forecasting performance of the model. Linear regression also relies on some strict assumptions, such as variance, error normality, and no multicollinearity, which might be unrealistic.
Future research might be needed to improve the shortcomings of the linear regression model and optimize from several directions. Researchers can combine it with more complex models such as nonlinear regression and generalized linear models to deal with nonlinear relationships in reality. For example, methods such as polynomial regression or logarithmic regression can be used to capture nonlinear relationships between variables. When dealing with outliers, robust regression methods can be introduced to reduce the interference of abnormal data to the model while retaining the key information therein. In addition, ensemble learning methods (such as random forests and gradient boosting trees) and deep learning models have been gradually applied in problems such as housing price prediction, which can better handle high-dimensional data and complex relationships and improve prediction accuracy.Many different researchers have used various machine learning algorithms for effective prediction of house prices, such as lasso regression, Random forest, GBM, and XGBoost to predict real estate prices. Some researchers have proposed that XGBoost algorithm is superior to other models and can predict housing prices more effectivel [6, 16] Future research can also explore innovative methods for data enhancement and feature engineering to improve the generalization ability of the model by adding data sources or extracting more representative features. With the improvement of big data and computing power, it will be able to develop real-time forecasting models, which will help decision makers respond to market changes quickly. With these improvements and the introduction of new technologies, house price forecasting models are expected to become more accurate and practical.
5. Conclusion
The complexity of house price forecasting stems from the fact that there are so many factors that affect house prices. Although the linear model based solely on house area can capture part of the trend of price change, usually this simple model cannot fully reflect the actual market fluctuation due to the multidimensional nature of house price. In order to improve the accuracy of prediction, researchers need to introduce multivariate linear regression models that incorporate multiple house characteristics into the analysis at the same time to better explain the variability of house prices and thus provide more accurate price forecasts.
House price forecasting is not only significant to the government's real estate policy making, but also plays a key role in the decision-making of developers, investors and house buyers. An accurate housing price forecasting model can help the government to plan the real estate market rationally and avoid market overheating or recession. For developers and investors, accurate forecasts help optimize investment decisions and reduce risks. For customers, prediction models can provide rational price reference and avoid blind house purchase.
In conclusion, housing price prediction needs to be comprehensively analyzed by combining various factors, not only considering the impact of different variables on prices, but also making reasonable trade-offs when dealing with outliers, so as to ensure that the prediction results are more accurate and have practical guiding significance. By continuously improving the model, researchers can not only improve the accuracy of prediction, but also provide new research ideas and methods for related fields and promote the further development of real estate market research.
References
[1]. Zhan, C. et al. (2023) ‘A hybrid machine learning framework for forecasting house price’, Expert Systems with Applications, 233, p. 120981. doi:10.1016/j.eswa.2023.120981.
[2]. Aastveit, K. and Anundsen, A. (2022) ‘Asymmetric effects of monetary policy in regional housing markets’, American Economic Journal: Macroeconomics, 14(4), pp. 499–529. doi:10.1257/mac.20190011.
[3]. Wang, S. and Wiart, J. (2020) ‘Assessment of EMF exposure from urban sensor measurements by using Artificial Neural Network’, 2020 XXXIIIrd General Assembly and Scientific Symposium of the International Union of Radio Science, pp. 1–3. doi:10.23919/ursigass49373.2020.9232299.
[4]. Chiu, K.-C. (2024) ‘A long short-term memory model for forecasting housing prices in Taiwan in the post-epidemic era through Big Data Analytics’, Asia Pacific Management Review, 29(3), pp. 273–283. doi:10.1016/j.apmrv.2023.08.002.
[5]. Ahmed, E. et al. (2019) A survey on Deep Learning advances on different 3D data representations, arXiv.org. Available at: https://arxiv.org/abs/1808.01462 (Accessed: 24 September 2024).
[6]. Jha, S.B. et al. (2020) Housing market prediction problem using different machine learning algorithms: A case study, arXiv.org. Available at: https://arxiv.org/abs/2006.10092 (Accessed: 22 September 2024). Bricongne, J.-C., Meunier, B. and Pouget, S. (2023) ‘Web-scraping housing prices in real-time: The COVID-19 crisis in the UK’, Journal of Housing Economics, 59, p. 101906. doi:10.1016/j.jhe.2022.101906.
[7]. Bricongne, J.-C., Meunier, B. and Pouget, S. (2023) ‘Web-scraping housing prices in real-time: The COVID-19 crisis in the UK’, Journal of Housing Economics, 59, p. 101906. doi:10.1016/j.jhe.2022.101906.
[8]. Wang, X., Li, K. and Wu, J. (2020) ‘House price index based on online listing information: The case of china’, Journal of Housing Economics, 50, p. 101715. doi:10.1016/j.jhe.2020.101715.
[9]. Xu, X. and Zhang, Y. (2021) ‘House price forecasting with Neural Networks’, Intelligent Systems with Applications, 12, p. 200052. doi:10.1016/j.iswa.2021.200052.
[10]. Author links open overlay panelVasilios Plakandaras a et al. (2014) Forecasting the U.S. real House price index, Economic Modelling. Available at: https://www.sciencedirect.com/science/article/abs/pii/S0264999314004143 (Accessed: 22 September 2024).
[11]. Groß, J., (2012) Linear regression (Vol. 175). Springer Science & Business Media.
[12]. Wang, Y.-A. et al. (2024) ‘On a class of linear regression methods’, Journal of Complexity, 82, p. 101826. doi:10.1016/j.jco.2024.101826.
[13]. M Yasser H., (2021). Housing Prices Dataset. Kaggle. Available at: https://www.kaggle.com/datasets/yasserh/housing-prices-dataset (Accessed at 16 August 2024)
[14]. Puts, M., Daas, P. and de Waal, T. (2015) ‘Finding errors in Big Data’, Significance, 12(3), pp. 26–29. doi:10.1111/j.1740-9713.2015.00826.x.
[15]. Author links open overlay panelVasilios Plakandaras a et al. (2014) Forecasting the U.S. real House price index, Economic Modelling. Available at: https://www.sciencedirect.com/science/article/abs/pii/S0264999314004143 (Accessed: 22 September 2024).
[16]. Rolli, C.S. (1970) Zillow home value prediction (zestimate) by using XGBoost, ScholarWorks. Available at: https://scholarworks.calstate.edu/concern/theses/bk128g45h?locale=de (Accessed: 31 October 2024).
Cite this article
Yan,L. (2024). Predicting House Prices with a Linear Regression Model. Applied and Computational Engineering,114,107-115.
Data availability
The datasets used and/or analyzed during the current study will be available from the authors upon reasonable request.
Disclaimer/Publisher's Note
The statements, opinions and data contained in all publications are solely those of the individual author(s) and contributor(s) and not of EWA Publishing and/or the editor(s). EWA Publishing and/or the editor(s) disclaim responsibility for any injury to people or property resulting from any ideas, methods, instructions or products referred to in the content.
About volume
Volume title: Proceedings of the 2nd International Conference on Machine Learning and Automation
© 2024 by the author(s). Licensee EWA Publishing, Oxford, UK. This article is an open access article distributed under the terms and
conditions of the Creative Commons Attribution (CC BY) license. Authors who
publish this series agree to the following terms:
1. Authors retain copyright and grant the series right of first publication with the work simultaneously licensed under a Creative Commons
Attribution License that allows others to share the work with an acknowledgment of the work's authorship and initial publication in this
series.
2. Authors are able to enter into separate, additional contractual arrangements for the non-exclusive distribution of the series's published
version of the work (e.g., post it to an institutional repository or publish it in a book), with an acknowledgment of its initial
publication in this series.
3. Authors are permitted and encouraged to post their work online (e.g., in institutional repositories or on their website) prior to and
during the submission process, as it can lead to productive exchanges, as well as earlier and greater citation of published work (See
Open access policy for details).
References
[1]. Zhan, C. et al. (2023) ‘A hybrid machine learning framework for forecasting house price’, Expert Systems with Applications, 233, p. 120981. doi:10.1016/j.eswa.2023.120981.
[2]. Aastveit, K. and Anundsen, A. (2022) ‘Asymmetric effects of monetary policy in regional housing markets’, American Economic Journal: Macroeconomics, 14(4), pp. 499–529. doi:10.1257/mac.20190011.
[3]. Wang, S. and Wiart, J. (2020) ‘Assessment of EMF exposure from urban sensor measurements by using Artificial Neural Network’, 2020 XXXIIIrd General Assembly and Scientific Symposium of the International Union of Radio Science, pp. 1–3. doi:10.23919/ursigass49373.2020.9232299.
[4]. Chiu, K.-C. (2024) ‘A long short-term memory model for forecasting housing prices in Taiwan in the post-epidemic era through Big Data Analytics’, Asia Pacific Management Review, 29(3), pp. 273–283. doi:10.1016/j.apmrv.2023.08.002.
[5]. Ahmed, E. et al. (2019) A survey on Deep Learning advances on different 3D data representations, arXiv.org. Available at: https://arxiv.org/abs/1808.01462 (Accessed: 24 September 2024).
[6]. Jha, S.B. et al. (2020) Housing market prediction problem using different machine learning algorithms: A case study, arXiv.org. Available at: https://arxiv.org/abs/2006.10092 (Accessed: 22 September 2024). Bricongne, J.-C., Meunier, B. and Pouget, S. (2023) ‘Web-scraping housing prices in real-time: The COVID-19 crisis in the UK’, Journal of Housing Economics, 59, p. 101906. doi:10.1016/j.jhe.2022.101906.
[7]. Bricongne, J.-C., Meunier, B. and Pouget, S. (2023) ‘Web-scraping housing prices in real-time: The COVID-19 crisis in the UK’, Journal of Housing Economics, 59, p. 101906. doi:10.1016/j.jhe.2022.101906.
[8]. Wang, X., Li, K. and Wu, J. (2020) ‘House price index based on online listing information: The case of china’, Journal of Housing Economics, 50, p. 101715. doi:10.1016/j.jhe.2020.101715.
[9]. Xu, X. and Zhang, Y. (2021) ‘House price forecasting with Neural Networks’, Intelligent Systems with Applications, 12, p. 200052. doi:10.1016/j.iswa.2021.200052.
[10]. Author links open overlay panelVasilios Plakandaras a et al. (2014) Forecasting the U.S. real House price index, Economic Modelling. Available at: https://www.sciencedirect.com/science/article/abs/pii/S0264999314004143 (Accessed: 22 September 2024).
[11]. Groß, J., (2012) Linear regression (Vol. 175). Springer Science & Business Media.
[12]. Wang, Y.-A. et al. (2024) ‘On a class of linear regression methods’, Journal of Complexity, 82, p. 101826. doi:10.1016/j.jco.2024.101826.
[13]. M Yasser H., (2021). Housing Prices Dataset. Kaggle. Available at: https://www.kaggle.com/datasets/yasserh/housing-prices-dataset (Accessed at 16 August 2024)
[14]. Puts, M., Daas, P. and de Waal, T. (2015) ‘Finding errors in Big Data’, Significance, 12(3), pp. 26–29. doi:10.1111/j.1740-9713.2015.00826.x.
[15]. Author links open overlay panelVasilios Plakandaras a et al. (2014) Forecasting the U.S. real House price index, Economic Modelling. Available at: https://www.sciencedirect.com/science/article/abs/pii/S0264999314004143 (Accessed: 22 September 2024).
[16]. Rolli, C.S. (1970) Zillow home value prediction (zestimate) by using XGBoost, ScholarWorks. Available at: https://scholarworks.calstate.edu/concern/theses/bk128g45h?locale=de (Accessed: 31 October 2024).