


1. Introduction
In recent years, with the acceleration of urbanization and industrialization, environmental pollution has become increasingly severe, posing significant challenges to public health and sustainable development[1]. As a national-level new area in China, Xiong'an New Area is at the forefront of addressing these issues. By implementing smart city technologies aimed at creating a green, ecologically livable environment with intelligent management, Xiong'an strives to enhance urban governance efficiency and improve residents' quality of life[2]. Integrating edge computing and multimodal sensors into environmental monitoring systems represents a cutting-edge approach to improving the accuracy and efficiency of data collection, processing, and analysis[3].
This study aims to explore the effectiveness of these technologies in overcoming challenges related to data accuracy and sensor node endurance. It introduces an innovative method that combines edge computing with multimodal sensors to construct an efficient and precise environmental monitoring system through real-time data collection, machine learning model predictions, and dynamic sampling frequency adjustments[4]. By optimizing sensor deployment and data analysis algorithms, the system improves the precision and efficiency of environmental monitoring.
To some extent, this research contributes to the field of environmental monitoring by exploring the application of emerging technologies and proposing practical solutions. Additionally, this study provides insightful recommendations for developing smart city infrastructure, aiding in the advancement and application of urban environmental monitoring technologies[5].
2. Case study
Prior to integrating edge computing and multimodal sensor technologies, the environmental monitoring system in Xiong’an New Area relied on traditional centralized monitoring methods. The limitations of this approach included sparse sensor distribution, which hindered comprehensive coverage of the entire region, and data transmission that depended on a central server, affecting the timeliness and reliability of data processing. Additionally, the short battery life of sensor nodes, along with frequent device maintenance and replacement, posed challenges to management efficiency, resulting in high overall monitoring costs. Particularly in monitoring key environmental factors such as air quality, water quality, and noise levels, the system lacked accuracy and real-time responsiveness, making it difficult to swiftly address sudden environmental changes. Faced with these issues, Xiong’an New Area urgently required a more efficient, precise, and sustainable environmental monitoring solution for its urban development and management[6].
Against this backdrop, Xiong’an New Area began to extensively apply Internet of Things (IoT) technologies, deploying a sensor network across the region to monitor environmental factors such as air quality, water quality, and noise levels in real-time. However, despite improving data collection capabilities, traditional monitoring systems continued to face two major challenges: data collection accuracy and sensor node endurance. Firstly, due to the complex interactions between different environmental factors, data from individual sensors was insufficient to accurately reflect the overall environmental conditions, often leading to significant errors in data interpretation. Secondly, the limited battery life of sensor nodes, coupled with prolonged high-frequency data collection and transmission, accelerated battery depletion, thus increasing maintenance costs and operational burdens.
In response to these challenges, Xiong’an New Area introduced the integration of edge computing and multimodal sensor technologies to overcome the limitations of traditional monitoring systems. Edge computing offers distributed processing capabilities, allowing for local data preprocessing, which reduces data transmission delays, alleviates the load on central servers and significantly enhances the system's real-time responsiveness. Meanwhile, the incorporation of multimodal sensors enables simultaneous monitoring of multiple environmental parameters, with data redundancy and multidimensional analysis improving the accuracy of the collected data. This technological integration not only enhances the efficiency and precision of the environmental monitoring system but also extends the battery life of sensor nodes, thereby reducing maintenance costs and improving system sustainability.
3. Theoretical analysis
3.1. Improvement in Data Collection Accuracy
Multimodal sensors, by integrating various types of sensors such as temperature, humidity, air quality, and light intensity, can capture environmental data from multiple dimensions. This diversity and data redundancy help enhance the accuracy of the monitoring data[7]. For instance, by combining PM2.5 data with temperature and humidity information, a more comprehensive understanding of air quality variations can be achieved, leading to more accurate predictions.
Edge computing processes and analyzes data locally, reducing transmission delays and improving the real-time nature of the data. When data collected by multimodal sensors is quickly processed and analyzed on-site, it can be immediately fed back into the decision-making system, thereby enhancing both the responsiveness and accuracy of the overall system.
3.2. Efficient Data Integration and Analysis
The distributed processing capability of edge computing nodes allows data to be processed simultaneously across multiple nodes, thus improving both the efficiency and reliability of data handling[8]. The data collected by multimodal sensors can undergo preliminary processing and analysis at different edge nodes, reducing the burden on any single node[9]. To better validate the effectiveness of multimodal data integration, this study designed a series of experiments to specifically explore the performance of deep learning techniques[10], particularly the Long Short-Term Memory (LSTM) model, in predicting environmental monitoring data[11].
3.3. Experiment Background
Xiong'an New Area has long faced air quality issues, particularly frequent PM2.5 concentration exceedances, posing significant threats to residents' health and the sustainable development of the environment. Therefore, this experiment selected PM2.5 as the primary monitoring indicator and combined it with meteorological parameters such as temperature and humidity to validate the improvement in environmental prediction achieved by multimodal data fusion technology[12].
The experimental data were sourced from a historical dataset collected over the past year from a monitoring station in Xiong'an New Area. The dataset includes environmental parameters such as PM2.5, temperature, and humidity, with hourly sampling frequency. The goal of the experiment is to analyze this historical data to predict the PM2.5 concentration changes over the next 24 hours, thus validating the application of multimodal data fusion and the LSTM time-series prediction model in environmental monitoring.
3.4. Experimental Process
3.4.1. Data Preprocessing. First, historical air quality monitoring data for one year were collected, including three dimensions: PM2.5, temperature, and humidity. To ensure the usability of the data, records with a high proportion of missing values were deleted, and outliers and noise were addressed. Then, the data were divided into a training set and a testing set. The training set was used to build the LSTM model and, in the meantime, to evaluate the model's prediction accuracy.
3.4.2. Model Construction. The experiment employed an LSTM time-series prediction model. LSTM is a deep learning model commonly used for processing sequential data, particularly adept at handling long-term dependencies. To verify the effect of multimodal data fusion, the experiment was designed with two comparative groups. One group used only PM2.5 as a single indicator while the other used multimodal data, including PM2.5, temperature, and humidity. By comparing the results of the two groups, whether multimodal data improves prediction accuracy was analyzed.
3.5. Experimental Design
(1) Univariate Prediction (PM2.5): Only historical PM2.5 data were used for prediction. The LSTM model takes PM2.5 concentration values from the past 24 hours to predict concentration changes for the next 24 hours.
(2) Multimodal Prediction (PM2.5 + Temperature + Humidity): In addition to PM2.5 data, temperature and humidity were included as additional input dimensions. The model not only considered historical PM2.5 changes but also incorporated trends in temperature and humidity for more refined predictions.
(3) Evaluation Metrics: Root mean square error (RMSE) and accuracy were used as evaluation criteria. In particular, predictions with an error margin of less than 5% were focused on and this margin was used as a standard for evaluating the model’s effectiveness.
3.6. Experimental Results
Through experimental comparison, significant differences in prediction accuracy were found between using single-variable data (PM2.5) and multimodal data (PM2.5, temperature, and humidity):
(1) Univariate Prediction (PM2.5): For predictions with an error margin of less than 5%, the model's prediction accuracy was 73%. While LSTM effectively captured short-term PM2.5 fluctuations, the absence of other environmental factors made the model struggle when dealing with complex meteorological changes, leading to relatively average prediction accuracy.
(2) Multimodal Prediction (PM2.5 + Temperature + Humidity): When temperature and humidity data were added to the model, prediction accuracy significantly improved. Within the same error range, the model’s prediction accuracy reached 97%. The inclusion of multimodal data allowed the model to better capture the interactions between environmental factors, improving its ability to predict changes in PM2.5 concentration.
3.7. Experimental Analysis
The experimental results show that single-sensor monitoring data (e.g., using only PM2.5 data) is often insufficient to accurately reflect complex environmental changes. PM2.5 concentrations are not only affected by their own historical trends but also by meteorological conditions (e.g., temperature and humidity). By introducing multimodal data, the LSTM model can more accurately capture the correlations between different environmental factors, resulting in more reliable predictions.
For instance, when temperatures rise, water evaporation increases, which affects the dispersion of PM2.5. If the model relies solely on historical PM2.5 data, it may fail to capture this complex physical process. However, with the inclusion of temperature and humidity data, the model can more accurately predict future changes in PM2.5 concentration.
Additionally, multimodal data provides redundancy, allowing the system to rely on data from other sensors when one sensor malfunctions or experiences data loss. This further enhances the system’s reliability and the robustness of data processing.
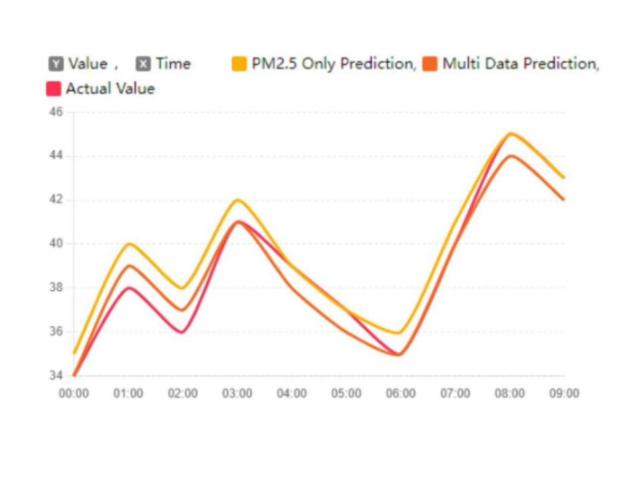
Figure 1. Prediction comparison: PM2.5 only vs. multi data
The Battery Life of the Sensor Node is Extended
By leveraging the local decision-making capabilities of edge computing, the sampling frequency of sensors can be dynamically adjusted according to predicted environmental changes. For instance, when environmental changes are rapid, the sampling frequency is increased, while it is decreased when the environment is stable. This dynamic adjustment significantly conserves energy, thereby extending the battery life of sensor nodes and reducing maintenance costs.
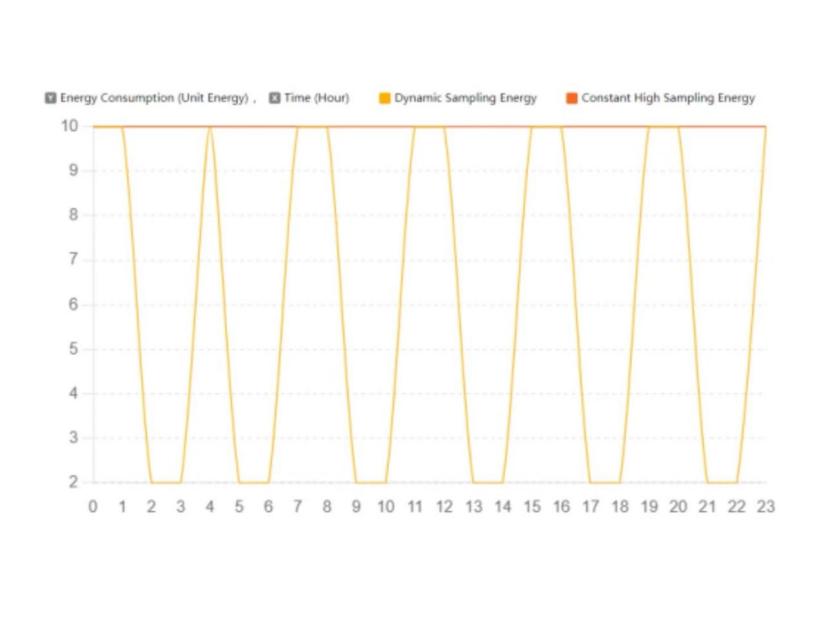
Figure 2. Energy consumption: dynamic sampling vs constant high sampling
Figure 2 is a line chart comparing energy consumption, illustrating the predicted energy consumption of dynamic sampling versus constant high-frequency sampling. As shown, the energy consumption of dynamic sampling is approximately 0.60 times that of constant high-frequency sampling, significantly reducing energy usage
4. Conclusion
This study explores the design and implementation of an environmental monitoring system based on the integration of edge computing and multimodal sensor fusion. It primarily addresses the challenges of data collection accuracy and sensor node battery life in environmental monitoring. Leveraging the low latency and distributed processing capabilities of edge computing, along with the diversity and redundancy of multimodal sensor data, this research proposes an efficient and accurate monitoring solution. This is achieved by incorporating the LSTM time series prediction model, which dynamically adjusts sensor sampling frequency to optimize energy consumption, significantly improving the system’s real-time performance, accuracy, and battery life. The study not only contributes to the technological domain but also provides strong support for the sustainable development and improves management efficiency of smart cities.
However, this study has some limitations. Field validation was insufficient; although the experimental results demonstrated the effectiveness of the proposed method, there was a lack of large-scale, real-world validation data. Future studies could deploy sensor networks in real-world scenarios for long-term monitoring to further verify the system's reliability and practicality. Additionally, the variety of data used in this study was limited, focusing mainly on environmental parameters such as air quality, temperature, humidity, and noise levels. Future research could incorporate a wider range of sensor data, such as water quality and light intensity, to further enhance the system’s comprehensive monitoring capabilities.
There is also room for improvement in the algorithms used. While the LSTM time series prediction model was employed, opportunities for optimization and enhancement remain. Future studies could explore integrating other advanced machine learning and deep learning algorithms to improve prediction accuracy and system responsiveness.
Lastly, although this study touched on privacy protection, it did not delve deeply into data security and privacy measures. Future research could focus on incorporating data encryption, privacy protection protocols, and data management strategies to safeguard user data.
Looking ahead, environmental monitoring systems will become more intelligent, capable of self-learning and adapting to environmental changes, thereby achieving more efficient data processing and decision-making. With the integration of big data analytics, these systems will be able to handle vast amounts of data, extracting valuable insights and trends to inform urban management. Advancement in IoT technology will facilitate wider deployment of environmental monitoring systems, leading to the creation of comprehensive monitoring networks. By optimizing energy consumption and enhancing system efficiency, these systems will contribute significantly to green, sustainable development, supporting the construction of smart cities. In the future, the development of relevant policies and standards will further promote the adoption and application of environmental monitoring technologies, ensuring data reliability and standardized system operations.
References
[1]. Kirimtat, A., Krejcar, O., Kertesz, A., & Tasgetiren, M. F. (2020). Future trends and current state of smart city concepts: A survey. IEEE access, 8, 86448-86467.
[2]. Wang, Y., Song, L., et al. (2020). Climate-related risks in the construction of Xiongan New Area, China. Theoretical and Applied Climatology, 141, 1301-1311.
[3]. Qiu, T., Chi, J., et al. (2020). Edge computing in industrial internet of things: Architecture, advances and challenges. IEEE Communications Surveys & Tutorials, 22(4), 2462-2488.
[4]. Coulby, G., Clear, A. K., Jones, O., & Godfrey, A. (2021). Low-cost, multimodal environmental monitoring based on the Internet of Things. Building and Environment, 203, 108014.
[5]. Shamsuzzoha, A., Nieminen, J., Piya, S., & Rutledge, K. (2021). Smart city for sustainable environment: A comparison of participatory strategies from Helsinki, Singapore and London. Cities, 114, 103194.
[6]. Jiang, X. Y., et al. The classification of multi-modal data with hidden conditional random field. Pattern Recognition Letters, vol. 51, pp. 63–69, 2015
[7]. Reynolds, J., Williams, E., et al. (2022). A Multimodal Sensing Platform for Interdisciplinary Research in Agrarian Environments. Sensors, 22(15), 5582.
[8]. Kim, M., Kim, T., Park, S., & Lee, K. (2022). An Indoor Multi-Environment Sensor System Based on Intelligent Edge Computing. Electronics, 12(1), 137.
[9]. Wan, S., Zhao, K., Lu, Z., Li, J., Lu, T., & Wang, H. (2022). A modularized ioT monitoring system with edge-computing for aquaponics. Sensors, 22(23), 9260.
[10]. Ezenkwu, C. P., Cannon, S., & Ibeke, E. (2024). Monitoring carbon emissions using deep learning and statistical process control: a strategy for impact assessment of governments’ carbon reduction policies. Environmental monitoring and assessment, 196(3), 231.
[11]. Li, J., Hong, D., Gao, et al. (2022). Deep learning in multimodal remote sensing data fusion: A comprehensive review. International Journal of Applied Earth Observation and Geoinformation, 112, 102926.
[12]. Himeur, Y., Rimal, B., Tiwary, A., & Amira, A. (2022). Using artificial intelligence and data fusion for environmental monitoring: A review and future perspectives. Information Fusion, 86, 44-75.
Cite this article
Peng,F. (2024). Environment Monitoring based on the Integration of Edge Computing and Multimodal Sensors. Applied and Computational Engineering,113,77-82.
Data availability
The datasets used and/or analyzed during the current study will be available from the authors upon reasonable request.
Disclaimer/Publisher's Note
The statements, opinions and data contained in all publications are solely those of the individual author(s) and contributor(s) and not of EWA Publishing and/or the editor(s). EWA Publishing and/or the editor(s) disclaim responsibility for any injury to people or property resulting from any ideas, methods, instructions or products referred to in the content.
About volume
Volume title: Proceedings of the 2nd International Conference on Machine Learning and Automation
© 2024 by the author(s). Licensee EWA Publishing, Oxford, UK. This article is an open access article distributed under the terms and
conditions of the Creative Commons Attribution (CC BY) license. Authors who
publish this series agree to the following terms:
1. Authors retain copyright and grant the series right of first publication with the work simultaneously licensed under a Creative Commons
Attribution License that allows others to share the work with an acknowledgment of the work's authorship and initial publication in this
series.
2. Authors are able to enter into separate, additional contractual arrangements for the non-exclusive distribution of the series's published
version of the work (e.g., post it to an institutional repository or publish it in a book), with an acknowledgment of its initial
publication in this series.
3. Authors are permitted and encouraged to post their work online (e.g., in institutional repositories or on their website) prior to and
during the submission process, as it can lead to productive exchanges, as well as earlier and greater citation of published work (See
Open access policy for details).
References
[1]. Kirimtat, A., Krejcar, O., Kertesz, A., & Tasgetiren, M. F. (2020). Future trends and current state of smart city concepts: A survey. IEEE access, 8, 86448-86467.
[2]. Wang, Y., Song, L., et al. (2020). Climate-related risks in the construction of Xiongan New Area, China. Theoretical and Applied Climatology, 141, 1301-1311.
[3]. Qiu, T., Chi, J., et al. (2020). Edge computing in industrial internet of things: Architecture, advances and challenges. IEEE Communications Surveys & Tutorials, 22(4), 2462-2488.
[4]. Coulby, G., Clear, A. K., Jones, O., & Godfrey, A. (2021). Low-cost, multimodal environmental monitoring based on the Internet of Things. Building and Environment, 203, 108014.
[5]. Shamsuzzoha, A., Nieminen, J., Piya, S., & Rutledge, K. (2021). Smart city for sustainable environment: A comparison of participatory strategies from Helsinki, Singapore and London. Cities, 114, 103194.
[6]. Jiang, X. Y., et al. The classification of multi-modal data with hidden conditional random field. Pattern Recognition Letters, vol. 51, pp. 63–69, 2015
[7]. Reynolds, J., Williams, E., et al. (2022). A Multimodal Sensing Platform for Interdisciplinary Research in Agrarian Environments. Sensors, 22(15), 5582.
[8]. Kim, M., Kim, T., Park, S., & Lee, K. (2022). An Indoor Multi-Environment Sensor System Based on Intelligent Edge Computing. Electronics, 12(1), 137.
[9]. Wan, S., Zhao, K., Lu, Z., Li, J., Lu, T., & Wang, H. (2022). A modularized ioT monitoring system with edge-computing for aquaponics. Sensors, 22(23), 9260.
[10]. Ezenkwu, C. P., Cannon, S., & Ibeke, E. (2024). Monitoring carbon emissions using deep learning and statistical process control: a strategy for impact assessment of governments’ carbon reduction policies. Environmental monitoring and assessment, 196(3), 231.
[11]. Li, J., Hong, D., Gao, et al. (2022). Deep learning in multimodal remote sensing data fusion: A comprehensive review. International Journal of Applied Earth Observation and Geoinformation, 112, 102926.
[12]. Himeur, Y., Rimal, B., Tiwary, A., & Amira, A. (2022). Using artificial intelligence and data fusion for environmental monitoring: A review and future perspectives. Information Fusion, 86, 44-75.