


1. Introduction
Recidivism rates are of great significance as a key indicator of criminal justice convictions and rehabilitation, the economic value of potential labour and the overall well-being of society. The main impacts focus on three areas: (1) Social Perspective Issues: Cumulative crime rates are directly related to public safety. Undoubtedly, state agencies, communities, law enforcement agencies, community corrections agencies, community mental health agencies, and practitioners are very concerned about the employment and recidivism of persons released from prison. Indeed, a significant impediment to the reemployment of people from prison leading to recidivism without a source of employment is community bias, which poses an even greater threat to public safety. In order to increase social cohesion, and more importantly, to prevent inmates from being marginalised by society due to past stigma leading to a cycle of isolation and more serious crime, it is crucial to study the targeting factors and to provide rehabilitation programmes, including counselling, cognitive-behavioural therapy and drug treatment, that are tailored accordingly. (2) Economic perspective: First and foremost, there is the issue of high costs, with high recidivism rates placing a huge financial burden on governments and taxpayers. Reincarcerating individuals means additional costs for prison facilities, law enforcement, and legal proceedings. Reducing recidivism rates could save billions in prison maintenance and criminal justice costs. Second is the issue of labour market employment. Recidivism can hinder reintegration into the labour force. Ex-offenders often face significant barriers to employment, echoing the isolating cyclical effect described above, which increases the likelihood that they will re-offend. Addressing these barriers not only reduces recidivism but also taps into the potential economic contributions of former prisoners. (3) Legal policy perspective: possible deficiencies in correctional institutions or post-prison systems; recidivism rates as an important measure of law-related reforms to test the effectiveness of policy reforms and promote a shift from a greater focus on rehabilitation to punishment
Indeed, over the past two decades, there has been a surge of interest in the direction of data research focussed on exploring whether a particular trait increases the risk of dangerousness for reoffending and how that risk can be assessed, with a large body of literature examining the risk. However, each of these studies has its own problems in conducting risk assessments. For example, the follow-up time is too short, and gender differences are ignored. We found that the data set of these studies is inherently problematic, i.e., there is a bias based on data from archival records, and there is a failure to look at relative importance, which includes the degree of misdemeanour classification in the discussion. More seriously, it was found that there were relatively few studies on the ‘purpose of this paper’ (one could mention the interaction terms: age, gender, misdemeanour, ethnicity, and antecedents for each of the five groups), i.e., there were fewer studies that examined the correlations between the variables, or the joint impacts of the variables.
In summary, this paper wishes to explicitly explore three aims. One is to screen for influences on reoffending rates through the Random Forest model (other models: comparing variables affecting first-time offending with variables added to reoffending, comparing crime factors with reoffending factors, well-documented gender differences in offending behaviour, empirical evidence prospectively linking reoffending factors with crime demand factors, and whether parental personal distress in the former might be an important variable), and to try to improve the predictive scale by finding robust indicators that predict different types of reoffending i.e., by including significant variables in logistic regressions, thereby improving the accuracy of multiple regression models. It is also important to focus on previously neglected aspects and interactions, standardising data collection and applying data pre-processing to explore the joint effect of the two sets of interaction terms (explaining which two sets of interaction terms) on recidivism rates, both of which can improve the performance of ML models. Ultimately, if possible, the original dataset is compared to see if there is a primitive bias.
2. Literature Review
2.1. Information Sources
To explore the three objectives mentioned above, the literature review section needs to focus on: firstly, the important variables that influence re-offending rates and their ranking, secondly clear methodologies that allow for the study of correlations, and the exploration of the literature that can be extended to causality under and assumptions, and lastly the application of feedback mechanisms such as AUC, accuracy, RMSE, and calibration—considering the suggestions[1] from Gagliardi and Lovell improvement of the feedback system of machine learning. Therefore, the literature that meets the above criteria is firstly screened for relevance concerning the Travaini et al. study and then related to this paper with more specific results and methodologies. In his study, the literature that meets the above criteria is screened for relevance, and then the relevant literature is linked to the study in this paper. More specific results and methodological discussions will be described in the discussion section.
Travaini et al.'s research considers the PRISMA Statement[2], which offers a robust framework for conducting systematic reviews. Adoption of the PRISMA principal article will provide a standardized structure, including a checklist and a flowchart, to standardize how systematic reviews are conducted and reported, which will increase the transparency of the article's research and facilitate evidence-based decision-making for other researchers. This approach guarantees transparency in the execution and reporting of systematic reviews and meta-analyses. Authors are obligated to provide a detailed account of their research methodology, enabling readers to fully grasp the entire process, from the literature search to data extraction. At the same time, selection bias is minimized, and the comprehensiveness and impartiality of the review are ensured by requiring clear documentation of how studies were selected and excluded. Considering this research, the principles provide three important features that guide us to screen reference and structure ours: (1) concentrate on the purpose of the study is to predict recidivism; (2) the study has explicit data collection and categorizing, including data collection and preparation; (3) the study has a proper description of the methodologies, applying the machine learning methods.
Indeed, the Travaini et al. study recognizes both shortcomings, such as the omission of predictive performance from the PRISMA principle. The inspiration from Mu D et al.'s research is to fulfil the logic of his prediction that suggests the datasets of each study differed in their level of integration with, for example, historical risk assessment data, and therefore, the number of predictor variables used varied[3]. Travaini addresses this by dividing his screening study into three steps[1]. The first step is to set the criteria for testing the level of risk by first examining the characteristics of the dataset itself and then testing whether the authors used data preprocessing or cross-validation in their study (CV) and other ML techniques to screen the literature. In the second step, the type of recidivism that each study aimed to predict is analyzed, and then the best-performing ML model is selected. Finally, the studies are classified into four categories based on their purpose and the performance of each ML model is compared based on specific metrics. (CV: is a technique for estimating whether an ML model can correctly predict data that has not yet been observed).
2.2. Comparison and Inspiration
Subsequent to an initial review of the literature. The models and methodology for comparing the respective literature are interconnected through progressively intricate recursive logic.
2.2.1. Topics in Male and Female
Study a single variable and apply one single model. An article by Knaap et al. explores the hotly debated topic of the validity of predicting the criminogenic needs of male and female offenders using modern mechanistic learning. It compares the relative impact of gender-specific needs on the prediction of recidivism. The study highlights that most risk assessment tools have been developed using predominantly male samples, leading to the assumption that they are gender-neutral in their application to female offenders[4].
Knapp et al.'s study utilizes a large sample drawn from a sample of 16,239 male and female offenders charged with various offenses. To bolster the trustworthiness and universality of the model across diverse populations, his finding proposes that while existing assessments exhibit gender neutrality, particular offense-related needs exhibit distinct predictive impacts depending on gender[4]. Contrary to previous study results from Eisenbarth et al., his research indicates that problems related to accommodation, education, and friendships are more highly correlated with male recidivism. Conversely, emotional health problems are more strongly correlated with recidivism for females [4,5]. The article is adequately prepared for the variables and intends to provide insight into the significance of gender-specific variables through traditional gender-neutral logistic regression models.
For females, emotional health is the most important variable predicting recidivism rates, implying that interventions targeting mental health, anxiety, and depression may be particularly effective in reducing female re-offending rates. Education and work-related matters also have an impact, albeit with weaker associations, implying that, while these areas demand attention, addressing them alone may not be enough to prevent recidivism if emotional well-being is neglected. Conversely, the significance of family and partner relationships and accommodation as crucial factors within traditional cognitive interventions is found to be relatively diminished, indicating a potential need for a reevaluation of the conventional approaches toward addressing female offenders[4].
For males, criminal history is the strongest predictor of male recidivism. Men with a history of frequent offending have high rates of recidivism. This suggests that criminal justice interventions should focus comprehensively on the rehabilitation and ongoing monitoring of individuals with extensive criminal backgrounds. Substance abuse is also a major contributing factor to male recidivism, particularly about alcohol and drug abuse. Accommodation and employment are also crucial. Without stable housing or employment, male offenders are more likely to return to crime. This is consistent with the predictions of Walters, Deming, and Carbon's study of male social relationship variables and similarly suggests that strategies to improve male offending should focus on cognitive behaviours that promote decision-making, reduce impulsivity, and reshape attitudes toward authority[6].
Overall, this study suggests that while assessment tools work equally well for both genders, specific recidivism needs may require more nuanced consideration. Problems related to accommodation, drugs, and friendships are more highly correlated with male recidivism. In contrast, emotional health problems are more strongly correlated with recidivism for females.
2.2.2. Topics in Race
Study of a single variable with multiple models comparing effects. The research conducted by Lang and Ariella centers around the race variable, particularly African Americans and other racial groups. The study employs an applied model that incorporates empirical research to examine taste-based discrimination, as well as modern regression to analyze statistical discrimination and categorize the reasons for displaying discrimination.
To begin, one must refer to the definition of discrimination[7]. Economics Perspectives analyzes racial discrimination in the labour market and the criminal justice system from an economic standpoint, with a specific focus on the discrimination faced by black individuals. The author analyses two dominant models of discrimination: taste-based discrimination and statistical discrimination. Different models are used for each of these two types of discrimination to study the effects of discrimination. Firstly, Taste-based discrimination refers to bias-driven behaviour, where individuals or firms make decisions based on personal biases or invalid assumptions. The authors focus on empirical research to show how this discrimination manifests itself, drawing evidence from employment practice studies (e.g., audit and correspondence studies) and criminal justice outcomes. Secondly, statistical discrimination is based on generalizations drawn from statistical evidence, using racial characteristics as a proxy for factors such as productivity or criminal behaviour.
However, the inspiration from Breiman's article relates to ML improvement and encourages Lang to adapt to the possible improving area in the future[7,8]. To settle down the incomplete data, identifying discrimination as a cause of racial disparities is challenging because differences in outcomes can also result from factors such as individual preferences or differences in ability. Furthermore, the challenge of distinguishing between discrimination still exists. It is difficult to separate the effects of discrimination from other social and economic factors affecting the labour market and the justice system.
2.2.3. Topics in Predictive Performance
Finally, examining two variables with interaction term effects: misdemeanor and priors, using multiple model predictions to compare the effects of traditional and modern approaches (logistic regression analysis vs. linear discriminant analysis). Tollenaar and Heijden’ study concentrates on variables: misdemeanor, priors, especially the interaction effects. His research idea begins with the development of predictive models to predict recidivism rates for three types of offenses: general recidivism, violent recidivism, and sexual recidivism, using the criminal population conviction histories of recent offenders[9]. The research question is whether modern statistical, data mining, and machine learning prediction techniques can improve predictive performance compared with traditional statistical methods. The study uses data from Dutch offenders and evaluated the models based on performance metrics, such as accuracy, AUC (area under the curve), and RMSE. The conclusions show that classical statistical models such as logistic regression and LDA typically perform as well as, if not better than, machine learning models such as Support Vector Machines (SVMs), Neural Networks, and Random Forests. However, there are slight differences depending on the type of recidivism predicted, with LDA performing best for sexual recidivism and Logistic Regression performing well for general and violent recidivism. For general and violent recidivism, there are only minor differences in the predictive performance of the techniques, whereas for sexual recidivism, the differences are larger[9].
Additionally, Tollenaar and van der Heijden's study presents a more precise identification of multiple models. Logistic regression, as a classical statistical method, is also adopted by the research in this essay as it performs well and is easy to interpret in predicting general and violent recidivism, although it is limited in dealing with non-linearity without pre-prepared data transformations. Linear Discriminant Analysis (LDA) performs well in low sample situations (sexual recidivism), but it assumes that classes are normally distributed and have equal covariances, which is not always true[9]. More modern techniques, like introducing k-NN and Machine Learning and Data Mining Models, such as Random Forest Models, have more flexibility, which means that non-linearity, noisy data and complex interactions can be analyzed without specification[10]. Besides, performance is more advantageous when faced with more complex datasets. Nonetheless, it is crucial to acknowledge the existing problems concerning overfitting and interpretability.
In summary, Tollenaar and van der Heijden's research points out that while modern machine learning models are considered state-of-the-art in many areas, classical statistical methods such as logistic regression and LDA perform as well as, if not better, in predicting recidivism[9]. These methods offer better interpretability, reliability, and ease of use. However, as data becomes more complex, or when working with smaller, more specific datasets, machine learning methods may offer advantages if carefully adapted and applied.
3. Data Analysis
3.1. Data Introduction
We collected a total of 6,172 individual samples. In the collected data, except for one response variable, we have nine dummy variable and one numerical variable:
Table 1. Variable Description
Variable | Description |
Recid | Reoffending in two years (Dummy) |
female | The individual is female (Dummy) |
old | The individual's age is over 45 at time of offense (Dummy) |
young | The individual's age is under 25 at time of offense (Dummy) |
priors | Number of prior convictions (Numerical) |
misdem | Current offense is misdemeanour (Dummy) |
asian, hisp, af_am, nat_am, other | Dummy variables for race |
3.2. Data Processing
In the Data processing part, some necessary data processing methods are applied, such as the removal of missing "NA" data. Because some dummy variables are very relevant, they are combined to become categorical variables:
Table 2. Categorical Variables Description
Variable | Description |
Gender | Based on 1 dummy variable "female", include female and male/minority. |
Age_range | Based on 2 dummy variables "old" and "young", include "below 25", "25-45", "above 45". |
Race | Based on 5 dummy variables of race, include "asian", "hisp", "af_am", "nat_am", "other", and "na" |
The remaining variables continue to play their original role in the model.
3.3. Data Visualisation and Analysis
In order to see a clear picture, data visualization is put into practice surrounding the data. The calculations of the recidivism rate are all rounded to two decimal points. By calculating the recidivism rate of gender (shown in Figure 1) — female and non-female, a clear discrepancy between female and non-female recidivism rates can be perceived. Whereas 35.15% of the female collected re-offended, 47.95% of non-female re-offended. That's a 12.8% difference between the recidivism rate between genders. Inferences drawn from the data might conclude that non-females often have a higher possibility to re-commit crimes, or it might lead to a conclusion that non-females are more prone to be accused of committing crimes. The latter inference might be the result of stereotypes and bias where people,, in general,, found the males to be a more likely offenders because of their masculinity and strength.
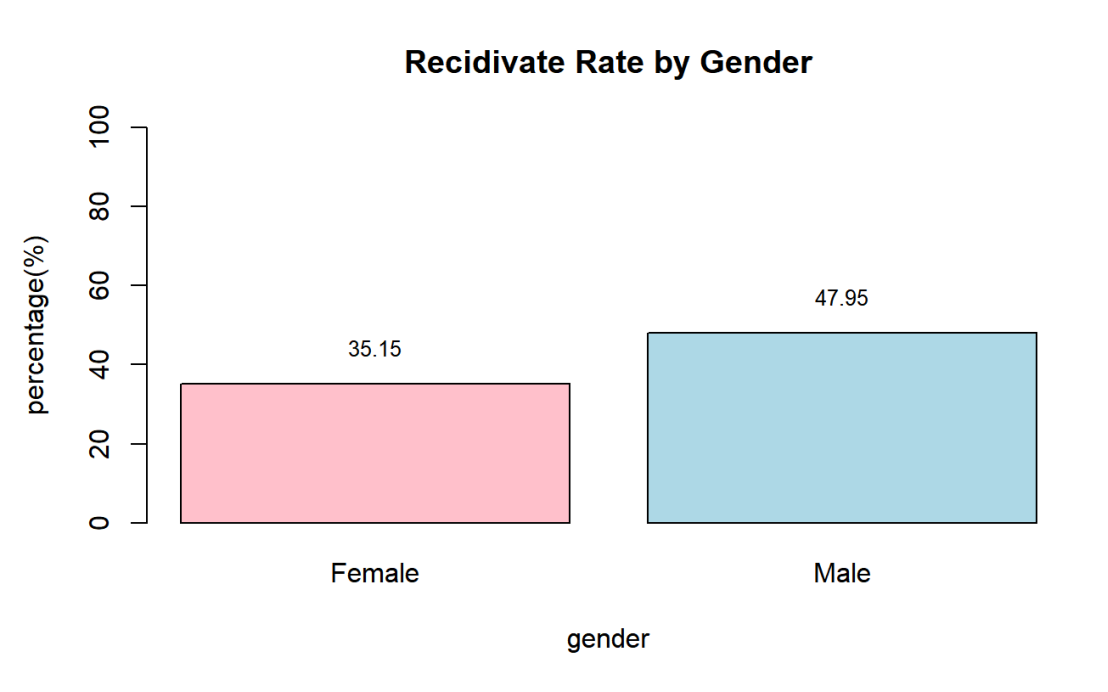
Figure 1. Recidivate Rate by Gender
The analysis of recidivism rate sorted by ethnicity(Figure 2) founded that African-American people has the greatest rate of recidivism, 52.31%, whereas Asian has the lowest rate of recidivism, 25.81%. The rate of recidivism has doubled from Asian to African-American. There are several causes to this problem. First is the third factor such as education level, that’s constructing the differences. Second is the discrimination and bias held by decision-makers. These results may be in part due to the bias people hold to be more likely to verdict and sentence the African-American people. Due to the mindset people and society have accumulated from experience, they might consider one group of people to be more dangerous than others. However, when these thoughts have evolved into the justice system, they may unavoidably cause unbalance and problems in fairness. If the prior court decisions were all based on bias mindsets, then our analysis that's build upon them would be problematic. In Figure 2 the separation of the gender within the ethnicity groups shows the difference of recidivism among genders. It clearly indicates that among all the ethnic groups, male display higher, and most of the time a lot higher, than female to reactivate.
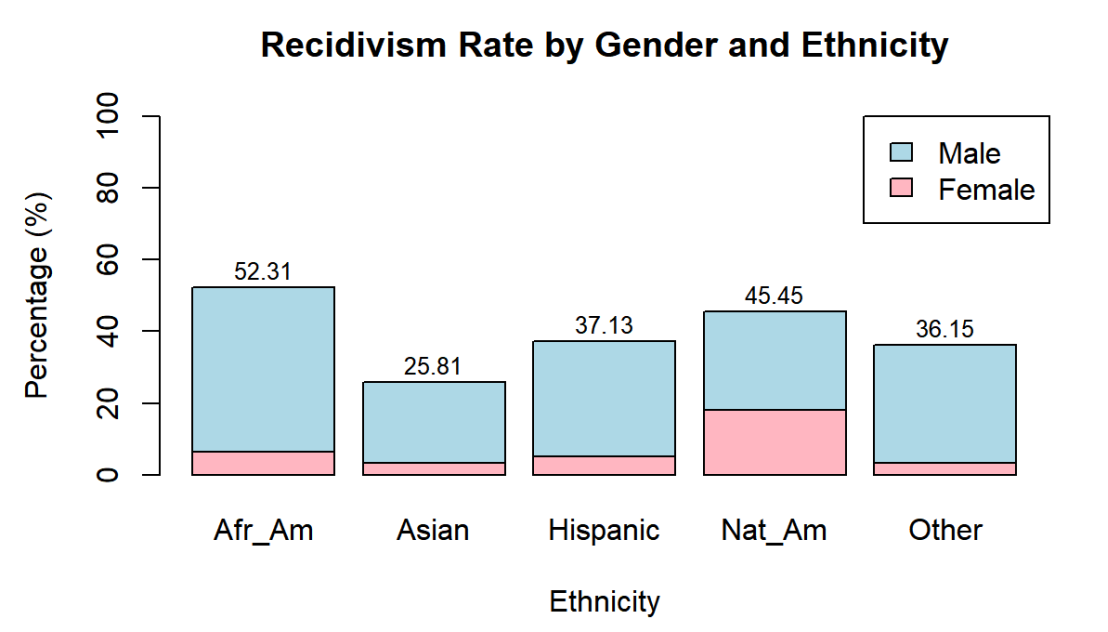
Figure 2. Recidivism Rate by Gender and Ethnicity
Figure 3 presents the behaviors of individuals whose most recent crime was a misdemeanour compared to those who committed more severe offence. Based on the visualized data, when the most recent crime is a misdemeanor, 37.47% of the individuals are re offended, while when most recent crime was a more serious offense 64.3% of them recidivates. This suggests that the data-set skews toward more severe crimes, highlighting a greater chance for those involved in major offenses to recommit crimes. Bias of past decisions might be indicated because people are prone to decide a person to be dangerous when past records of offense are serious, so as to verdict a crime.
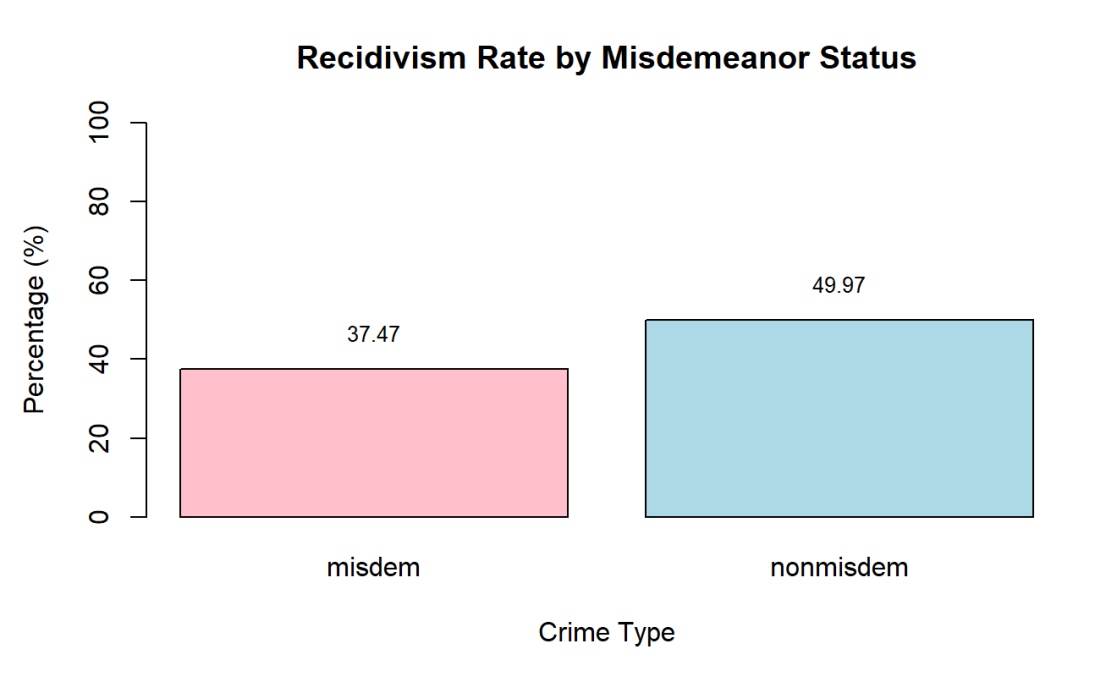
Figure 3. Recidivism Rate by Misdemeanor Status
Figure 4 visualize the re-offending rates across different age groups: individuals above 45 (Old), those between 25 and 45 (Mid-aged), and those under 25 (Young). The figure reveals that individuals in the young age group are more likely to reoffend, 55.98% of them recitatives. The mid-age follows with a reoffending rate of 46.46%, and the above-45 group has the lowest reoffending rate at 32.02%. This data shows a significant age-related difference in reoffending, with younger and middle-aged individuals having a higher likelihood of re-offending compared to older individuals. These insights might be crucial for crafting age-targeted interventions in the criminal justice system to reduce recidivism.
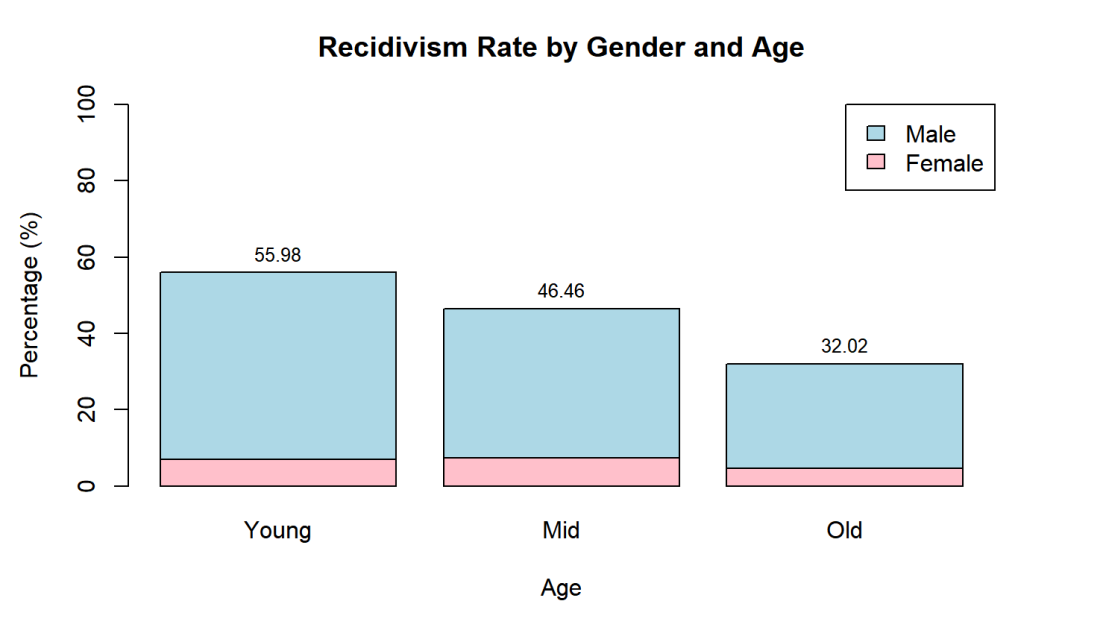
Figure 4. Recidivism Rate by Gender and Age
As shown in Figure 5, the recidivism rate increases as prior crime number increases. When sort the prior crime number into 4 categories, a steady raise of recidivism rate is shown from half the possibilities to 100 percent. The color difference represents the genders that made up the percentage of recidivism rate. The female gender varied slightly as the number of prior crimes altered, but the male gender's recidivism rate experienced surge in rate every time the prior crime number increases.
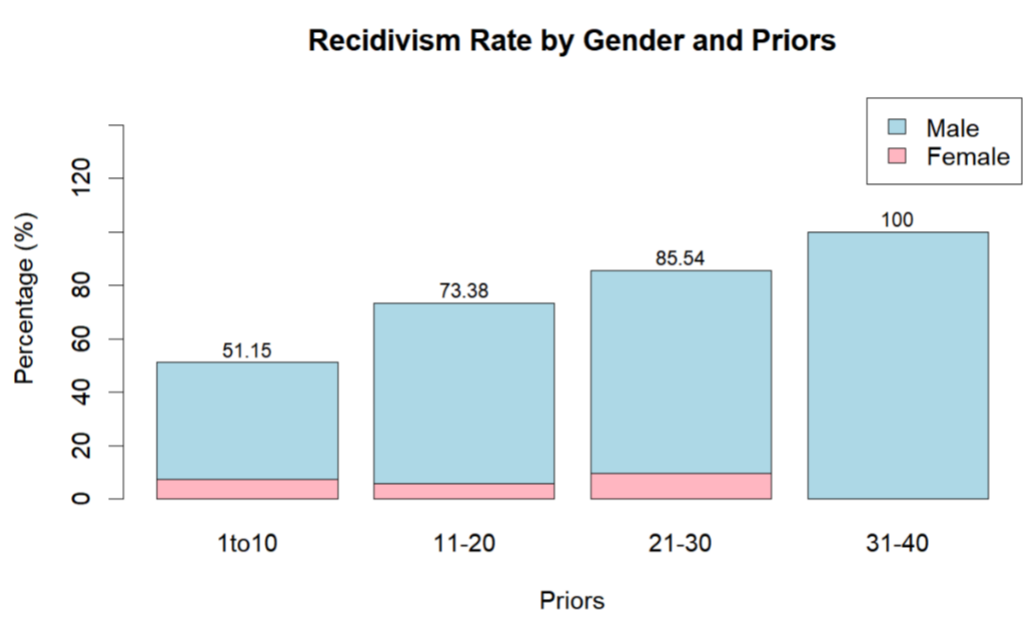
Figure 5. Recidivism Rate by Gender and Priors
4. Methodology
This analysis uses a number of machine learning methods to predict recidivism; however, the fine-grained analysis of interaction effects will be done using a logistic regression model. Its major objective will be to examine variability in the age effect of recidivism across gender, in a way that any differential effects get properly and equitably captured within the model. Firstly, the general patterns of the data were examined with the k-Nearest Neighbors model. Then, key predictors of recidivism were identified with the Random Forest model.
4.1. Logistic Regression Model
As this research is predicting binary outcomes, whether an individual recommits or not, the logistic regression model was chosen for this analysis to investigate the interaction of gender and age. This interaction term enables an analysis to be performed that investigates whether the relationship between age and recidivism varies for men and women-a key factor in ensuring that any predictive model does not inherently favour one gender over another.
Logistic regression is a statistical method for predicting binary outcomes. It uses the logistic function to model the probability that an observation belongs to one of two classes, which in this research is defined as:
\( log{(\frac{p}{1-p})}={β_{0}}+{β_{1}}{x_{1}}+{β_{2}}{x_{2}}+{β_{12}}{x_{1}}{x_{2}}+…+{β_{n}}{x_{n}} \)
Where \( p \) is the probability of the outcome being “1” (success), \( {β_{0}} \) is the intercept term, \( {β_{n}} \) are the coefficients for the predictor variables \( {x_{n}} \) , \( {β_{ij}} \) is the interaction coefficient. The coefficients are estimated using a method called maximum likelihood estimation which finds values for the coefficients that maximize the likelihood of the observed data. The coefficients can be interpreted as the change in the log-odds of the outcome for a one-unit change in the predictor variable, holding all other variables constant. The log-odds are the natural logarithm of the odds, which are the probability of success divided by the probability of failure. To make a prediction, the logistic regression model calculates the log-odds for an observation using the estimated coefficients and the predictor variables. It then applies the logistic function to convert the log-odds to a probability. If the probability exceeds a certain threshold, the model predicts class “1”; otherwise, it predicts class “0”.
This research used the revised logistic regression model, which incorporated an interaction term to test the interaction effect between variables. If the interaction coefficient ( \( {β_{12}}…{β_{ij}} \) ) significantly different from zero, then it indicates that the effect of \( {x_{1}} \) on the outcome depends on the level of \( {x_{2}} \) and vice versa. A positive interaction coefficient suggests that the positive effect of \( {x_{1}} \) on the outcome is strengthened (or the negative effect is weakened) as \( {x_{2}} \) increases. A negative interaction coefficient suggests that the positive effect of \( {x_{1}} \) on the outcome is weakened (or the negative effect is strengthened) as \( {x_{2}} \) increases. The interaction effect means that the impact of one predictor on the outcome variable is not constant but depends on the level of the other predictor with which it interacts.
This research chose the logistic regression for the following reasons. First, this research predicts the binary outcomes that whether an individual recommits or not, and the dataset that was used contains binary variables. Thus, the logistic regression, which is specifically designed for modelling binary outcomes becomes the suitable choice for this research.
Second, the logistic regression model has various virtues, including high interpretability and high efficiency, and its methodology is well-established. All of which contribute to this analysis greatly.
4.2. Random Forest Model
The Random Forest model is an ensemble learning method used for classification and regression tasks. To use the model, first, the dataset is split into a training set and a test set. During the training phase, multiple decision trees are constructed, each trained on a random subset of the data drawn with replacement (bootstrap samples) and considering only a random subset of features at each split to increase diversity. This process introduces randomness and reduces variance, helping to avoid overfitting. After all the trees in the forest are trained, the model makes predictions by aggregating the results from all the individual trees, either through majority voting for classification tasks or averaging for regression tasks. The final prediction is then applied to the test set to evaluate the model’s performance.
5. Analysis and Results
5.1. Logistic Model Summary
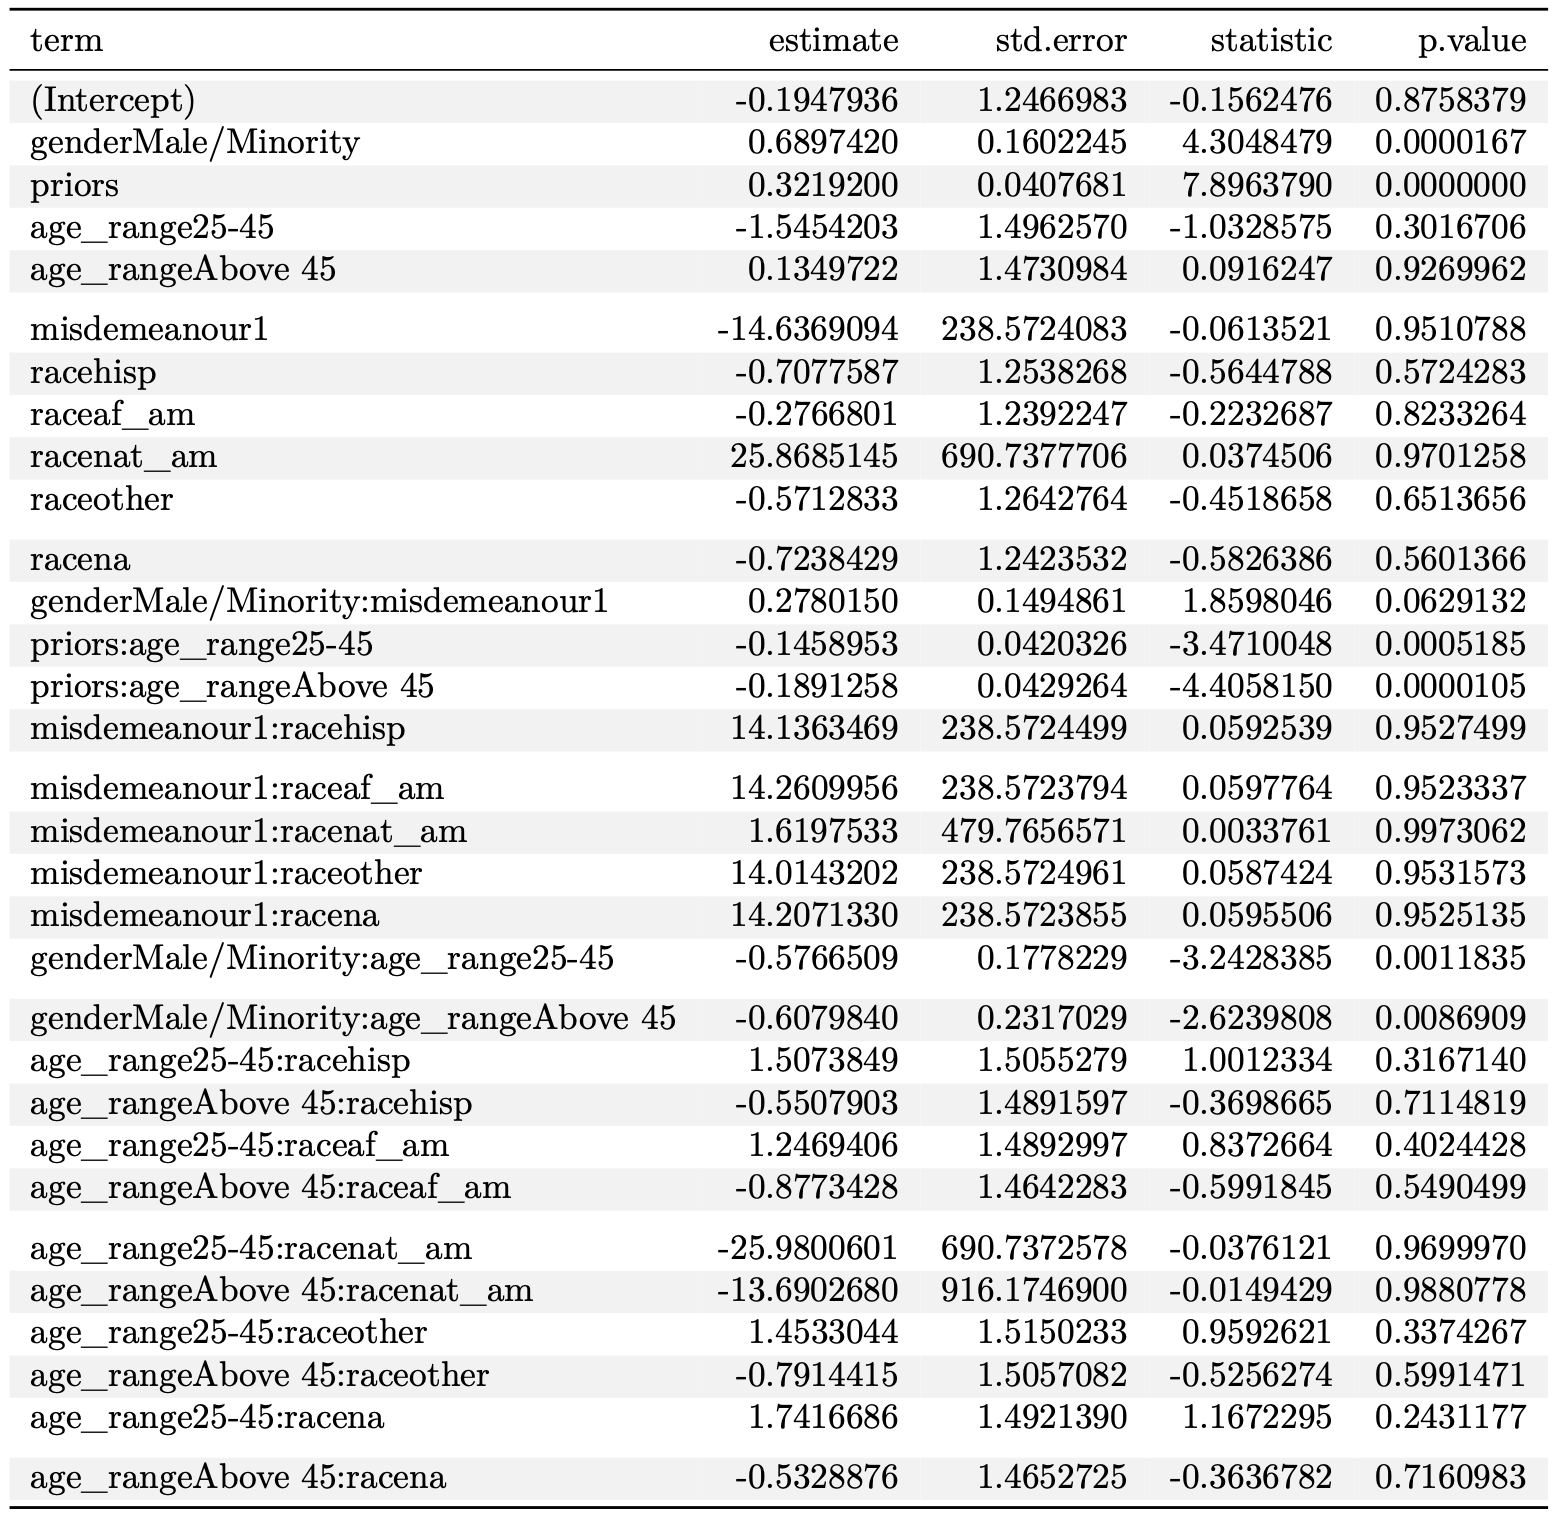
Figure 6. Logistic Model Summary
The logistic regression model reveals several significant predictors of recidivism. Being male significantly increases the odds of reoffending, as does having prior offenses. Age alone does not significantly impact recidivism, but its interaction with prior offenses indicates that older individuals with prior offenses have reduced odds of reoffending. Gender and age interactions show that the effect of being male decreases as age increases, particularly for those aged 25 and above. While race categories and misdemeanors show large estimates, their lack of statistical significance suggests these factors alone do not strongly predict recidivism in this model. However, some interaction terms, such as gender, interaction with misdemeanours, and have marginal effects. Overall, the model underscores the importance of gender, prior offenses, and their interactions with age in predicting recidivism.
5.2. Model Selection
The AIC and BIC model selection results are presented. Due to the large sample size, the BIC criterion is considered more appropriate for model selection. Consequently, the variables identified by the BIC as the most significant predictors are utilized to construct an updated logistic regression model, ensuring a more parsimonious and reliable fit for the data. This approach leverages the strengths of BIC in handling larger datasets by prioritizing model simplicity without compromising predictive accuracy.
Table 3. AIC and BIC result comparison
Method | Selected Variables |
AIC | "gender", "priors", "age_range", "misdemeanour", "race", "gender:misdemeanour", "priors:age_range", "misdemeanour:race", "gender:age_range", "age_range:race" |
BIC | "gender", "priors", "age_range", "misdemeanour", "priors:age_range" |
5.3. Logistic Model After Model Selection:
The new model contains all significant variables as their confidence interval does not include 1.
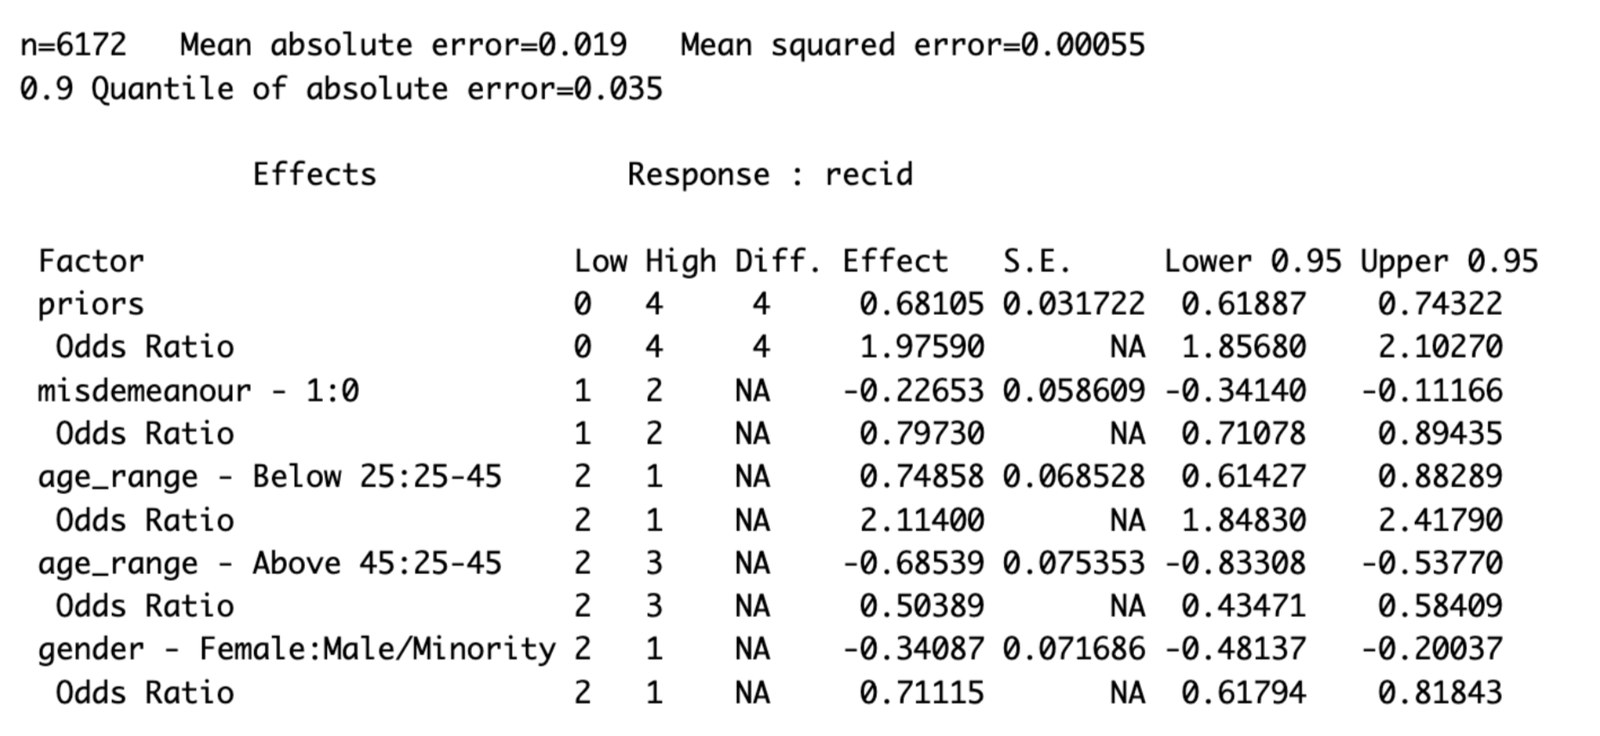
Figure 7. Summary of new logistic regression model
5.4. VIF of New Model
A Variance Inflation Factor (VIF) measurement was conducted to assess multicollinearity in the model. The results indicate that no variables with high VIF values were identified, suggesting that no significant multicollinearity is present in the model.
Table 4. Variance Inflation Factor measurement result
Variable | GVIF | DF | GVIF^(1/(2*Df)) |
Priors | 1.723698 | 1 | 1.312897 |
Misdemeanour | 1.568855 | 1 | 1.252540 |
age_range | 4.442800 | 2 | 1.451825 |
gender | 5.541154 | 1 | 2.353965 |
5.5. Model Calibration and Cross-Validation
Following the fitting of the model based on the BIC results and subsequent steps, model calibration was performed. The resulting graph (Figure 8) indicates that the model is well-calibrated, predicting probabilities that closely align with the actual observed probabilities across most ranges.
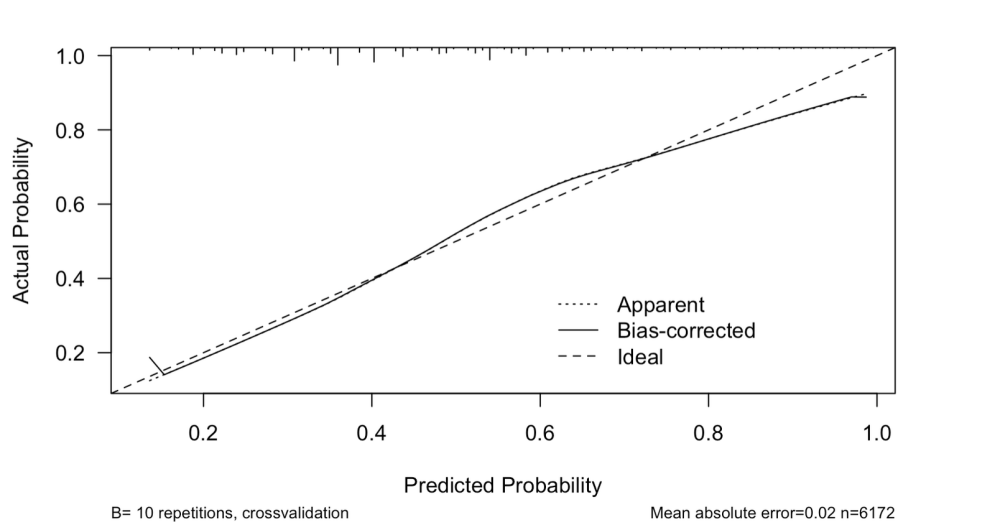
Figure 8. Model Calibration Result
5.6. Random Forest Model
In order to make comparisons and to cope with different situations, a random forest model is fitted. The summary of the random forest model indicates moderate performance, with an out-of-bag (OOB) error rate of 33.36%. The model demonstrates a greater ability to predict non-reoffenders (class 0) compared to reoffenders (class 1), exhibiting class-specific error rates of 28.6% for non-reoffenders and 39.03% for reoffenders.
Table 5. Confusion Matrix of Random Forest Model
0 | 1 | class.error | |
0 | 1676 | 671 | 0.2858969 |
1 | 770 | 1203 | 0.3902686 |
5.7. Contrast in ROC Curve
According to figure 9, the two ROC curves indicate that the logistic model has an AUC of 0.72, compared to an AUC of 0.70 for the random forest model.
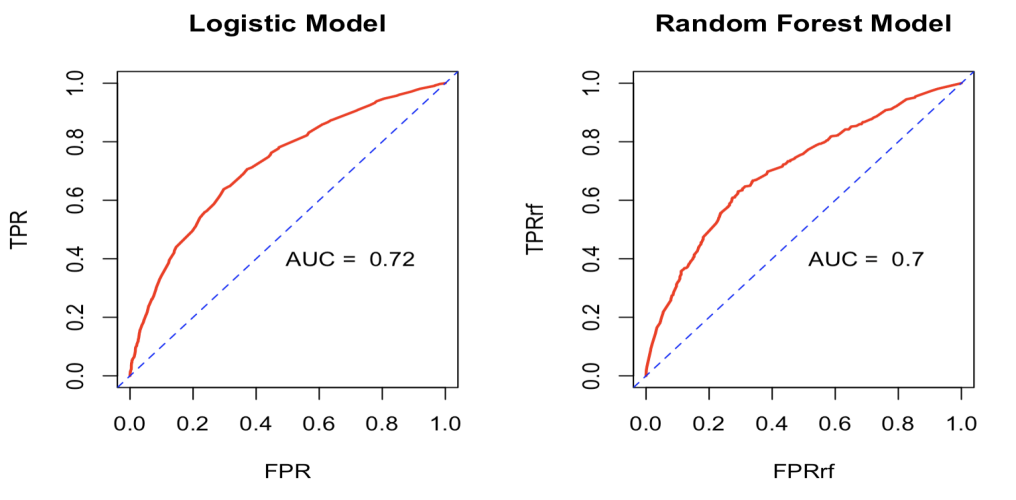
Figure 9. ROC Curves of two Models
Overall, both models demonstrate reasonable performance. The logistic regression model exhibits slightly better discriminatory power; however, the choice between the two models may depend on specific use cases requirements, such as the need for interpretability, the ability to handle non-linearities or resistance to overfitting.
6. Discussions
6.1. Logic Discussion
In response to the ongoing debate regarding the significant factors influencing recidivism rates, The objective of this paper is to enhance the accuracy of the machine model's predictions by utilizing a limited set of variables. The discussion section is divided into two parts in total.
6.1.1. Reasons for Methodologies
In part one, after the model selection and the models that were ultimately fitted on the complete data sets phase, we shall describe the reasons why these models are here. With the helping explanation from another article written by Tollenaar and van der Heijden, the main purpose of utilizing logistic regression is to address binary classification problems that involve categorical variables, where the target variable can have two distinct outcomes (such as recidivism: 1 or 0). It estimates the probability of an outcome by modeling the relationship between the dependent variable and one or more independent variables. Thus, it is more useful to understand the effect of prior offenses and race on recidivism[11]. The rationale behind employing the Random Forest Model lies in its status as a potent ensemble learning method that leverages multiple decision trees to elevate prediction accuracy. In comparison to logistic regression, it possesses the capability to handle a higher number of predictors, thereby facilitating the management of intricate interactions between features while preventing the overfitting of data points. It not only lists the importance of features to filter the most important variables but also helps to capture non-linear relationships in the data. Moreover, by assessing both the logistic regression model and the random forest model, two well-established statistical methodologies, the outcomes presented in this manuscript establish a robust rationale for the validation and complementary nature of the aggregate accuracy and precision of the findings. Despite the poor interpretability of the random forest model, it further explores the interaction of the logistic regression's important variables.
6.1.2. Logic Comparison
Understanding the basic information about the model and the reasons for choosing it, following this, the philosophy of the whole study is the vital thing to be determined in part one, to construct the framework. When making comparisons related to methodology and the logic of research. To explore one of our main objectives of this research, the main factors affecting recidivism rates, through comparing Travaini and van der Heijden's logic with us, introducing a rigorous principle or the study: The PRISMA Statement, which provides synthesized and comprehensive guidelines aimed at helping researchers improve the reporting quality of systematic reviews and meta-analyses[1]. However, the study, according to Travaini, has omitted more of the subsequent criteria: (a) the principal objective of the study was to mitigate bias in the machine learning model but ignore such as bias based on ethnicity and education factors. (b) The study was deficient in the necessary accuracy (ACC) or area under the curve (AUC) metrics to evaluate the machine learning model.
Therefore, based on the PRISMA Statement and concerning the research of Alsaleh et al. when doing statistics in the field of artificial intelligence[12], the methodology for complementing the systematic review is logically introduced. The first step is to set the criteria for testing the risk level, first examining the characteristics of the dataset itself, and then ML techniques such as data preprocessing or cross-validation (CV) are used. In the second step, the predicted types of recidivism and other variables are categorized and then the best-performing ML model in the study is selected. Finally, the purpose of the study is refined into three progressive levels with feedback mechanisms to examine the performance of each ML model based on specific metrics. The number of predictor variables used varies as each dataset worthy of reference study has a different level of integration with, for example, historical risk assessment data. By fulfilling the above complementary settings, our research improves its ability to cope with complex realities.
6.2. Results and Limitations Discussion
In the second part, the results and shortcomings of this study are compared with three different articles in terms of methodology, bias, and tool criteria for predictive performance, and possible ways of improvement are suggested. Initially, by drawing comparisons between research methodologies and diligently focusing on tools and limitations.
6.2.1. Discussion about Methodologies
In reference, Knapp and Spitzer's study focuses on the current debate about the relative impact of gender-neutral risk factors in predicting recidivism among female offenders, and the total study concentrates on a single variable, gender, and uses logistic regression as the analytical tool. It is worth noting that their study actively delineated the severity of offenses into general or violent re-offending two types and chose them as the dependent variables[4]. One the contrary, this paper contemplates the concept of a misdemeanor, but only collects and uses records on the degree of the first offense and uses it as one of the independent variables to predict general re-offending. The reason for this distinction lies in the divergent research objectives of the two articles. The primary aim of this paper is to examine and forecast the overall probability of re-offending within a sizable and heterogeneous group of offenders encompassing various causal factors. Past data trend analyses merely constitute a single facet of this comprehensive study. However, it is important to highlight that the study in question relied on a data collection of only 6172 individuals, whereas Knapp's study utilized a much larger sample size of 16,239 offenders in the Netherlands. The assessment of recidivism risk in the latter study was done using the comprehensive Risk Assessment Scale for Recidivism (RISc), thus underscoring the limitations of the former study's small and incomplete dataset.
In this paper, using the risk and needs assessments have similar predictive validity for both males and females in terms of general recidivism, consistent with previous studies [13-15]. Moreover, although each of the criminogenic needs prevalence is gender specific, with some more common among men and some more common among women, all risk factors are positively (and in some cases weekly) associated with general recidivism for both men and women. Several significant differences emerged in the strength of these relationships with accommodation, education, and work, and relationships with friends being more strongly associated with general recidivism among males than females. Emotional problems are more strongly associated with future general recidivism among females than among males, but the magnitude of these gender differences was limited. However, due to the missing collection of variables, Knapp and Spitzer's study purposely states that the significantly different variables include accommodation, as well as relationships with friends, and whether they have children is not validly demonstrated in this paper[4]. In terms of the analytical tools used, this study uses a more modern model. In addition to the common logistic regression model, this paper uses a random forest model to screen the variables, which has a significant increase in model accuracy but is less interpretable than the Knapp’s study using the Risk Assessment Scale for Recidivism (RISc) focusing on the gender.
Finally, the limitations of this paper and Knapp’s due to both using logistic regression are that both are male-centered risk instruments, and the assessment tools used in the study are developed primarily for male offenders, which raises concerns about their validity for females. Logically, addressing women's emotional issues should reduce recidivism rates for both male and female offenders, but the research data suggests that this has little to do with reducing recidivism rates for male offenders. The research recognizes that while these tools are good predictors of recidivism for both male and female offenders, they may not consider the full range of female-specific criminogenic needs, such as emotional well-being and social relationships. The correlation is weaker for female offenders: although emotional well-being is more strongly correlated with recidivism for females compared to males, the overall correlation is still weak, which questions its clinical relevance, so further refinement of the surveys is needed to categorize the dependent variables.
6.2.2. Discussion about Bias in Raw Datasets
In regard to the second reference, when making a comparison, it pertains to the bias present in the raw dataset. Lang and Spitzer's article focuses on the variable of race, uses a regression model with a dummy variable for race to measure discrimination, and employs a broader experimental approach like the Natural Experiments study of blind audits of a symphony orchestra as well as an audit study that included the use of fictitious resumes with racially suggestive names to detect employer bias[7]. This inspired us to use multiple models and multiple experimental approaches, but as the above traditional experimental approaches are biased because of the characteristics of being time-consuming and costly. Following this are the difficulty of implementation and technical shortcomings. These studies also attempt to isolate racial bias, but they cannot fully match all characteristics of job applicants, and names may not only represent race, and the results may capture broader biases that are not related to race, thus exaggerating the extent of racial discrimination. Blanden, Doepke, and Stuhler's study also indicated that initial educational inequality affects the entrenchment of the racial contract[16]. Not to mention the inability to generalize to other industries or social environments, thus limiting the broad applicability of the findings. Inspired by Lang's study, adapting a more modern approach like logistic regression and linear discriminant analysis is able to improve model accuracy as much as possible.
However, both the results of this essay and those of Lang are disturbed by Statistical Discrimination, as mentioned previously: Economists have traditionally modeled statistical discrimination as fully rational [8,17]. Conversely, they have viewed inferences and actions based on false beliefs as a form of prejudice akin to taste discrimination. This brings with it corresponding limitations[7]:
(a) Reliance on observable data leads to statistical models (e.g., those using regression analyses) that often rely on observable variables, such as age, education, and ethnicity. Unobservable factors, such as personality traits or informal social networks, are difficult to consider. This may lead to overestimation or underestimation of the true extent of discrimination due to the omission of important variables.
(b) Complex interactions: Discrimination cuts across domains (education, housing, and criminal justice) and is interrelated in self-reinforcing cycles. This makes it difficult to single out causes.
(c) Challenges of proving causation: A correlation between race and an outcome, such as wages or arrest rates, does not necessarily imply causation. It is difficult to distinguish discrimination from other factors, such as personal choice or socioeconomic background. It is possible to attribute disparities to discrimination when other factors (e.g., different job preferences) also explain the disparities.
6.2.3. Discussion about Tool Criteria
In reference three, when making a comparison to explore the tool's predictive performance. Tollenaar and van der Heijden's article is a combined study of multiple variables and multiple models, focusing on exploring which models perform best in predicting general recidivism, violent recidivism, and sexual recidivism using different methods such as logistic regression, linear discriminant analysis (LDA), machine learning techniques, and data mining methods. It fills in the gaps in previous research that be vague about the best-performing models for different levels of crime. This shows that logistic regression is the best-performing model for general recidivism and slightly outperforms modern methods such as MARS and LDA. For violent recidivism, logistic regression and LDA are the best-performing models, with adaptive enhancement models also performing well. For sexual recidivism, LDA performs best, followed closely by partial least squares (PLS), while logistic regression performs poorly[9]. Tollenaar and van der Heijden's article contains both classic and modern research approaches, and in contrast to this paper's approach, the logistic regression model and the random forest model were chosen to screen for important variables, and the predictive results are close to the same as those found in his study.
The purpose of this study is to improve the accuracy of machine judgment as much as possible in a limited number of variables, and according to Loonget al.'s research, “predictive performance” plays a vital role in feedback correction, so both studies use AUC (Area Under the ROC). Curve): Definition: AUC measures the model's ability to distinguish between recidivists and non-recidivists[18]. It quantifies the trade-off between true positives and false positives at various thresholds. Furthermore, it sheds light on the detection mechanism in this paper: multiple criteria should be applied, and various performance metrics should be used to evaluate the model, including the AUC, accuracy, RMSE, and calibration. Any single criterion is not sufficient to fully judge the performance of the model.
This comparison also leads to the limitations of this paper: The study mainly uses static factors (e.g., age, prior convictions), which limit the ability of the model to account for dynamic changes (e.g., post-sentence rehabilitation). Also, there is still a single feedback mechanism that does not focus on SAR and calibration. SAR is the decisive criterion because it combines multiple performance dimensions into a single score. Focusing on calibration, good calibration (both overall calibration and calibration around the 0.5 threshold) is critical for models used in criminal justice settings where decisions are made based on predictive probabilities.
7. Conclusion
To summarize, introducing a more comprehensive screening and feedback system have logically upgraded this research based on the PRISMA principle, synthesized the strengths of the three articles in our research approach, and see several areas that can be upgraded in the future in terms of categorization of variable collection, multiple feedback testing mechanisms, and instrument neutrality concerning specific variables. Furthermore, according to the reference comparison stated above, three possible ways to improve research in the future are also proposed.
(a) Improving by considering female-specific criminogenic needs, such as emotional well-being and social relationship factors.
(b) Not only use machine judgment, but also apply border ways to gather data and do the experiment. Rigorous distinction between correlation and causation, with attention to assumptions such as control variables where multiple experimental approaches are taken.
(c) Data preparation, applying multiple criteria and using various performance metrics to evaluate the model.
The initial purpose of exploring the important variables related to recidivism, improving the accuracy of machine learning model predictions as much as possible by taking into account interaction effects in a limited number of variables and providing predictive performance feedback for future work has been achieved.
References
[1]. Gagliardi, G.J. et al. (2004) ‘Forecasting recidivism in mentally ill offenders released from prison.’, Law and Human Behavior, 28(2), pp. 133–155. doi:10.1023/b:lahu.0000022319.03637.45.
[2]. Travaini, G.V. et al. (2022) ‘Machine Learning and criminal justice: A systematic review of advanced methodology for recidivism risk prediction’, International Journal of Environmental Research and Public Health, 19(17), p. 10594. doi:10.3390/ijerph191710594.
[3]. Mu, D. et al. (2024) ‘Prediction of recidivism and detection of risk factors under different time windows using Machine Learning Techniques’, Social Science Computer Review [Preprint]. doi:10.1177/08944393241226607.
[4]. van der Knaap, L.M. et al. (2012) ‘The predictive validity of criminogenic needs for male and female offenders: Comparing the relative impact of needs in predicting recidivism.’, Law and Human Behavior, 36(5), pp. 413–422. doi:10.1037/h0093932.
[5]. Eisenbarth, H. et al. (2012) ‘Recidivism in female offenders: PCL‐R lifestyle factor and Vrag show predictive validity in a German sample’, Behavioral Sciences & the Law, 30(5), pp. 575–584. doi:10.1002/bsl.2013.
[6]. Walters, G.D., Deming, A. and Casbon, T. (2014) ‘Predicting recidivism in sex offenders with the Psychological Inventory of Criminal Thinking Styles (picts)’, Assessment, 22(2), pp. 167–177. doi:10.1177/1073191114539384.
[7]. Lang, K. and Spitzer, A.K.-L. (2020) ‘Race discrimination: An economic perspective’, Journal of Economic Perspectives, 34(2), pp. 68–89. doi:10.1257/jep.34.2.68.
[8]. Breiman, L. (2001) Machine Learning, 45(1), pp. 5–32. doi:10.1023/a:1010933404324.
[9]. Tollenaar, N. and van der Heijden, P.G. (2012) ‘Which method predicts recidivism best?: A comparison of statistical, machine learning and Data Mining Predictive Models’, Journal of the Royal Statistical Society Series A: Statistics in Society, 176(2), pp. 565–584. doi:10.1111/j.1467-985x.2012.01056.x.
[10]. Henley, W.E. and Hand, D.J. (1996) ‘A K-nearest-neighbour classifier for assessing consumer credit risk’, The Statistician, 45(1), p. 77. doi:10.2307/2348414.
[11]. Tollenaar, N. and van der Heijden, P.G. (2019) ‘Optimizing Predictive Performance of criminal recidivism models using registration data with binary and survival outcomes’, PLOS ONE, 14(3). doi:10.1371/journal.pone.0213245.
[12]. Alsaleh, M.M. et al. (2023) ‘Prediction of disease comorbidity using explainable artificial intelligence and Machine Learning Techniques: A systematic review’, International Journal of Medical Informatics, 175, p. 105088. doi:10.1016/j.ijmedinf.2023.105088.
[13]. Brennan, P.A. (2009) ‘Tracing the scent of a male (commentary on Kang et al.)’, European Journal of Neuroscience, 29(3), pp. 623–623. doi:10.1111/j.1460-9568.2009.06667.x.
[14]. Coid, D. (2000) ‘Grant funding of Health Voluntary Organizations by Scottish Health Boards’, Public Health, 114(5), pp. 320–323. doi:10.1016/s0033-3506(00)00355-3.
[15]. Folsom, J. and Atkinson, J.L. (2007). The Generalizability of the LSI-R and the Cat To the Prediction of Recidivism in Female Offenders. Criminal Justice and Behavior, 34(8), pp.1044–1056. doi:https://doi.org/10.1177/0093854807300097.
[16]. Blanden, J., Doepke, M. and Stuhler, J. (2022) Educational inequality* [Preprint]. doi:10.3386/w29979.
[17]. Lamberti, J.S. (2016). Preventing Criminal Recidivism Through Mental Health and Criminal Justice Collaboration. Psychiatric Services, [online] 67(11), pp.1206–1212. doi:https://doi.org/10.1176/appi.ps.201500384.
[18]. Loong, D., Bonato, S., Barnsley, J. and Dewa, C.S. (2019). The Effectiveness of Mental Health Courts in Reducing Recidivism and Police Contact: A Systematic Review. Community Mental Health Journal, 55(7), pp.1073–1098. doi:https://doi.org/10.1007/s10597-019-00421-9.
Cite this article
Zhou,J.;Li,X.;Ma,X.;Ye,Y.;Zhou,Z. (2025). Experimental Research on Recidivism Prediction. Applied and Computational Engineering,131,222-238.
Data availability
The datasets used and/or analyzed during the current study will be available from the authors upon reasonable request.
Disclaimer/Publisher's Note
The statements, opinions and data contained in all publications are solely those of the individual author(s) and contributor(s) and not of EWA Publishing and/or the editor(s). EWA Publishing and/or the editor(s) disclaim responsibility for any injury to people or property resulting from any ideas, methods, instructions or products referred to in the content.
About volume
Volume title: Proceedings of the 2nd International Conference on Machine Learning and Automation
© 2024 by the author(s). Licensee EWA Publishing, Oxford, UK. This article is an open access article distributed under the terms and
conditions of the Creative Commons Attribution (CC BY) license. Authors who
publish this series agree to the following terms:
1. Authors retain copyright and grant the series right of first publication with the work simultaneously licensed under a Creative Commons
Attribution License that allows others to share the work with an acknowledgment of the work's authorship and initial publication in this
series.
2. Authors are able to enter into separate, additional contractual arrangements for the non-exclusive distribution of the series's published
version of the work (e.g., post it to an institutional repository or publish it in a book), with an acknowledgment of its initial
publication in this series.
3. Authors are permitted and encouraged to post their work online (e.g., in institutional repositories or on their website) prior to and
during the submission process, as it can lead to productive exchanges, as well as earlier and greater citation of published work (See
Open access policy for details).
References
[1]. Gagliardi, G.J. et al. (2004) ‘Forecasting recidivism in mentally ill offenders released from prison.’, Law and Human Behavior, 28(2), pp. 133–155. doi:10.1023/b:lahu.0000022319.03637.45.
[2]. Travaini, G.V. et al. (2022) ‘Machine Learning and criminal justice: A systematic review of advanced methodology for recidivism risk prediction’, International Journal of Environmental Research and Public Health, 19(17), p. 10594. doi:10.3390/ijerph191710594.
[3]. Mu, D. et al. (2024) ‘Prediction of recidivism and detection of risk factors under different time windows using Machine Learning Techniques’, Social Science Computer Review [Preprint]. doi:10.1177/08944393241226607.
[4]. van der Knaap, L.M. et al. (2012) ‘The predictive validity of criminogenic needs for male and female offenders: Comparing the relative impact of needs in predicting recidivism.’, Law and Human Behavior, 36(5), pp. 413–422. doi:10.1037/h0093932.
[5]. Eisenbarth, H. et al. (2012) ‘Recidivism in female offenders: PCL‐R lifestyle factor and Vrag show predictive validity in a German sample’, Behavioral Sciences & the Law, 30(5), pp. 575–584. doi:10.1002/bsl.2013.
[6]. Walters, G.D., Deming, A. and Casbon, T. (2014) ‘Predicting recidivism in sex offenders with the Psychological Inventory of Criminal Thinking Styles (picts)’, Assessment, 22(2), pp. 167–177. doi:10.1177/1073191114539384.
[7]. Lang, K. and Spitzer, A.K.-L. (2020) ‘Race discrimination: An economic perspective’, Journal of Economic Perspectives, 34(2), pp. 68–89. doi:10.1257/jep.34.2.68.
[8]. Breiman, L. (2001) Machine Learning, 45(1), pp. 5–32. doi:10.1023/a:1010933404324.
[9]. Tollenaar, N. and van der Heijden, P.G. (2012) ‘Which method predicts recidivism best?: A comparison of statistical, machine learning and Data Mining Predictive Models’, Journal of the Royal Statistical Society Series A: Statistics in Society, 176(2), pp. 565–584. doi:10.1111/j.1467-985x.2012.01056.x.
[10]. Henley, W.E. and Hand, D.J. (1996) ‘A K-nearest-neighbour classifier for assessing consumer credit risk’, The Statistician, 45(1), p. 77. doi:10.2307/2348414.
[11]. Tollenaar, N. and van der Heijden, P.G. (2019) ‘Optimizing Predictive Performance of criminal recidivism models using registration data with binary and survival outcomes’, PLOS ONE, 14(3). doi:10.1371/journal.pone.0213245.
[12]. Alsaleh, M.M. et al. (2023) ‘Prediction of disease comorbidity using explainable artificial intelligence and Machine Learning Techniques: A systematic review’, International Journal of Medical Informatics, 175, p. 105088. doi:10.1016/j.ijmedinf.2023.105088.
[13]. Brennan, P.A. (2009) ‘Tracing the scent of a male (commentary on Kang et al.)’, European Journal of Neuroscience, 29(3), pp. 623–623. doi:10.1111/j.1460-9568.2009.06667.x.
[14]. Coid, D. (2000) ‘Grant funding of Health Voluntary Organizations by Scottish Health Boards’, Public Health, 114(5), pp. 320–323. doi:10.1016/s0033-3506(00)00355-3.
[15]. Folsom, J. and Atkinson, J.L. (2007). The Generalizability of the LSI-R and the Cat To the Prediction of Recidivism in Female Offenders. Criminal Justice and Behavior, 34(8), pp.1044–1056. doi:https://doi.org/10.1177/0093854807300097.
[16]. Blanden, J., Doepke, M. and Stuhler, J. (2022) Educational inequality* [Preprint]. doi:10.3386/w29979.
[17]. Lamberti, J.S. (2016). Preventing Criminal Recidivism Through Mental Health and Criminal Justice Collaboration. Psychiatric Services, [online] 67(11), pp.1206–1212. doi:https://doi.org/10.1176/appi.ps.201500384.
[18]. Loong, D., Bonato, S., Barnsley, J. and Dewa, C.S. (2019). The Effectiveness of Mental Health Courts in Reducing Recidivism and Police Contact: A Systematic Review. Community Mental Health Journal, 55(7), pp.1073–1098. doi:https://doi.org/10.1007/s10597-019-00421-9.