


1. Introduction
Currently, educational inequity has further widened. Educational inequality is basically the uneven distribution of educational resources, comprising but not limited to the provision of schools for the socially disadvantaged, experienced and qualified mentors, and the funding of books and technology. These selected members of society are often historically oppressed and disadvantaged. Due to the degrading quality of public schools, private schools become the first choice for more parents to send their children for education in spite of the extortionate expenses. The private schools generally provide a better learning environment owing to higher academic standards, better established discipline, more student-teacher interactions and more appropriate class sizes. Even when governments introduce policies to intervene, as in New York City (NYC) through expert investment and community input, to make substantive changes rather than cosmetic adjustments. Its solutions focus on the following key policy areas to drive systemic change: advancing G&T programs in each district, improving the number and quality of secondary schools, investing in free SHSAT preparation for every student citywide, investing in free SHSAT preparation for every student citywide, etc.
Some have argued that GreatSchools has become a player in an ongoing debate about school equity. A research paper that has received renewed attention 4 suggests that earlier versions of the "Great Schools" grading system may have accelerated already existing trends of racial and socioeconomic segregation [1]. Other studies of different school rating systems have shown that schools impact housing values quite a bit. Christina from EducationWeek found in 2012 that A 2004 study looked at home prices in Gainesville, Florida, which uses an A-F rating system for schools. The study found that homes graded for 'A' schools cost about $9,000 more than similar homes graded for 'B' schools, even though the actual academic differences between schools with those grades were small. Districts rely heavily on property taxes, which are driven by home values. Schools in high-priced housing areas typically have more money to spend on teachers and other educational resources.
At the same time, the student population in public schools across the country is becoming more diverse, with more schools being predominantly black and Hispanic and most students eligible for cut-price or free lunches. These schools tend to have less experienced and effective teachers, more challenging school climates and less rigorous academic curricula than schools with more affluent student populations. However, segregation existed long before the big schools. Sharique Hasan and Anuj Kumar looked at demographics and housing trends between 2006 and 2015, when GreatSchools expanded its reach. More affluent households had a greater ability to take advantage of ratings provided by GreatSchools when deciding where to live. Many agents use school district ratings as a selling point or a sign of areas that potential buyers should avoid.
Data statistics and modeling are effective methods to analyze this problem. But it is also worth noting that many countries, especially low-income and developing ones, do not have access to quality educational data. Although census data are generally available, the workload of censuses and school-by-school consultations leads to long gaps in open data and a less-than-ideal result in more precise and dynamic analyses. In addition to the lack of data, there are challenges, such as the fact that the questions examined are so fixed that it is difficult to identify new areas for improvement. For the purpose of generating reliable and precise education feedback reports, this study turned to a large data set of comments on education websites to reveal educational inequities in society in more detail.
Currently, many studies have used online housing advertisements for feature extraction and semantic analysis, and machine learning methods to construct models for predicting socioeconomic status [2]. Inspired by this, this study conducted Bayesian classification and lda model analysis on all comments about New York schools on the largest school rating and recording website in the United States, instead of the traditional questionnaire which can only adopt multiple choice question survey mode. The large number of online comments allowed for a more detailed analysis of education in New York. The contribution of this work is threefold. First, it builds a theoretical foundation to explore what factors are associated with educational imbalance in a society. Secondly, it shows a feasible method to use to website comments to reveal social imbalance. Finally, the pros and cons are analyzed and recommendations are made to education policymakers in New York City.
2. Influence factors of students' academic performance
2.1. Significance of application of socioeconomic status in analysis of educational data
Measures of socioeconomic status (SES) are commonly utilized in the analysis of performance data for statistically controlling for the impact of SES, enhancing statistic power, and strengthening causality if the relationship between achievement and SES is moderate to strong. On the basis of the empirical evidence that characterizes the SES/achievement relationship, it is found that the relationship is rather mild, with an average correlation equal to 0.22 between SES and achievement, though it seems to have enhanced over the past three decades [3]. The SES/achievement relationship at moderate level possesses great implications in terms of applying SES measures to analysing educational data.
2.2. Impact of parental socioeconomic status on students' academic performance
First of all, some studies believe that parental socioeconomic status is the reason that affects students' academic performance [4]. Within the Australian education system, a persistent characteristic lies in the differences in the level of academic achievements in association with SES, especially parental education. It is more likely for young students who have tertiary-educated parents to be high achievers at school. It is less likely for students with low achievement levels to accomplish grade 12 and they might obtain negative after-school grades. SES in that community, especially the school attended, impacts both academic achievement and achievement levels.
However, some studies believe that only school SES will affect later grades. The objective of education policy is to offer all students high-quality education. Therefore, questions about the critical features of school structure (proportion of students with immigrant background, achievement heterogeneity, prior-school achievement and SES), the quality of teaching, and the extent to which later school achievement and education quality are related to each other. By examining school data from all elementary schools in Berlin, Germany, the correlation and pathway analysis results generally indicate that school structure (mean SES, mean prior-school achievement) predicts the components of teaching quality (SES: cognitive activation and classroom management, Achievement: individual learning support and cognitive activation). The relationship between school structure characteristics and most of the education quality components is almost zero. In contrary with expectations, teaching quality can only mitigate the influence of SES on later school achievement [5-9].
In many countries, government education policies often emphasise parental involvement in their children's schooling. Studies have examined parental involvement critically by exploring voluntary parental expenses in public secondary schools and the way that SES models these expenses. For example, public schools in Australia may require parents to charge "voluntary" fees in order to enhance educational facilities and programs. With public schools increasing in a competitive market, this arguably increases the pressure on schools and their communities to raise grants. The findings suggest substantial inequality among state schools, with high SES schools enjoying more than four times the parental income compared to low SES schools. The economic contribution of parents is a form of structural inequality, which benefits socially advantaged schools and students, and supposedly both cause and consequence of socially segregated education.
2.3. Impact of school economic status on students' academic performance
School economic status is related to the contemporaneous effect, which is the influence of other students in the school on each other's academic performance. Studies have show that students in high SES achieve more positive growth in achievement compared with low and mixed SES schools. Two of the three comparisons showed that students at mixed SES schools had the lowest rate of mathematical development. The negative effect of mixed-SES schools on math achievement development was strongest for students with high SES. Our results make contribution to the ongoing discussion about the impact of the socioeconomic composition (SEC) of schools on student achievement development [10-12].
Gregory examined the relationship between socioeconomic segregation in high schools and student achievement outcomes and the mechanisms mediating these relationships. The results showed a strong association between socioeconomic segregation, high school graduation, and unviersity enrollment. After controlling for a range of school and student factors, students who attended schools with a high SEC were 68% more likely to attend a four-year unviersity than those with a low SEC. The study examined two mediating mechanisms: socioeconomic-based school effects and peer influence. The results suggest that the relationship between academic performance and academic performance is more due to peer influence, which tends to be negative in low academic performance Settings. However, school practices that emphasize academics also play an important role in mediating the relationship between SEC and 4-year college admissions. These findings reveal that school integration may be of necessity to entirely address the negative consequences of attending a low-SEC school.
McConney and Perry systematically revealed the relationship between student SES, math and science performace, and student interest in science in the context of different SES compositions of schools. They highlighted that increasing school SES scores were associated consistently with significantly increasing math and science scores. This association pattern is true for all groups, regardless of their individual SES. Nevertheless, the results also showed that student interest in science was irrevalant with socioeconomic status at different schools, but only weakly and discordant with individual socioeconomic status. An increase in a school's average SES was associated with a sustained increase in student academic performance, and this relationship was applicable to all students, regardless of their individual SES. In the case of Australia, the school socioeconomic SEC exhibits a strong influence on student academic performance [13-17].
Studies have tested that varying degrees of parent engagement will be pertinent to changes in education environmental quality, specifically school SES, grade level, class size, teacher degree level, teacher 'perceived effectiveness, primary perception of teacher effectiveness, instructional coordination, and organizational rigidity. Hoover-Dempsey et al. used stepwise multiple regression analysis, and this study showed that various predictor combinations constituted a large part of the variance of parental involvement results: Parent meeting (52%), teacher perceptions of parental support (41%), parent volunteer (27%), parent tutoring (24%), and parent engagement in the homeschooling program (22%). The variables most involved in the results were teacher effectiveness and school SES.
Studies using three statewide achievement datasets in 2015 found obvious school SES effect when estimating cross-sectional models. However, these effects are largely lost with the application of longitudinal models, i.e. student-fixed and value-added effects models. However, this investigation is not the first to highlight that peer SES has little effect on academic achievement.
In some research and policy literature, the SES effect in large schools is a statistical artifact. (Marks, 2015) Estimates of school SES are not stable when using different models and measurement standards. The school SES effect on school and student-level first-mover ability is negligible. Different from the theoretical explanation, the school-SES effect is more signiciant when the weak SES measure. Moreover, the school-SES effect varies by area of achievement.
3. Study area and website
This study selected New York City as the study area. Education in NYC involves many private and public institutes. Many important research centers universities, and libraries are located in NYC. In 2006, NYC had the highest number of graduate life science degrees annually awarded across the US, with 127 Nobel prize winners and 40,000 chartered physicians affiliated to local institutes. NYC annually obtains the second-largest funds by the National Institutes of Health of any US city. It is also grappling with disparities in the public school system, including some best-performing public schools and their lowest-performing counterparts. A major school reform was initiated in NYC by Mayor Michael Bloomberg.
Run by the NYC Education Department, NYC public school system is the largest one worldwide, containing more than 1,700 public schools and around 1.1 million students, with an approxiamate budget of $25 billion. It comprises somecharter schools in the city, e.g., Public Prep. There are several selective specialized schools are also involved, e.g., Brooklyn Technical High School. The city also has about 900 private religious and secular schools.
But the city also suffers from high levels of educational inequity. The Center for New York City Affairs tracked the same 45 schools in 2014 and 2015, and found that 60 percent of freshmen entering specialized high schools were concentrated in those same 45 schools. Of the city's 600 high schools, the bottom 124 schools ranked just nine (0.2%) as proficient in the city's assessment; Those schools account for 25 percent of the city's total.
This educational inequity has to do with the educational websites we used for this study. GreatSchools is an American non-profit organization which offers information on PK-12 education. It offers ratings and comparison functions on the basis of equity, college readiness, student growth, and test scores. Information on more than 138,000 American charter private, and public schools is contained in the GreatSchools database, with a scale of 1 to 10 for ranking these schools on the basis of state test scores.
GreatSchools also introduced "summary ratings" on individual school profiles. 1 - a 10-point scale scores, the rating is composed of subject rating, including how the school from different racial, ethnic and social and economic background of students to provide services (fair), the progress of the students in a school year degree progress (students), the state examination performance (examination), and school for students in college degree (university preparation). GreatSchools developed summary and equity ratings in 2020 for K-12 schools, for the purpose of emphasizing equity and enhancing student academic performance as an important metric of education quality. Although GreatSchools star ratings are purely subjective and related to reviewers, digital ratings are based entirely on test scores.
Despite these methodological tweaks, education stakeholders and parents criticize the ratings for as they affect housing choices and rely on metrics correlating with student ethnicity and salary. For example, housing websites like Redfin and Zillow allow potential houseowners to select their searches on the basis of school quality. The school quality and housing choice is controversially linked, since public schools are principally funded by taxes on housing properties. High-quality schools increase family values, and higher family values mean more funds for schools. On the contrary, low-value properties result in less funding for schools, which further lowers family values.
4. Data and methodology
4.1. Overall method and process
This study starts by collecting and cleaning from online housing ads. Then the semantic analysis is carried out to identify the topic semantically using Naive Bayes classifier. Finally, the topic distribution of crawled online school reviews by LDA model is obtained for analysis and summary.
4.2. Data collection and processing
4.2.1. Data crawling and Cleaning. Data is collected and cleaned from online housing ads. This study used Python to write a web crawler engine that crawled the data of all reviews about schools on the site from its inception to the present day. As the most used online housing advertising platform in the United States, GreatSchools was chosen for this study because GreatSchools provides comprehensive information to the public, including detailed structural features and text ads, And other similar platforms might not provide these thorough housing attributes . GreatSchools is not alone in ranking pre-K-12 schools. The search engines Google and Yelp and the websites Privateschoolreview.com and Schooldigger.com also provide school ratings. But in accordance with Alexa Internet that records Web traffic, GreatSchools is the most-used school, with 40 million unique visitors per year
However, many schools in GreatSchools lack reviews and ratings, so only research reviews are considered in this study, and GreatSchools does not consider weighted ratings for various aspects of a school. The obtained data were further filtered by disposing three abnormal sample types: (i) sorting out missing and outliers, such as setting stopwords, and viewing abnormal comments, such as abnormal characters or too short comments; (ii) removing repeated records; And (iii) information that ignores logic (e.g., a large sector with extremely low prices, well above or below the average price of neighbouring real estates). The final dataset consists of 2038 samples and consists of several paragraphs of text description.
4.2.2. Semantic analysis. This styudy uses Naive Bayes classifier for semantic recognition of topics. We first use Naive Bayes classifier to determine the topic included in each of the advertisements. Naive Bayes classifiers are generally identified through data analysts for their computational efficiency and simplicity in quantifying the probability that a test term belongs to a certain topic. For methodological details, the reader is referred to the seminal work of Langley and Sage. Finally, 200 randomly selected samples (approximately 10% of the entire sample) are subject to manual interpretation for assessment. It was utilized for testing the algorithm accuracy. Ten-fold cross-validation is a commonly adopted test approach. The data set was grouped into ten subsets, among which 9 were adopted as training data and 1 as test data, and the experiment was carried out. Each trial would yield a corresponding correct rate. The mean correct rate was adopted to estimate the algorithm accuracy. Multiple ten-fold cross validation (e.g., 10 times ten-fold cross validation) is generally required. Afterwards, the mean value can be employed as the estimation of the algorithm accuracy.
The steps of 10-fold cross validation are as followings: Step 1: The data set is divided into three sets, i.e., test, training and validation sets. Step 2: Determine the structure and training factors. Step 3: Use the training set to train the model. Step 4: Use the validation set to assess the model. Step 5: Repeat Step 2 through Step 4, rolling over the validation set nine times. Step 6: Get the minimum error from 9 iterations. Step 7: Obtain the test error from the test set and training set with the smallest error in Step 6. Step 8: Repeat Steps 3 to 7 with different test sets, folding 10 times each time.
Next is to apply the LDA model. LDA model is a kind of topic model, which is able to entitle each document by means of probability distribution. LDA is often used in text mining and topic analysis. The distribution of the LDA model for different topics is obtained after the stop words irrelevant to the topic are screened.
5. Results
5.1. Important themes and related emotions
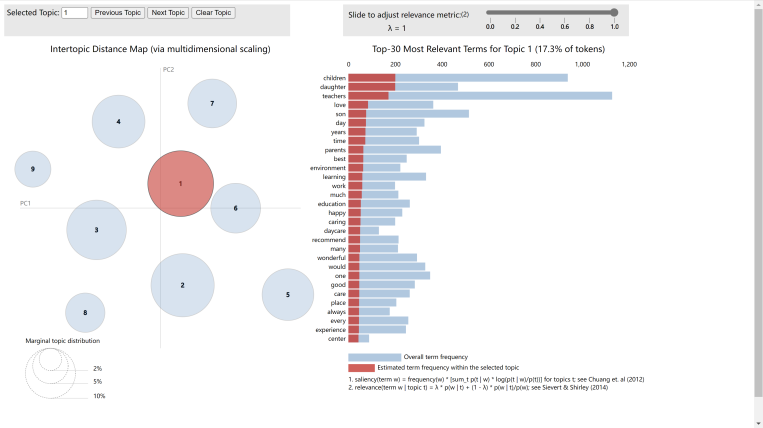
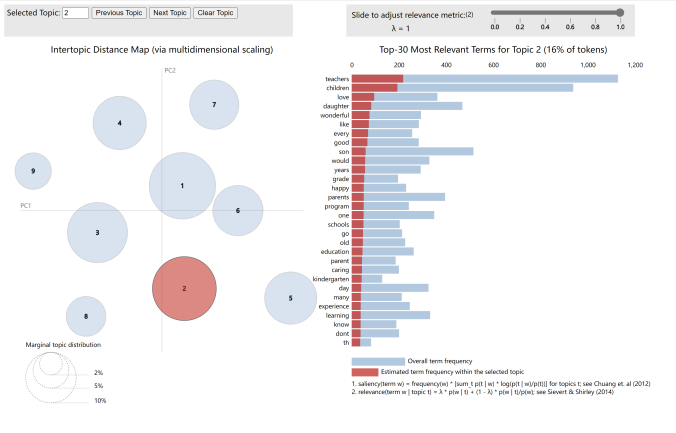
Figure 1 shows the topic distribution of online school comments crawled by the LDA model. The LDA model analyzed nine topic models, and each topic group had different bag of words and distribution.
| |
Figure 1. Topics 1 and 2 distribution of online school comments crawled by the LDA model. | |
The distribution of 9 specific topics is as follows:
Topic 1:0.017*"teachers" + 0.013*"children" + 0.007*"excellent" + 0.007*"parents" + 0.007*"time" + 0.006*"would" + 0.005*"education" + 0.005*"one" + 0.005*"experience" + 0.005*"many"
Topic 2:0.017*"teachers" + 0.014*"children" + 0.007*"one" + 0.007*"effective" + 0.007*"homework" + 0.006*"strongly" + 0.006*"learning" + 0.006*"disagree" + 0.006*"day" + 0.006*"character"
Topic 3:0.018*"teachers" + 0.009*"children" + 0.009*"son" + 0.008*"learning" + 0.008*"love" + 0.008*"would" + 0.007*"good" + 0.007*"wonderful" + 0.006*"parents" + 0.005*"happy"
Topic 4:0.017*"children" + 0.017*"daughter" + 0.015*"teachers" + 0.007*"love" + 0.006*"son" + 0.006*"day" + 0.006*"years" + 0.006*"time" + 0.005*"parents" + 0.005*"best"
Topic 5:0.018*"teachers" + 0.012*"son" + 0.010*"children" + 0.009*"parents" + 0.007*"best" + 0.007*"one" + 0.006*"schools" + 0.006*"day" + 0.006*"place" + 0.005*"learning"
Topic 6:0.013*"son" + 0.010*"children" + 0.008*"teachers" + 0.008*"environment" + 0.007*"daughter" + 0.006*"education" + 0.006*"time" + 0.006*"also" + 0.005*"day" + 0.005*"learning"
Topic 7:0.017*"teachers" + 0.015*"children" + 0.012*"son" + 0.006*"also" + 0.006*"years" + 0.006*"parents" + 0.005*"care" + 0.005*"old" + 0.005*"community" + 0.005*"time"
Topic 8:0.020*"teachers" + 0.018*"children" + 0.009*"love" + 0.008*"daughter" + 0.007*"wonderful" + 0.007*"like" + 0.006*"every" + 0.006*"good" + 0.005*"son" + 0.005*"would"
Topic 9:0.012*"teachers" + 0.011*"children" + 0.008*"would" + 0.007*"get" + 0.006*"parents" + 0.006*"also" + 0.006*"son" + 0.005*"one" + 0.005*"learning" + 0.005*"time"
5.2. Overall Analysis
It can also be seen that various requirements for teachers, such as teaching ability and student management ability, are the most important in the comments. The frequent appearance of "son" and "daughter" also shows the importance of gender issues in education. In terms of the overall parts of speech, the emotions are all positive. After checking the crawling comments, it is confirmed that there are a few bad comments in each school, which is consistent with the results and reasonable, indicating that the current education level can satisfy parents on the whole. But in some ways, the poor reviews are more indicative of the inequity of education. Future research can focus more on the analysis of poor reviews.
6. Discussion
This work helps by leveraging open and big data, this approach relies only on free open code and publicly available data, compared against related previous investigations that require significant resources, time and labor .
However, the limitations of this study are numerous. First of all, the data quality of online advertising itself is uneven. Due to their subjective nature, it is not possible to verify variables that measure people's opinions and perceptions, or to determine their authenticity. Secondly, unlike housing advertising, which can be trained based on the corpus of previous studies to obtain more accurate analysis, education review advertising does not have a similar training corpus. Thirdly, the sentiment and semantic analysis is not absolutely accurate, so the performance of various methods or algorithms for sentiment and semantic analysis is not compared in this study. Finally, with the emergence of new frameworks for machine learning so far, future research should address three main questions: (1) whether machine learning methods can be used to further explore features and combine them with other aspects of society to obtain more extensive research; (2) check whether the method can lead to consistent estimates in other places worldwide; And (3) develop a more generally applicable framework with the help of more sophisticated and advanced AI tools.
7. Conclusion
This study considers the influence factors of education, and conducts Bayesian classification and LDA model analysis to explore the primary factors associated with educational imbalance in a society.
Results show that requirements for teachers, gender issues are They are the two most important influencing factors in the LDA thematic model analysis results. But in terms of the overall sentiment of the resulting thematic models, New York's educational phenomenon generally performs well. However, as the research methods and objects of this study are still relatively limited, there are still many places that have not been fully explored, and the method of using online comments to explore the inequity of social education needs to be further improved.
References
[1]. Main Causes of Inequality in Education. biznewske. Available from: https://biznewske.com/inequality-in-education/#:~:text=Inequality%20in%20Education%20is%20basically%20non%20-uniform%20distribution,society%20tend%20to%20be%20historically%20oppressed%20and%20disadvantaged.
[2]. Improving diversity, increasing opportunity. educationequity. Available from: https://www.educationequity.nyc/
[3]. Lingqi Wang, Shenjing He, Shiliang Su, Yu Li, Lirong Hu, Guie Li. Urban neighborhood socioeconomic status (SES) inference: A machine learning approach based on semantic and sentimental analysis of online housing advertisements Habitat international. 2022
[4]. Lingqi Wang, Shenjing He, Shiliang Su, Yu Li, Lirong Hu, Guie Li. Urban neighborhood socioeconomic status (SES) inference: A machine learning approach based on semantic and sentimental analysis of online housing advertisements Habitat international. 2022
[5]. Christina A. Samuels. GreatSchools Finds a Niche in School Ratings. EducationWeek. 2012
[6]. Christina A. Samuels. Are GreatSchools Ratings Making Segregation Worse? EducationWeek 2019
[7]. Michael R. Harwell, Yukiko Maeda, Kyoungwon Bishop, Aolin Xie. The Surprisingly Modest Relationship Between SES and Educational Achievement Journal of Experimental Education. 2017
[8]. Jenny Chesters, Anne Daly. Do peer effects mediate the association between family socioeconomic status and educational achievement?. Australian Journal of Social Issues. 2017
[9]. Marina Wenger, Holger Gärtner, Martin Brunner. To What Extent Are Characteristics of a School's Student Body, Instructional Quality, School Quality, and School Achievement Interrelated?.. School Effectiveness and School Improvement. 2020
[10]. Emma Rowe, Laura B. Perry. Inequalities in the private funding of public schools: parent financial contributions and school socioeconomic status Journal of Educational Administration and History. 2020
[11]. Barbara Belfi, Carla Haelermans, Bieke De Fraine. The long‐term differential achievement effects of school socioeconomic composition in primary education: A propensity score matching approach British Journal of Educational Psychology. 2016
[12]. Gregory J. Palardy. High School Socioeconomic Segregation and Student Attainment American Educational Research Journal. 2013
[13]. aura B. Perry, Andrew Mcconney. Examination of Socioeconomic Status and Student Achievement Using PISA, 2010
[14]. Kathleen V. Hoover-Dempsey, Otto C. Bassler, Jane S. Brissie. Parent Involvement: Contributions of Teacher Efficacy, School Socioeconomic Status, and Other School Characteristics American Educational Research Journal. 1987
[15]. David J. Armor, Gary N. Marks, Aron Malatinszky. The Impact of School SES on Student Achievement: Evidence from U.S. Statewide Achievement Data.. Educational Evaluation and Policy Analysis. 2018
[16]. Gary N. Marks. Are school-SES effects statistical artefacts? Evidence from longitudinal population data Oxford Review of Education. 2015
[17]. Barnum M, LeMee GL. Looking for a home? You’ve seen GreatSchools ratings. Here’s how they nudge families toward schools with fewer black and Hispanic students. www.chalkbeat.org. 2019
Cite this article
Deng,S. (2023). Educational inequities in New York city by thematic analysis of school website reviews. Applied and Computational Engineering,6,30-38.
Data availability
The datasets used and/or analyzed during the current study will be available from the authors upon reasonable request.
Disclaimer/Publisher's Note
The statements, opinions and data contained in all publications are solely those of the individual author(s) and contributor(s) and not of EWA Publishing and/or the editor(s). EWA Publishing and/or the editor(s) disclaim responsibility for any injury to people or property resulting from any ideas, methods, instructions or products referred to in the content.
About volume
Volume title: Proceedings of the 3rd International Conference on Signal Processing and Machine Learning
© 2024 by the author(s). Licensee EWA Publishing, Oxford, UK. This article is an open access article distributed under the terms and
conditions of the Creative Commons Attribution (CC BY) license. Authors who
publish this series agree to the following terms:
1. Authors retain copyright and grant the series right of first publication with the work simultaneously licensed under a Creative Commons
Attribution License that allows others to share the work with an acknowledgment of the work's authorship and initial publication in this
series.
2. Authors are able to enter into separate, additional contractual arrangements for the non-exclusive distribution of the series's published
version of the work (e.g., post it to an institutional repository or publish it in a book), with an acknowledgment of its initial
publication in this series.
3. Authors are permitted and encouraged to post their work online (e.g., in institutional repositories or on their website) prior to and
during the submission process, as it can lead to productive exchanges, as well as earlier and greater citation of published work (See
Open access policy for details).
References
[1]. Main Causes of Inequality in Education. biznewske. Available from: https://biznewske.com/inequality-in-education/#:~:text=Inequality%20in%20Education%20is%20basically%20non%20-uniform%20distribution,society%20tend%20to%20be%20historically%20oppressed%20and%20disadvantaged.
[2]. Improving diversity, increasing opportunity. educationequity. Available from: https://www.educationequity.nyc/
[3]. Lingqi Wang, Shenjing He, Shiliang Su, Yu Li, Lirong Hu, Guie Li. Urban neighborhood socioeconomic status (SES) inference: A machine learning approach based on semantic and sentimental analysis of online housing advertisements Habitat international. 2022
[4]. Lingqi Wang, Shenjing He, Shiliang Su, Yu Li, Lirong Hu, Guie Li. Urban neighborhood socioeconomic status (SES) inference: A machine learning approach based on semantic and sentimental analysis of online housing advertisements Habitat international. 2022
[5]. Christina A. Samuels. GreatSchools Finds a Niche in School Ratings. EducationWeek. 2012
[6]. Christina A. Samuels. Are GreatSchools Ratings Making Segregation Worse? EducationWeek 2019
[7]. Michael R. Harwell, Yukiko Maeda, Kyoungwon Bishop, Aolin Xie. The Surprisingly Modest Relationship Between SES and Educational Achievement Journal of Experimental Education. 2017
[8]. Jenny Chesters, Anne Daly. Do peer effects mediate the association between family socioeconomic status and educational achievement?. Australian Journal of Social Issues. 2017
[9]. Marina Wenger, Holger Gärtner, Martin Brunner. To What Extent Are Characteristics of a School's Student Body, Instructional Quality, School Quality, and School Achievement Interrelated?.. School Effectiveness and School Improvement. 2020
[10]. Emma Rowe, Laura B. Perry. Inequalities in the private funding of public schools: parent financial contributions and school socioeconomic status Journal of Educational Administration and History. 2020
[11]. Barbara Belfi, Carla Haelermans, Bieke De Fraine. The long‐term differential achievement effects of school socioeconomic composition in primary education: A propensity score matching approach British Journal of Educational Psychology. 2016
[12]. Gregory J. Palardy. High School Socioeconomic Segregation and Student Attainment American Educational Research Journal. 2013
[13]. aura B. Perry, Andrew Mcconney. Examination of Socioeconomic Status and Student Achievement Using PISA, 2010
[14]. Kathleen V. Hoover-Dempsey, Otto C. Bassler, Jane S. Brissie. Parent Involvement: Contributions of Teacher Efficacy, School Socioeconomic Status, and Other School Characteristics American Educational Research Journal. 1987
[15]. David J. Armor, Gary N. Marks, Aron Malatinszky. The Impact of School SES on Student Achievement: Evidence from U.S. Statewide Achievement Data.. Educational Evaluation and Policy Analysis. 2018
[16]. Gary N. Marks. Are school-SES effects statistical artefacts? Evidence from longitudinal population data Oxford Review of Education. 2015
[17]. Barnum M, LeMee GL. Looking for a home? You’ve seen GreatSchools ratings. Here’s how they nudge families toward schools with fewer black and Hispanic students. www.chalkbeat.org. 2019