


1. Introduction
1.1. Research background
As a highly concentrated place of human activities, urban space creates convenience and opportunities for social development but also faces more and more challenges of public security issues. With the increasing level of urbanization, community security has become one of the important indicators to measure the sustainability and livability of a city, and also an important factor for people to consider when traveling or moving. The existence of criminal activities not only affects the quality of life of residents and leads to various social problems, but also increases the cost of the government and related departments [1]. Understanding the distribution patterns and causes of urban crime and improving the security of the design area through planning methods have attracted more and more attention from scholars and urban planners. But the occurrence of urban crime is a complicated process that is frequently influenced by a variety of factors, including neighborhood socioeconomic position, the physical environment, government, and human psychology[2]. In these factors, the neighborhood socioeconomic status has been regarded as one of the important causes of criminal activities, claim by Becker first proposed in 1968, Becker thinks that criminal behavior is based on profit/cost analysis after rational decisions, the individual level of criminal expected return is under the influence of the social economic conditions, such as unemployment, income level, Education level, etc [3]. When acquiring the necessary social capital cannot be done so legally, some people will opt to do it in an illegal manner, which results in the prevalence of criminal behaviors.
Neighborhood socioeconomic status (NSES) is the actual or perceived relative position of a group in a specific social environment at the overall or ecological level, which reflects the social class and status of people in a certain area. It is generally represented by the combination of factors such as education level, population composition, employment status, and economic income [4]. Many studies have confirmed the close relationship between neighborhood socioeconomic factors and criminal activity. On the one hand, it has a long-term impact on the development of individuals living in disadvantaged neighborhoods. Changing neighborhoods can reduce individual hostility and the likelihood of engaging in criminal activity. People who live in underprivileged communities during youth are more likely to commit crimes later in life [5]. On the other hand, crime and violence rates are higher in underprivileged areas than in wealthy areas [6] .
However, research on the relationship between NSES and crime rates is still limited, mainly reflected in two aspects. First of all, existing research perspectives are mostly one-dimensional, such as unemployment and crime rates, immigration and violent murder and property crime, and lack of discussion on comprehensive NSES. Second, there is a lack of accurate analysis of spatially fine-grained NSES. One reason is that precise, high-quality data are still not available in many countries. Although census data are widely available, the long intervals between available data and the large size of the census area do not allow for fine and accurate analysis. With the development of big data and computer algorithms, some studies try to use open data combined with models to explain and predict socioeconomic conditions. However, previous studies based on remote sensing data and social media data are mainly from a single source and can only represent one aspect of socioeconomic attributes [7].
1.2. The likelihood of housing as a predictor of NSES
Housing has been widely recognized as an important physical manifestation of NSES. First of all, real estate occupies a considerable proportion of household wealth and social assets, and it has both use and investment value. It is an important indicator reflecting the social and economic status of residents [8]. Secondly, adjacent housing units, due to geographical proximity and regional regulations, often have similar housing prices, physical characteristics, and quality of life, and are simultaneously exposed to local social relationships, ecological risks, sanitation, and crime [9]. Finally, the similar geographical characteristics of housing also condense the living of groups with similar socioeconomic status, which further forms new housing attributes. Therefore, housing conveys rich socioeconomic information about the community and is a potential tool for analyzing NSES. Housing specialist advertising websites such as Craigslist, Beike, Zillow, and others have become the mainstream way to post, share and find properties to buy and rent. The popularity of these online housing ads presents an opportunity for NSES speculation because they contain a large amount of comprehensive information that is not available in traditional census data sets, and because they are fast to update, have wide coverage, and are publicly available. In this regard. Wang et al. successfully used housing advertising information to predict NSES in urban areas of Hangzhou, China, and achieved good results, but the feasibility of this approach in other regions has not been proven [8].
1.3. Objects
Existing studies have achieved limited results on the relationship between fine-grained NSES and crime rates, and the lack of fine-grained comprehensive NSES evaluation methods is a potential reason. From this perspective, this study uses data collected from Zillow and other public datasets to verify the feasibility of using advertising data combined with machine learning models to predict NSES in Brooklyn, USA, and analyzes the relationship between precinct fine-grained NSES and crime rates.
2. Background of study area
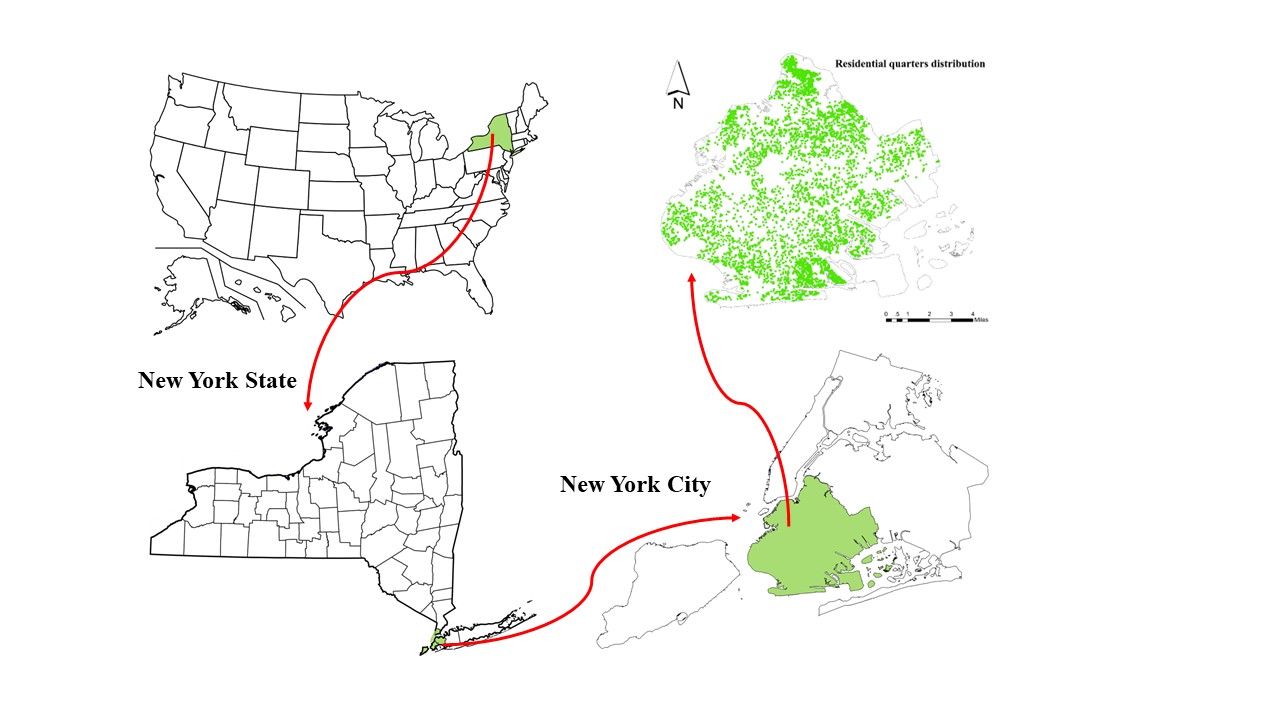
Brooklyn, the largest borough of New York city in the U.S. state of New York (Figure 1) [10]. Brooklyn has transformed into a booming hub of entrepreneurship, high-tech start-up enterprises, and postmodern art and design during the 2010s. However, it also experiences significant socioeconomic inequality (e.g., income and education inequality, deprivation) and a high crime rate, for example, one in five Brooklyn neighborhoods has a median income of over $100,000 per year, while one in five receives food stamp benefits [11]. The crime rate committed in Brooklyn in 2022 was the second highest in New York City, behind Manhattan [12]. Brooklyn's sociodemographic tendencies are generally becoming more complicated and diverse. The SES-related disparities in Brooklyn are similar to those in the majority of U.S. megacities that are urbanizing. As a result, it provides a useful example for measuring neighborhood SES and mapping it at the county level. All Brooklyn neighborhoods are the subject of our analysis; a more detailed neighborhood SES investigation might produce more results. The information gleaned from this case ought to serve as a helpful resource for legislators and urban planners both domestically and internationally.
|
Figure 1. Research site location and the residential quarters distribution |
3. Materials and methods
3.1. Data and preprocessing
The methodology process consists of five key steps. (1) Data collection and cleaning. (2) Using Naive Bayes classifier for semantic recognition of topics. (3) Quantifying the emotion of each topic using a lexical-based approach. (4) Find the best performing machine learning algorithm to draw NSES map (5) Analyze the inferred relationship between fine-grained SES and crime rate.
3.1.1. Housing advertisements data collection and cleaning. First, the study wrote a web crawler in Python and collected information about housing ads in the Brooklyn area on Zillow from January to September 2022. Zillow was selected for this research for two reasons. On the one hand, Zillow provides comprehensive and reliable housing information, including detailed descriptions and property characteristics. On the other hand, as an open data platform, Zillow has easy access to data, and the methods verified in this study are also easy to replicate and use in other regions. Three types of abnormal samples were removed to further clean up the data: (1) missing important data (such as physical features and text advertisements); (2) Duplicate samples; (3) The information is illogical (e.g. much lower or higher than average). The final dataset includes house prices for 5958 samples, 5 physical variables (total area, number of toilets, number of rooms, Walkscore, Bikescore), and at least 1 paragraph of text description.
3.1.2. Semantic analysis. The text description information extracted from the advertisement can be transformed into a series of features to infer SES. First, text descriptions need to be preprocessed in R to split long paragraphs into independent sentences without punctuation. text classification is used to process text, which is a level of natural language processing (NLP), and its purpose is to assign topics, categories, and so on to the specified text. The Naïve Bayes Classifier is then used to determine the topic involved in each description sentence. Naïve Bayes Classifier is an efficient supervised recognition technology that can identify the topic to which a test sample belongs. This study used 1000 identified topic items as test data for further manual labeling. For example, "walking distance to bus stop" is labeled "transportation convenience"; "The whole house is in move-in condition" is defined as "finished level". The remaining descriptive sentences were used as test data, and the Naïve Bayes model inferred the topic from the training data. Described in the end, all the houses were identified as eight themes: traffic convenience (time of arrival in public transportation or distance), decoration (indoor decoration), natural light (lighting conditions), the security level (security) of the residence, the number of private gardens, the number of the yard, garage and basement levels (the availability of basement and decoration).
3.1.3. Sentimental analysis. Word-based sentiment analysis was applied to quantify publisher descriptions into scores for each of the eight topics already defined. All sentences were scored according to the emotion contained in the words, using sentiment dictionaries and custom vocabulary. Two dictionaries are used, the English Positive Opinion Dictionary and the English Negative Opinion Dictionary (http://www.cs.uic.edu/~liub/FBS/sentiment-analysis.html). To ensure accuracy, words and idioms used in advertisements to express degree have also been added to the dictionary, such as "half-finished" and "well maintained". The words in the AD descriptions were rated for negative, positive, and neutral emotions. In addition, the sentiment scores of the words in each sentence are added as a score for the topic of the sentence.
3.1.4. Amenity accessibility data supplement. The information collected from housing advertisements will be used as input data for SES prediction. In the successful case of Hangzhou, Amenity accessibility information accounts for a high proportion in the prediction and is a necessary input data. Related studies also prove this view. Different socioeconomic status communities have significant inequalities in accessibility to some facilities, such as supermarkets, fast food restaurants, sports facilities, etc., and high socioeconomic status communities are more likely to stay away from unpopular facilities to some extent [13]. Therefore, the input of Amenity accessibility data helps improve the prediction's accuracy. However, insufficient POI accessibility information was extracted from the ads collected in Brooklyn, so this study supplemented relevant data from the Open Street Map(OSM). According to relevant literature, the longitude and latitude information of banking, education, entertainment, food, green facilities, medical treatment, shops, sports, and transportation facilities were collected from OSM and then summarized in Arcgis to count the number of various facilities within 500 meters of walking distance of each residential unit.
3.2. Actual SES indicators
The real SES assessment indicators are generally selected from the aspects of population, occupation, economic income, and education level, and adjusted according to the different focus of the research. In this study, eight neighborhood socioeconomic status variables (Table 1) were selected based on the study of Wang et al. [8] and the urban characteristics of New York, and the original variable data were obtained from the U.S. Census Bureau [10]. To make the SES prediction method more convenient and reduce the error and uncertainty caused by large and mixed data, after data standardization, the entropy weight method was used to further integrate all variables into a comprehensive SES index. Finally, the reliability of the integrated SES index is verified by comparing the results of the entropy weight method, coefficient of variation method, and principal component analysis.
Table 1.The information about selected SES indicators.
Category | Indicators | Min | Max | Mean | STDEV |
Population | 1.Proportion of children under 14 | 0.005 | 0.617 | 0.187 | 0.093 |
2.Percentage of population age 65 years or more | 0.001 | 0.954 | 0.135 | 0.09 | |
3.percent residents who were non-Hispanic blacks | 0 | 0.921 | 0.271 | 0.302 | |
Education | 4.Percentage of population aged 25 years or more with less than high school education | 0.006 | 0.795 | 0.177 | 0.119 |
5.Percentage of population aged 25 years or more with at least some college education | 0.075 | 0.990 | 0.581 | 0.194 | |
Economy | 6.Percentage of labor force unemployed | 0 | 0.812 | 0.065 | 0.071 |
7.Percentage of renter occupied households paying 30% or more of income to rent | 0 | 1 | 0.494 | 0.184 | |
8.Median household income in US dollars | 8921 | 250000 | 75688.72 | 39543.79 |
3.3. Prediction based on the machine learning algorithms
3.3.1. Rationale of the inference model. The principle of inferring community SES is to use the extracted housing features to establish regression models to make predictions. Machine learning models are used to solve pattern recognition and classification problems with no representation between inputs and outputs, as well as data mining and prediction problems. Its ability to handle nonlinear rational data has been proved in a variety of disciplines, and it is capable of processing high-dimensional data and extracting features at a faster training pace [14]. However, different machine learning algorithms operate on distinct principles, resulting in varying accuracies and estimates. To establish reliable input data, it is required to compare the performance of various machine learning algorithms. This study chose seven open-source machine learning models, and the research reasoning is as follows: (1) Enter all of the determined input data; (2) Separate reliable features by comparing the relative importance of input characteristics predicted by different machine learning techniques; and (3) Determine whether only reliable features can be used to forecast neighborhood SES.
3.3.2. Normalize features, Based on the previous steps, we obtain a series of input features (indicators) for the model, including housing price, number of bathrooms, number of bedrooms, number of private gardens, number of yards, decoration level, traffic convenience, medical facility accessibility, entertainment facility accessibility, shopping facility accessibility, food amenity accessibility, green infrastructure accessibility, bank accessibility, education facility accessibility, basement, and the living area of the house. Since the measurement of each housing feature (inference indicator) are not uniform, it is necessary to normalize them before using them to calculate comprehensive indicators (i.e., to convert the absolute values of indicators into relative values) using equation (1) and (2), to solve the problem of homogenization of the values of different qualitative indicators.
Assume that there are m indicators: X1, X2,…, Xn. Then for positive indicators:
\( x_{ij}^{ \prime }=\frac{x_{ij}^{ \prime }-min({X_{1j}}, {X_{2j}},…,{X_{nj}})}{max{({X_{1j}},{X_{2j}},…,{X_{nj}})}-min({X_{1j}},{X_{2j}},…,{X_{nj}})} \) (1)
For negative indicators:
\( x_{ij}^{ \prime }=\frac{max{({X_{1j}}, {X_{2j}},…,{X_{nj}})}-{X_{ij}}}{max{({X_{1j}},{X_{2j}},…,{X_{nj}})}-min({X_{1j}},{X_{2j}},…,{X_{nj}})} \) (2)
3.3.3. Model operation and validation. In this paper, seven open source models are selected for training based on four basic types of machine learning algorithms(Table 3).To test the machine learning algorithm's accuracy, 80% of the dataset was utilized for training and 20% for validation. The process was performed 10 times. The specific performance indicators include the accuracy (Eq. (3)), the percentage of root mean squared error (%RMSE; Eq. (4)) and the percentage of mean absolute error (%MAE; Eq. (5)). The next stage is to use the chosen method to rank the relative relevance of each input feature, and then to filter out trustworthy signs for recalculation. Finally, we map the neighborhood SES in Brooklyn using the best machine learning approach.
\( Accuracy=\frac{\sum (1-|\frac{{y_{i,0}}-{y_{i,p}}}{{y_{i,0}}}|)}{n} \) (3)
\( \%RMSE=\frac{\sqrt[]{\frac{1}{n}\sum {({y_{i,0}}-{y_{i,p}})^{2}}}}{ {y_{0}}} \) (4)
\( \%MAE= \frac{1}{n}\sum \frac{|{y_{i,0}}-{y_{i,p}}|}{{y_{i,0}}} \) (5)
Where n is the total number of samples; \( {y_{i,0}} \) and \( {y_{i,p}} \) are actual and inferred SES; \( {y_{0}} \) is the mean actual SES.
3.4. Crime data
The study collected data on all crimes in Brooklyn since 2022 from the New York City Police Department's official website [15]. These data are CSV files available for public download, which contain a lot of information such as the location, time, and type of crime. This study first cleaned the data from two aspects: (1) delete abnormal and duplicated data (for example, the coordinates are outside the constituency); (2) screen out the crime types that are easy to occur in the neighborhood, a total of 11 categories (Table 2). After that, the total number of classified crimes within 500 meters of each housing sample was counted, and the crime rate was calculated per 10,000 people.
Table 2. Crime types.
Variables | Components |
Assault | Felony assault; Assault 3 & related type |
Burglary | Burglary; Grand burglary |
Endanger personal safety | Kidnapping; Offenses against the person |
Endanger public safety | Arson; Dangerous weapons; Offenses against public safety |
Motor vehicle larceny | Grand car larceny; Petit larceny of motor vehicle |
Petit larceny | Other offenses related to theft; Petit larceny; theft fraud |
Robbery | Robbery |
Sex crimes | Rape; sex crimes |
Harassment | Harassment |
Murder | Murder |
Shooting | Shooting |
4. Results and discussion
4.1. Input features extracted
The semantic analysis separated nine features from the Zillow dataset's housing descriptions: traffic convenience, decoration level, lighting condition, number of bathrooms and bedrooms; Living areas; Housing price; The number of the garden, yards, and basement. These topics, together with 11 other indicators, constitute the input data. Table 3 summarizes the statistical data of each indicator. It can be shown that food accessibility, green facility accessibility, Walk score, Bike score, living area, pricing, and other topics have high positive emotion levels and standard deviations in terms of maximum and average values. Besides, according to the normal distribution of the data, the skewness and kurtosis distribution of each topic are not uniform. These results imply that there are clear differences in these characteristics between communities.
Table 3. Statistical descriptions of each input feature.
Feature | Max | Min | Mean | Std | Skewness | Kurtosis |
Bank accessibility | 20 | 0 | 1.48 | 2.731 | 2.227 | 5.531 |
Education accessibility | 21 | 0 | 1.22 | 2.357 | 3.760 | 20.21 |
Entertainment accessibility | 29 | 0 | 3.28 | 5.116 | 1.569 | 1.581 |
Food accessibility | 151 | 0 | 15.46 | 20.397 | 2.11 | 6.374 |
Green facilities accessibility | 19 | 0 | 8.67 | 10.779 | 4.77 | 28.45 |
Medical care accessibility | 15 | 0 | 1.83 | 2.398 | 1.483 | 2.221 |
Shop accessibility | 30 | 0 | 5.28 | 7.545 | 1.924 | 5.735 |
Sport accessibility | 25 | 0 | 1.47 | 2.599 | 3.154 | 15.52 |
Walk score | 100 | 23 | 86 | 13.89 | 1.813 | 3.39 |
Bike score | 99 | 39 | 73 | 14.97 | 0.106 | -1.26 |
Bathrooms | 16 | 0 | 2.492 | 1.417 | 1.403 | 7.47 |
Bedrooms | 16 | 0 | 3.65 | 2.129 | 0.96 | 1.90 |
Living area | 101051 | 160 | 2137.56 | 3165.93 | 25.553 | 784.99 |
Price | 11700000 | 112500 | 1299523 | 916776 | 2.662 | 16.210 |
Garden | 1 | 0 | 0.02 | 0.15 | 6.385 | 38.83 |
Yards | 1 | 0 | 0.37 | 0.484 | 0.518 | -1.735 |
Basement | 48 | 0 | 1.646 | 3.582 | 6.118 | 58.714 |
Traffic convenience | 42 | 0 | 1.216 | 2.394 | 6.874 | 88.792 |
Decoration grade | 36 | -3 | 0.88 | 2.108 | 6.34 | 73.578 |
Lighting condition | 1 | 0 | 0.29 | 0.437 | 6.22 | 5.28 |
4.2. The results of machine learning algorithms
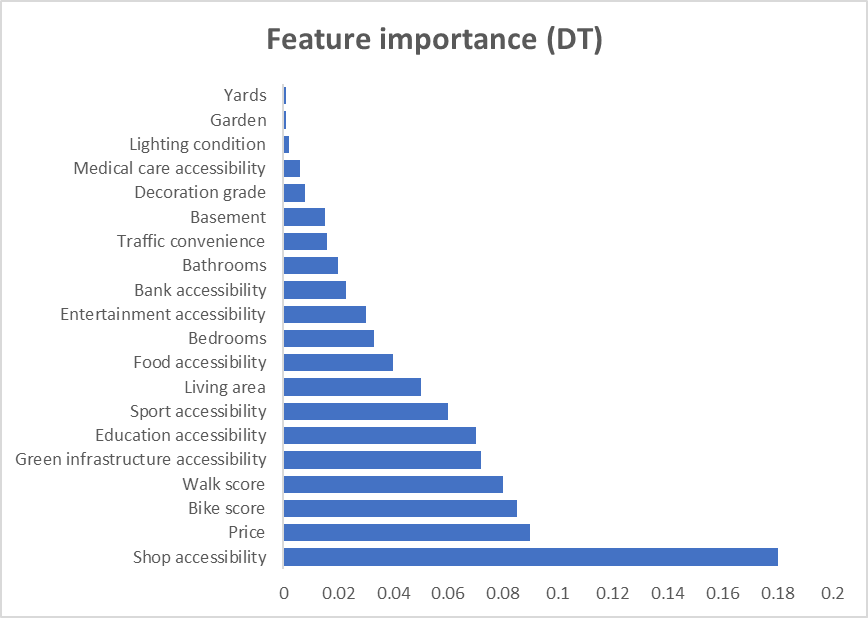
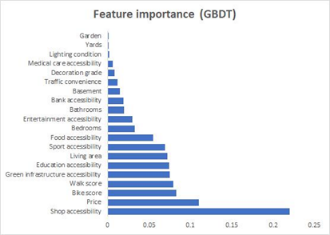
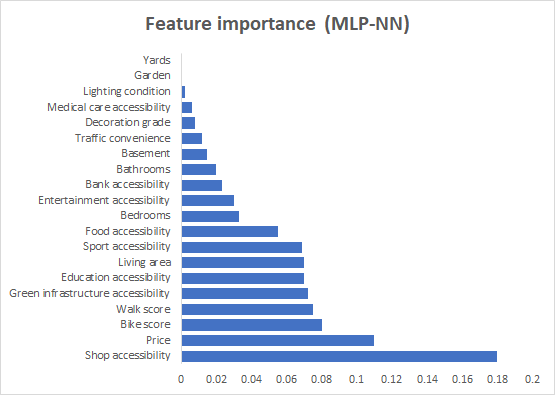
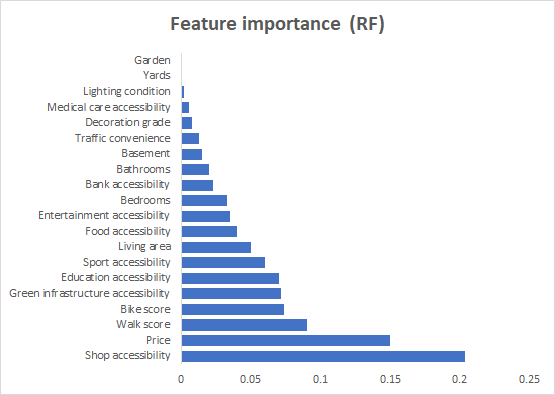
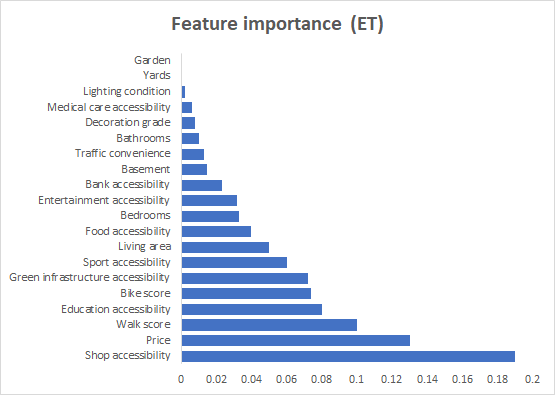
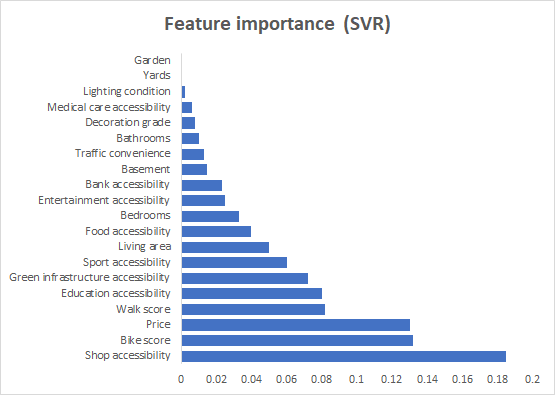
The machine learning algorithms performance are summarized in Table 3. GBDT ranks first in terms of predictive accuracy and lowest error estimates. Nine features, including Shop accessibility, Price, Bike score, Walk score, green infrastructure, education accessibility, living area, sport accessibility, and food accessibility present relatively higher importance estimated by all the machine learning algorithms and are therefore labeled as “reliable features”(Figure 2). After retraining with only these features with high weight ratio, the accuracy of all algorithms is enhanced (Table 4).
Table 4. Model performances of the algorithms.
All features | Reliable features | |||||
Accuracy | %RMSE | %MAE | Accuracy | %RMSE | %MAE | |
MLP-NN | 0.41 | 25.17 | 20.07 | 0.59 | 17.62 | 15.47 |
K-NN | 0.36 | 27.42 | 24.49 | 0.48 | 19.84 | 17.06 |
DT | 0.56 | 18.71 | 14.43 | 0.76 | 15.20 | 16.82 |
GBDT | 0.62 | 12.76 | 14.32 | 0.82 | 11.05 | 10.02 |
RF | 0.54 | 13.74 | 11.68 | 0.80 | 11.56 | 10.24 |
ET | 0.53 | 15.23 | 16.11 | 0.67 | 12.07 | 14.83 |
SVR | 0.43 | 24.78 | 23.29 | 0.51 | 20.14 | 19.08 |
|
Figure 2. Indicator weight rankings calculated by different machine learning algorithms. |

4.3. SES pattern within Brooklyn
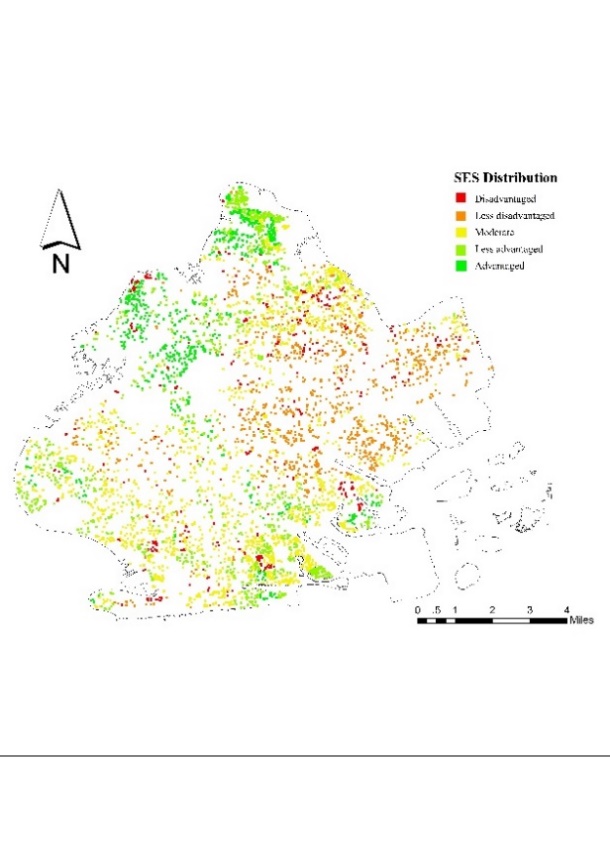
Figure 3 depicts the GBDT-generated NSES distribution pattern (the best-performing machine learning algorithm). It can be seen that there is significant NSES inequality in Brooklyn. The Moran index analysis was carried out to test the accuracy of the results. The global Moran I index score was 0.93, the z was 46.51, and the p-value was 0, which confirmed the autocorrelation of SES distribution in Brooklyn. Local Moran I maps further reinforce this consistency, and, in particular, high and low groupings should be of concern as they indicate the presence of some areas of deprivation.
|
Figure 3. NSES distribution and Local Moran I's map. |
4.4. The association between criminal activity and neighborhood SES
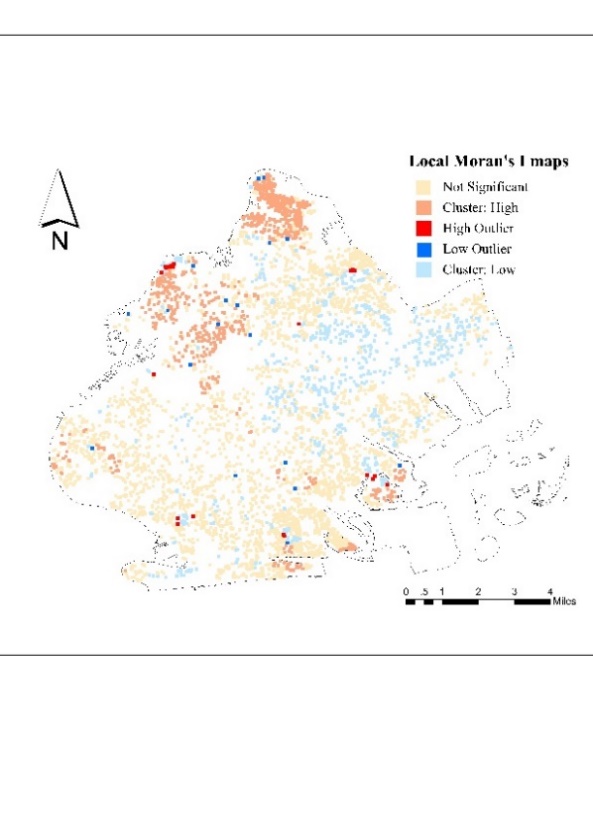
The crime rate of each housing unit in Brooklyn is between 0.0005 and 0.159, which is quite different. To preliminarily explore whether the crime rate has a potential spatial distribution pattern, the natural break point classification method was used to classify the crime rate in Brooklyn from January to June 2022 into five grades: high, medium-high, medium-low and low (Figure 4). The natural break point classification method detects the classification interval based on the natural grouping inherent in the data, with the goal of minimizing intra-class difference and maximizing inter-class difference.
|
Figure 4. Crime rate and its local Moran’s I map of Brooklyn. |
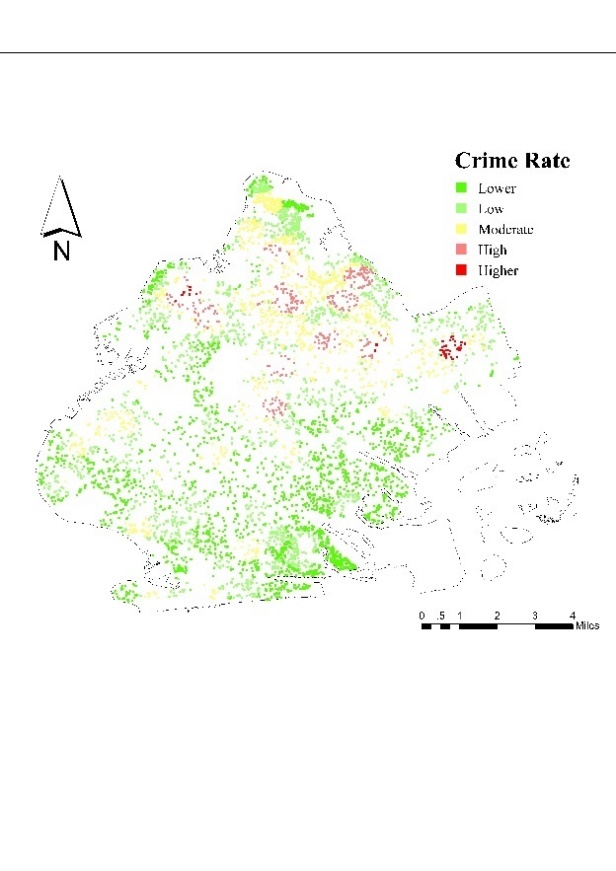
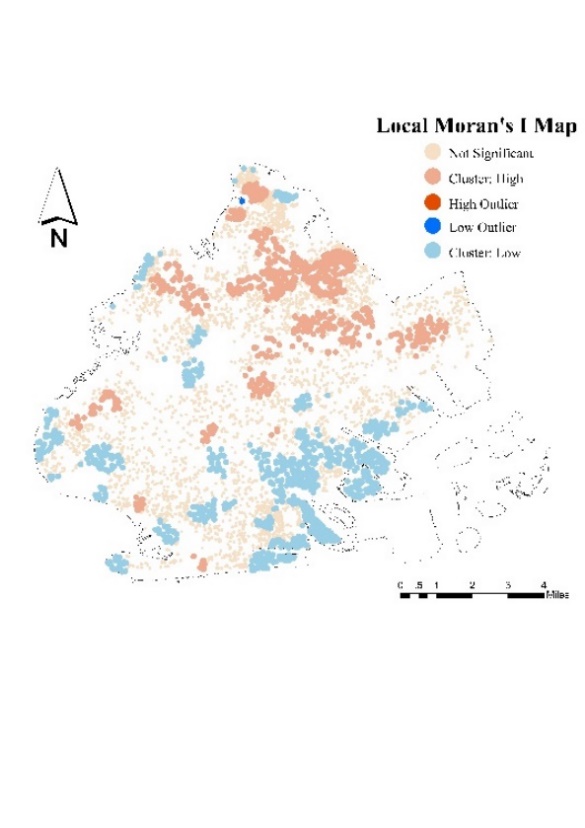
Figure 4 shows that the distribution of crime in Brooklyn has an obvious aggregation effect, and it highly coincides with the boundary of NSES distribution, with higher crime rates in the northeast and west. Figure 5 shows a crime hot spot map in Brooklyn categorized by crime severity. It can be seen that the distribution of crime in Brooklyn is concentrated in the northeast, and Violation type crime is the most common.
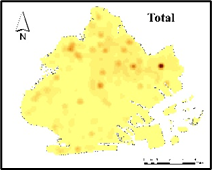
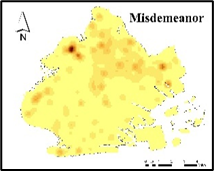
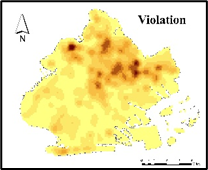
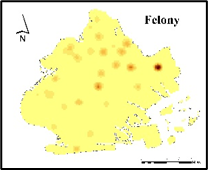
Figure 5. Crime rate heat map of Brooklyn by crime type.
The above analysis shows that the crime rate has autocorrelation in space, so the geographic weighted regression model in ArcGIS is used to fit various crime rates and NSES data. In this paper, the Gaussian kernel function and AICc bandwidth calculation method is selected to establish the GWR model. Figure 6 is the spatial distribution diagram of the standard residuals of the total crime rate. Figure 6 shows that the residuals of most statistical units are between -0.5 and 0.5, the standard residuals in the whole study area are minor, and those with absolute values greater than 2.5 are concentrated in some northern regions.
|
Figure 6. Spatial distribution of standard residuals of GWR(Total crime rate). |
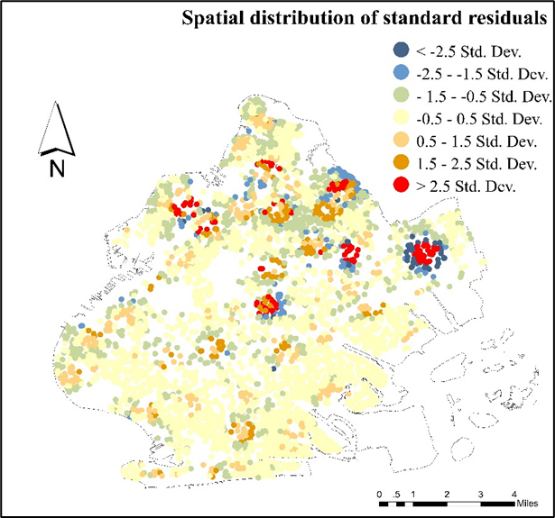
Table 5 displays the GWR model's diagnostic signs. R2 and R2 Adjusted measure how well the model fits the data; their values range from 0 to 1. The greater the value, the better the model fits the data. Table 5 shows that the model can explain 75.2% of the total crime rate variation, and the overall model has a good fitting effect. The R2 adjusted values of most variables were above 0.7. NSES had the best interpretation of Harassment and Burglary (0.878157 and 0.843320, respectively), and the worst interpretation of Sex crime (0.569421).
Table 5. Diagnostic index of the GWR model.
Crime Type | R2 | R2 Adjusted | Crime Type | R2 | R2 Adjusted |
Total | 0.767943 | 0.752376 | Harassment | 0.885852 | 0.878157 |
Assault | 0.677584 | 0.655850 | Murder | 0.696750 | 0.676309 |
Burglary | 0.853214 | 0.843320 | Petit larceny | 0.727985 | 0.709649 |
Endanger personal safety | 0.659076 | 0.636095 | Robbery | 0.804662 | 0.791494 |
Endanger public safety | 0.771821 | 0.756440 | Sex crime | 0.596613 | 0.569421 |
Motor vehicle larceny | 0.769169 | 0.753160 | Shooting | 0.788432 | 0.774171 |
5. Discussion
5.1. Using online advertising data to predict the viability of NSES in Brooklyn
By modifying the model of Wang et al [8], this paper verifies the applicability of the machine learning method for predicting NSES based on public data such as online housing ads in Brooklyn, USA. The results show that fine-grained neighborhood socioeconomic status can be predicted fairly accurately by adding amenity accessibility information obtained from Open Street Map and Walkscore data combined with online housing advertising. By comparing different machine learning algorithms, we identified nine features that reliably infer NSES. These characteristics are Shop accessibility, Price, Bike score, Walk score, green infrastructure, education accessibility, living area, sport accessibility, and food accessibility. In addition, we observed that although Zillow's housing advertising information emphasized the number of basements, gardens, and yards of a home, they were not recognized as valid predictors or even given low weight. One possible explanation is that Brooklyn houses are similar in these characteristics, resulting in insignificant differences between neighborhoods. This study is of interest to countries that lack publicly available data or fine-grained data sets, meaning that they can monitor the distribution of neighborhood SES in their own countries at any time based on publicly available, dynamic data.
5.2. Differences in crime rates by socioeconomic status
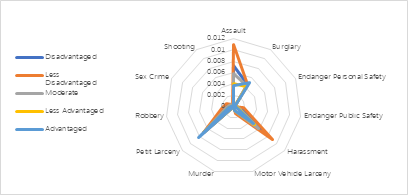
Through geographic weighted model analysis, this paper finds that the use of neighborhood socioeconomic status can effectively explain the distribution of some crime types, that is, criminal activities usually occur in areas with poor NSES. Among them, Harassment and Burglary were the best explanations, with Sex crime the worst. Figure 7 shows the distribution of different types of crimes in different NSES areas. It can be found that the most common types of crimes in Brooklyn were assault, burglary, petit larceny, and harassment. With the increase of NSES, the rates of all kinds of crimes decreased. burglary was higher in the most desirable socioeconomic area, probably because of the greater benefit of burglary in this area. This study verifies the impact of NSES on the occurrence of crime and helps to improve local crime through planning.
|
Figure 7. Crime rate distribution by different NSES areas. |
5.3. Strengths, limitations and prospects
This article has helped advance the use of public data for social segregation research, establishing a fine-grained neighborhood socioeconomic status estimation method for Brooklyn, USA, that relies entirely on publicly accessible data and open codes, opening new opportunities for other cities around the world. At the same time, this paper also verified the correlation between neighborhood socioeconomic status and criminal activities. The incidence of criminal activities is more likely to occur in disadvantaged communities, which helps relevant departments to improve urban safety through planning. However, there are still some limitations. First, this method has not been tested in a large number of cities. Second, advertising data may overlook some residents, such as the poor.
6. Conclusion
Using data collected from Zillow and other public data sets, this paper verifies the feasibility of using advertising data combined with machine learning model to predict NSES in Brooklyn, USA, and achieves an accuracy of 0.82. Then, the geospatial weighted regression model is used to analyze the relationship between fine-grained NSES and crime rate. It is found that there is a significant correlation between NSES and crime rate, that is, the crime rate decreases with the rise of socioeconomic status. This paper also found that NSES has the best explanation for harassment and burglar.
References
[1]. Mohler G. Marked point process hotspot maps for homicide and gun crime prediction in Chicago. International Journal of Forecasting. 2014 Jul 1;30(3):491–7.
[2]. Pijper LK, Breetzke GD, Edelstein I. Building neighbourhood-level resilience to crime: the case of Khayelitsha, South Africa. South African Geographical Journal. 2021 Jul 6;103(3):342–57.
[3]. Becker GS. Crime and Punishment: an Economic Approach. In: Fielding NG, Clarke A, Witt R, editors. The Economic Dimensions of Crime [Internet]. London: Palgrave Macmillan UK; 2000 [cited 2022 Oct 14]. p. 13–68. Available from: https://doi.org/10.1007/978-1-349-62853-7_2
[4]. Webb S, Janus M, Duku E, Raos R, Brownell M, Forer B, et al. Neighbourhood socioeconomic status indices and early childhood development. SSM - Population Health. 2017 Dec 1;3:48–56.
[5]. Molnar BE, Cerda M, Roberts AL, Buka SL. Effects of Neighborhood Resources on Aggressive and Delinquent Behaviors Among Urban Youths. Am J Public Health. 2008 Jun;98(6):1086–93.
[6]. Fabio A, Tu LC, Loeber R, Cohen J. Neighborhood Socioeconomic Disadvantage and the Shape of the Age–Crime Curve. Am J Public Health. 2011 Dec;101(S1):S325–32.
[7]. Niu T, Chen Y, Yuan Y. Measuring urban poverty using multi-source data and a random forest algorithm: A case study in Guangzhou. Sustainable Cities and Society. 2020 Mar 1;54:102014.
[8]. Wang L, He S, Su S, Li Y, Hu L, Li G. Urban neighborhood socioeconomic status (SES) inference: A machine learning approach based on semantic and sentimental analysis of online housing advertisements. Habitat International. 2022 Jun 1;124:102572.
[9]. Meng G, Hall GB. Assessing housing quality in metropolitan Lima, Peru. J Housing Built Environ. 2006 Dec 1;21(4):413–39.
[10]. Census Bureau Data [Internet]. Available from: https://data.census.gov/cedsci/
[11]. Yang TC, Kim S, Zhao Y, Choi S won E. Examining spatial inequality in COVID-19 positivity rates across New York City ZIP codes. Health & Place. 2021 May 1;69:102574.
[12]. Statistics - NYPD [Internet]. Available from: https://www1.nyc.gov/site/nypd/stats/stats.page
[13]. Smoyer-Tomic KE, Spence JC, Raine KD, Amrhein C, Cameron N, Yasenovskiy V, et al. The association between neighborhood socioeconomic status and exposure to supermarkets and fast food outlets. Health & Place. 2008 Dec 1;14(4):740–54.
[14]. Zhang X, Liu L, Xiao L, Ji J. Comparison of Machine Learning Algorithms for Predicting Crime Hotspots. IEEE Access. 2020;8:181302–10.
[15]. New York Police Department [Internet]. Available from: https://www1.nyc.gov/site/nypd/index.page
Cite this article
Qin,X. (2023). Correlation between fine-grained neighborhood socioeconomic status distribution and crime rates in New York city based on machine learning. Applied and Computational Engineering,6,39-51.
Data availability
The datasets used and/or analyzed during the current study will be available from the authors upon reasonable request.
Disclaimer/Publisher's Note
The statements, opinions and data contained in all publications are solely those of the individual author(s) and contributor(s) and not of EWA Publishing and/or the editor(s). EWA Publishing and/or the editor(s) disclaim responsibility for any injury to people or property resulting from any ideas, methods, instructions or products referred to in the content.
About volume
Volume title: Proceedings of the 3rd International Conference on Signal Processing and Machine Learning
© 2024 by the author(s). Licensee EWA Publishing, Oxford, UK. This article is an open access article distributed under the terms and
conditions of the Creative Commons Attribution (CC BY) license. Authors who
publish this series agree to the following terms:
1. Authors retain copyright and grant the series right of first publication with the work simultaneously licensed under a Creative Commons
Attribution License that allows others to share the work with an acknowledgment of the work's authorship and initial publication in this
series.
2. Authors are able to enter into separate, additional contractual arrangements for the non-exclusive distribution of the series's published
version of the work (e.g., post it to an institutional repository or publish it in a book), with an acknowledgment of its initial
publication in this series.
3. Authors are permitted and encouraged to post their work online (e.g., in institutional repositories or on their website) prior to and
during the submission process, as it can lead to productive exchanges, as well as earlier and greater citation of published work (See
Open access policy for details).
References
[1]. Mohler G. Marked point process hotspot maps for homicide and gun crime prediction in Chicago. International Journal of Forecasting. 2014 Jul 1;30(3):491–7.
[2]. Pijper LK, Breetzke GD, Edelstein I. Building neighbourhood-level resilience to crime: the case of Khayelitsha, South Africa. South African Geographical Journal. 2021 Jul 6;103(3):342–57.
[3]. Becker GS. Crime and Punishment: an Economic Approach. In: Fielding NG, Clarke A, Witt R, editors. The Economic Dimensions of Crime [Internet]. London: Palgrave Macmillan UK; 2000 [cited 2022 Oct 14]. p. 13–68. Available from: https://doi.org/10.1007/978-1-349-62853-7_2
[4]. Webb S, Janus M, Duku E, Raos R, Brownell M, Forer B, et al. Neighbourhood socioeconomic status indices and early childhood development. SSM - Population Health. 2017 Dec 1;3:48–56.
[5]. Molnar BE, Cerda M, Roberts AL, Buka SL. Effects of Neighborhood Resources on Aggressive and Delinquent Behaviors Among Urban Youths. Am J Public Health. 2008 Jun;98(6):1086–93.
[6]. Fabio A, Tu LC, Loeber R, Cohen J. Neighborhood Socioeconomic Disadvantage and the Shape of the Age–Crime Curve. Am J Public Health. 2011 Dec;101(S1):S325–32.
[7]. Niu T, Chen Y, Yuan Y. Measuring urban poverty using multi-source data and a random forest algorithm: A case study in Guangzhou. Sustainable Cities and Society. 2020 Mar 1;54:102014.
[8]. Wang L, He S, Su S, Li Y, Hu L, Li G. Urban neighborhood socioeconomic status (SES) inference: A machine learning approach based on semantic and sentimental analysis of online housing advertisements. Habitat International. 2022 Jun 1;124:102572.
[9]. Meng G, Hall GB. Assessing housing quality in metropolitan Lima, Peru. J Housing Built Environ. 2006 Dec 1;21(4):413–39.
[10]. Census Bureau Data [Internet]. Available from: https://data.census.gov/cedsci/
[11]. Yang TC, Kim S, Zhao Y, Choi S won E. Examining spatial inequality in COVID-19 positivity rates across New York City ZIP codes. Health & Place. 2021 May 1;69:102574.
[12]. Statistics - NYPD [Internet]. Available from: https://www1.nyc.gov/site/nypd/stats/stats.page
[13]. Smoyer-Tomic KE, Spence JC, Raine KD, Amrhein C, Cameron N, Yasenovskiy V, et al. The association between neighborhood socioeconomic status and exposure to supermarkets and fast food outlets. Health & Place. 2008 Dec 1;14(4):740–54.
[14]. Zhang X, Liu L, Xiao L, Ji J. Comparison of Machine Learning Algorithms for Predicting Crime Hotspots. IEEE Access. 2020;8:181302–10.
[15]. New York Police Department [Internet]. Available from: https://www1.nyc.gov/site/nypd/index.page