


1. Introduction
The concept of urban vitality was firstly proposed by Jacobs et al.[1]. Different people and different fields of expertise interpret it differently. Urban vitality is defined as the zing of cities providing citizens with the ability to live. Many studies show that a comprehensive diversity index and multi-dimensional perception of information have a better connection with urban vitality. And they put forward a series of diverse urban vitality indicators evaluating the framework[2].
This kind of framework is usually used in many different city operations data and statistical methods. For instance, Yang et al. used a series of data such as population density, street section length, and construction density that influence factors when studying the vitality of Binshui District, Shanghai slows traffic space[3]. They used the data generated by the mobile terminal (Baidu thermal effort) as an aid and geographically weighted regression models as the processing sing method of the data. Certainly, the vitality index in their study is regarded as the following index of the field sampling survey as the main index. It may have obvious one-sidedness. To get a better way to quantify the vitality index, this text wants to use additional data to reflect the viability value of one region. Fu et al. give a new angle. They use different institutions’ POI data to evaluate the viability value of different stations along the subway[4]. This kind of vitality will not be affected by the factors such as the time cycle or difficulty in finding the appropriate intervals. Fu’s study analyses data through the source of vitality and different institutions. It can reduce the error caused by the selection deviation of the flow time interval to a certain extent.
Shenzhen’s rapid development has made remarkable achievements in a brief period of forty years as a special economic zone since reform and openness. Shenzhen covers an area of 1,997.47 square kilometers. In the seventh population census, the permanent resident population of Shenzhen is 17.682 million. The per capita GDP was 173,700 yuan. From establishing the special economic zones to now, Shenzhen's economy has been growing at a high rate. The economy also ranks third in China. It has high economic vitality. Shenzhen's planning has experienced advanced adjustment and reform, such as technological exploration and system construction, making Shenzhen a pilot demonstration area of socialism with Chinese characteristics[5]. For such a representative and highly dynamic city with a leading role in China's urbanization development, the study of the development law of Shenzhen can not only be applied to this city but can also be extended to other cities in the urbanization process.
This study takes Shenzhen as an example, uses POI data with the characteristics of stability, high accuracy, and easy access, and discusses the relationship between urban vitality and time and space and the influence factors of urban vitality.
2. Data and methods
2.1. Data source
The POI data used is obtained from Baidu Maps. It includes food services, scenic spots, financial insurance, ancillary road facilities, access facilities, shopping services, science, education, and cultural services, life services, car services, car sales, car maintenance, car services, government agencies, and social groups, motorcycle services, indoor facilities, business housing, health insurance, health services, companies, public facilities, sports leisure services, accommodation services, and transportation services to a total of 21 POI data. This study considers that these data cover most of the service offerings, which can reflect the vitality of the city. In this study, the data this text used was mainly public data. It will help us get a new vitality value by calculation. As the contrast group, this study obtained thirteen influencing factors (including population data, transportation network, subway station, construct, and mixed land use) which are used to analyze association weights with new vitality values using a geographically weighted regression model [6]. Supplementary data are obtained from the OSM. Using multivariate data can better reflect the dynamic changes in urban vitality. Thus, they are used to verify the more accurate relationship between factors and vitality.
2.2. Methods
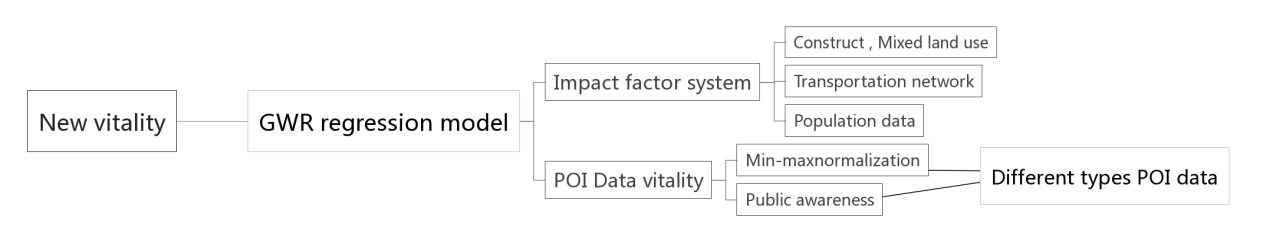
In the study, POI data has the characteristics of stability, high accuracy, and easy access. So it can better reflect the diversity of civic activities. It has been applied in urban infrastructure planning, urban business form hotspot identification, urban spatial structure identification, urban business spatial cluster analysis, and other aspects [4]. Transportation analysis zone (TAZ) is a research subject classification method that can adopt in addition to administrative areas. TAZ is a planning area with spatial homogeneity in social-economic characteristics and land use. This kind of zone can provide a reference for the description of travel characteristics and transportation policy [7]. It can also better reflect the activities of the citizens through the key traffic points and then reflect the vitality of the city. With Shenzhen TAZ as the basic unit area, this text put 21 POI data into ArcGIS and calculated new vitality values using Min-max normalization and impact weights of the different institutions. Then this text uses a geographically weighted regression (GWR) model to obtain the degree of influence and the weight results of the 13 influence factors and compare with it to test the reliability of different influence factors on urban vitality (Figure 1) [6]. According to the comparison of the two vitality values of different regions of Shenzhen, the evaluation method is verified whether it is reliable.
|
Figure 1. Data structure and computational method framework. |
2.3. Calculation of POI vitality density
The calculation of POI vitality density based on the formula of site density activity is:
\( E_{i}^{ \prime }=\sum _{j}^{n}\frac{{k_{ij}}}{{K_{j}}}{R_{j}}\ \ \ (1) \)
Where Ei is the contribution of various POI facilities without standardization to the vitality of site I; Kij is the number of type j POI facilities per unit area within the service radius of site I; Kj is the number of class j POI facilities per unit area in the whole area; Rj is the weight of class j POI facilities contributing vitality to site i.
The non-dimensional site density vitality is obtained using the deviation normalization method:
\( {E_{i}}=\frac{E_{i}^{ \prime }-\underset{1≤j≤n}{min}\begin{cases}E_{j}^{ \prime }\rbrace \end{cases}}{\underset{1≤j≤n}{max}\begin{cases}E_{j}^{ \prime }\rbrace -\underset{1≤j≤n}{min}\begin{cases}E_{j}^{ \prime }\rbrace \end{cases}\end{cases}}\ \ \ (2) \)
2.4. The regression analysis of data density
The variables v5, v6, v7, v15, and v16 show a significant relationship (Table 1).
(1) There was a negative correlation with building (v5), which was significant at the 1% level, and the regression coefficient was -0.269.
(2) It is negatively correlated with the employed population (v6), which is significant at the 10% level, and the regression coefficient is -0.0293.
(3) There is a positive correlation with population density (v7), which is significant at the 10% level, and the regression coefficient is 2.58e-06.
(4) It is positively correlated with the population density (v15), which is significant at the 5% level, and the regression coefficient is 0.000908.
(5) There was a negative correlation with TAZ(v16), which was significant at the 10% level, and the regression coefficient was -0.00163.
It can be seen that the vitality density has a significant relationship with the variables of building, employment population, population density to citizens, and TAZ. Among them, the impact of building was the largest and showed a negative correlation, while the effects of population density was the least.
Comparative analysis is V3 and v18 are the vitality density values calculated from two kinds of data, respectively.
Table 1. The Regression Analysis of All Kinds of POI Categories.
Impact Factor | POI Vitality Density | Prominence |
Total Building | 0.0312 | |
(0.0239) | ||
Building | -0.269 | *** |
Table 1. (continue)
Impact Factor | POI Vitality Density | Prominence |
Building | (0.101) | |
Employment Density | -0.0293 | * |
(0.0171) | ||
0.00000258 | * | |
(0.00000134) | ||
High-education | -0.000000494 | |
(0.00000197) | ||
Average Income | 0.00242 | |
(0.00536) | ||
Lands | 0.0281 | |
(0.0247) | ||
Public Bus | 0.000072 | |
(0.000136) | ||
Railways | -0.0102 | |
(0.0116) | ||
Roads | -0.00127 | |
(0.00137) | ||
Streets | 0.000645 | |
(0.00142) | ||
Residents | 0.000908 | ** |
(0.000432) | ||
TAZ | -0.00163 | * |
(0.000967) | ||
Constant | 0.347 | *** |
(0.0259) | ||
R-squared | 0.174 |
Standard errors are in parentheses. *** p<0.01, ** p<0.05, * p<0.1
3. Results
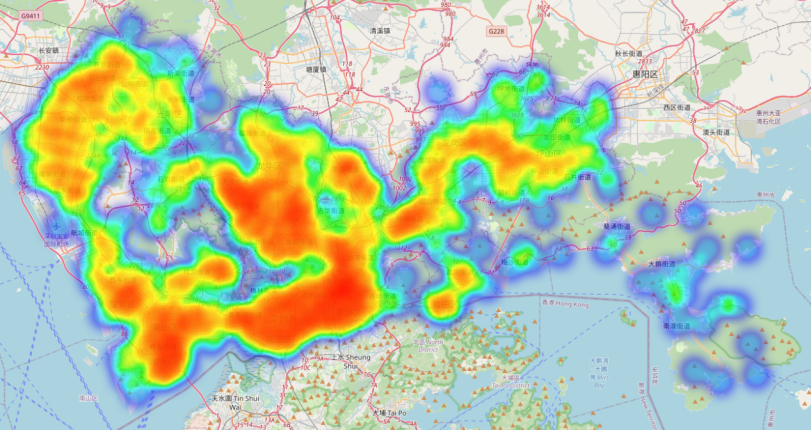
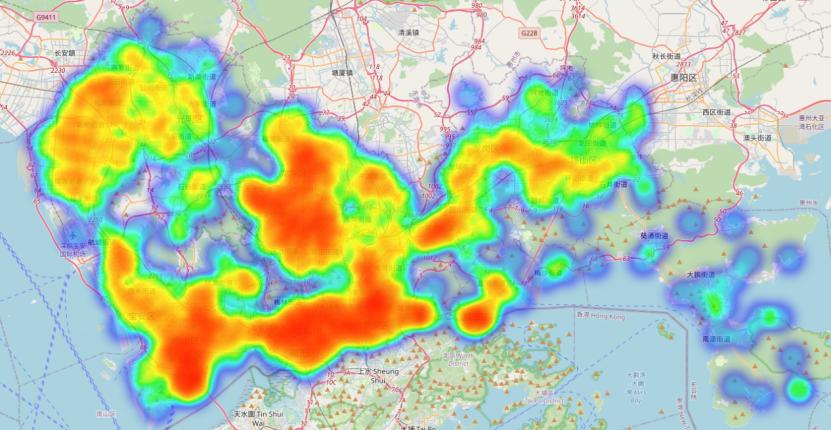
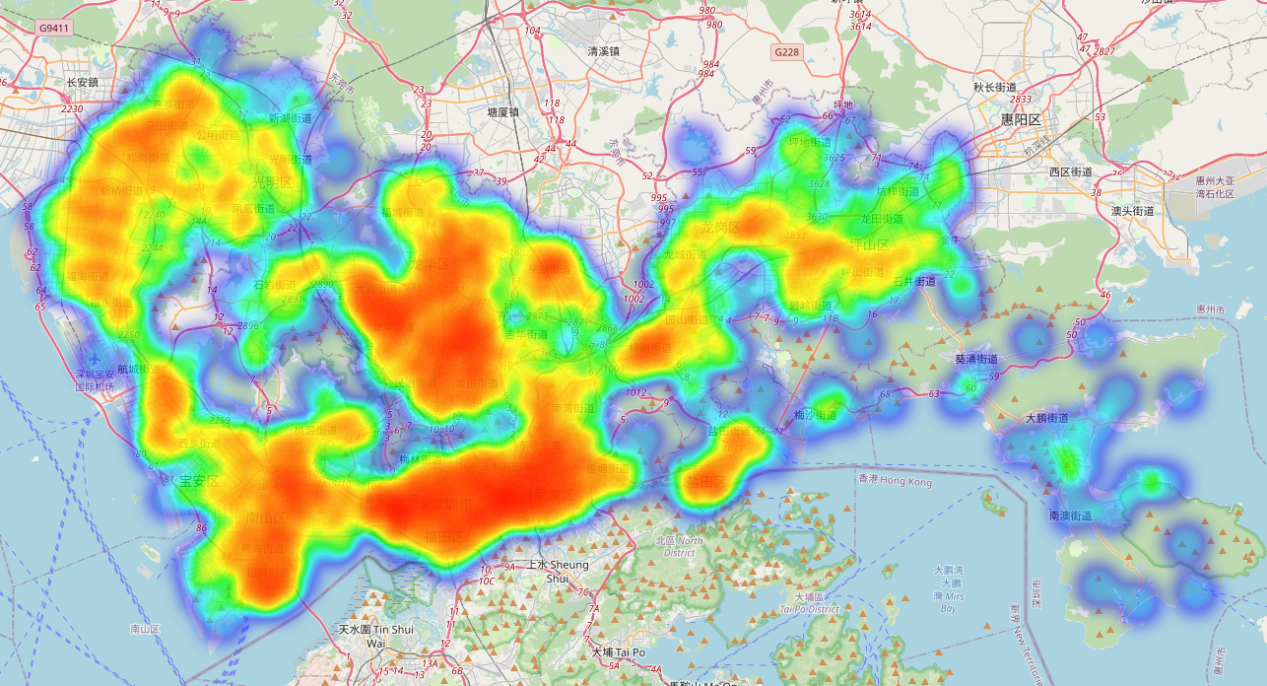
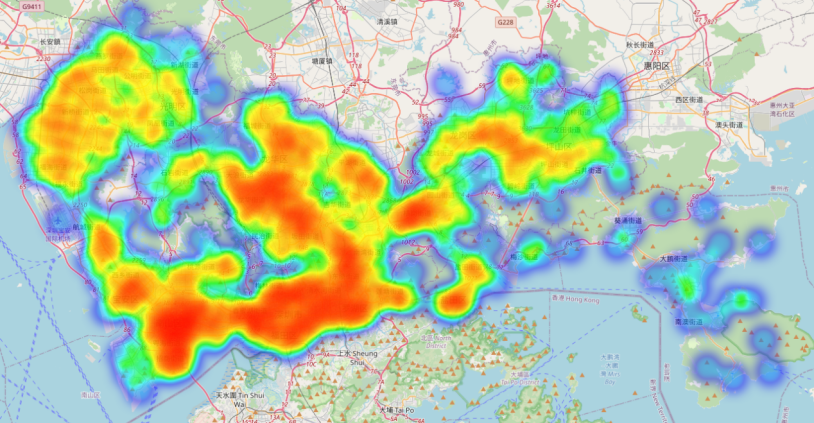
It can be seen from the distribution map that the five significant factors have the most obvious influence in the Luohu District and Nanshan District of Futian District (Figures 2-6), which are building, employment population, population density, citizens, and TAZ. These five factors have a close relationship with a city’s vitality. Much more buildings mean that this city has a high vitality because buildings not only push the development of the city but also solve the unemployment issue. Much more employment-population means that this city can offer much more working opportunities, which refers to a factor causing city vitality. Population density also presents a city’s vitality and a high density of population means a high city vitality. The transportation system also represents a city’s vitality. After the vigor density analysis of the two data sources, there is a common feature: their significant influence factors have the most obvious influence in Luohu District and Nanshan District of Futian District. These three regions had the highest vitality. The design is correct and reasonable according to the checking model, an effective Model Checking.
| ||
Figure 2. Distribution diagram of the building factor regression coefficient. | ||
| ||
Figure 3. Distribution diagram of the regression coefficient of the employment-population factor. | ||
| ||
Figure 4. Distribution diagram of the population density factor regression coefficient. | ||
| ||
Figure 5. Distribution diagram of the regression coefficient from and to the citizen factor. | ||
| ||
Figure 6. Distribution plot of the regression coefficients compared to the TAZ factors. | ||

4. Discussion
The impact factor is evaluated when found that the same energy density gap is the biggest influence factors of the building, presents the negative correlation function, effect on the population density of the smallest, with almost no effect no other impact factors, the social behavior of mass change of building entities such as direct production dynamic economic class social resource has a more does not comply with the law.
Shenzhen is a megacities that has successfully gone through urbanization in China. For the other cities, the relationship between vitality density and influence factor reflected in Shenzhen has an important guiding significance. Through the contribution degree of various POI,it can be obtained that the vitality of a city does not entirely depend on the number of the highest contribution type factor. Similarly, not all types of factor values are at a peak state that can make the city more dynamic. It can only produce an average state. Through the analysis of the hotspot map, it can be concluded that the more dynamic areas are often in the areas with more complete interest points and meet the needs of the local population.In the process of promoting regional urbanization construction, local governments should pay attention to the development strategy of adjusting measures to local conditions, comprehensively consider the influencing factors of population, transportation, trade and other aspects, take local characteristics as the main development goal, and maintain the stability of the city by adjusting the proportion of various factors, so that it is in a high level for a long time [8-10].
In addition to the consideration of influencing factors for vitality, the planning of key areas for vitality is also worth discussing. Based on the hot spot map of vitality obtained with reference to the validated judging system, urban planners will also consider whether to pursue the equalization of urban hot spots in their work. If we want to pursue the equalization of urban heat, there may be two situations in general. First, the total amount of urban vitality is constant, but it is forced to be evenly distributed by government factors. Such attempts usually lead to the lack of attractive core areas in the city, leading to the slow development and even decline of the total amount of urban vitality resources. A case in point is Brasilia, Brazil's newly built capital. The second is that in the rapid development process of urban normal regional differentiation, the government deliberately tilts resources to the low vitality value of the region. Whether this practice can be used for reference still needs to be compared and analyzed by different cities using the same vitality evaluation system. But in fact, Shenzhen is a highly typical city with this phenomenon. The first developed area in Shenzhen was Luohu District, followed by Futian District, then Nanshan District, and now Baoan District and Longhua District. As can be seen from the vitality hot spot map, Nanshan District is now the region with the highest vitality, followed by Futian District, and Luohu District is the third. Phenomenally, it seems that the newer core areas will have a better performance of vitality. Of course, this also needs to take into account factors such as urban renewal. However, from the results, it can still be found that when the vitality value of the current core area rises, it tends to absorb the vitality of the former city, which makes the vitality of the former city relatively reduced, and finally creates the current center. The pursuit of dynamic equilibrium is not only undesirable, but also can be seen to be difficult to achieve. This is also a possible conclusion that can be drawn from the example of Shenzhen [11-12].
Back to the evaluation system of urban vitality. In conclusion, at the beginning of 2020, the COVID-19 epidemic has been spreading and sweeping the world, constituting a "global pandemic". Under the impact of the epidemic, the social and economic development of cities across the country has been affected to varying degrees, with urban vitality plummeting, and there is no characteristic of weekly shift. With the adoption of lockdown measures, the spread of the epidemic has been brought under control in just over a month, and the initial results of the fight against the epidemic have been achieved. Subsequently, the city gradually recovered and the vitality of the city gradually recovered [13]. Social functions in addition to the import and export trade limited in 2021, mainly have returned to the original level, but still influence the real economy, On this basis, according to Yu outbreak a few years before (contents to September 18th), Tu et al. proposed urban vitality to judge whether system effectiveness is still worth studying. In this case, the evaluation system can be widely used in the vitality test of various large-scale cities around the world [6].
5. Conclusion
This study takes Shenzhen as an example, uses 21 POI data obtained from open source, and discusses the relationship between urban vitality and time and space and the influence factors of urban vitality.
By comparing the data of 2018 and 2011 with the same method and the same city-unified structure in different years, it can be found that the areas with high urban vitality still have high vitality, which is mainly concentrated in Nanshan, Futian and Luohu, showing a trend of decreasing vitality from south to north. It also shows that the vitality of the special zones is higher than that of the non-special zones. As a consequence, Shenzen, as an economic special zone of China, has high vitality. However, COVID-19 has prevented the rapid development of Shenzhen. Based on five factors influencing a city’s vitality, which included building, employment population, population density, citizens, and TAZ. These five factors have a close relationship with a city’s vitality. Much more buildings mean that this city has a high vitality because buildings not only push the development of the city but also solve the unemployment issue. Much more employment-population means that this city can offer much more working opportunities, which refers to a factor causing city vitality. Population density also presents a city’s vitality and a high density of population means a high city vitality. The transportation system also represents a city’s vitality. To recover Shenzhen’s city vitality, it is necessary to take measures to recover five factors. It is necessary to pursue the partial vitality of a city.
References
[1]. Jacobs, J. The death and life of American cities. New York, NY: Vintage Book Company. 1961
[2]. Guan Shu, Dang Yuting, Zhao Kai. Research on the spatial characteristics of urban vitality based on multi-dimensional perception[J/OL]. Journal of Geo-Information Science:1-16[2022-09-09].http://kns.cnki.net/kcms/detail/11.5809.P.20220426.1627.002.html
[3]. Yang Chunxia, Lv Chengzhe. Impact factor of waterfront slow walking activity based on the GWR model——Take the typical Binshui area along the Huangpu River in Shanghai as an example[J]. Journal of Human Settlements in West China,2022,37(03):55-62.DOI:10.13791/j.cnki.hsfwest.20220308.
[4]. Fu Dongwen, Han Yin, Wang Xinyu. Research on the Vitality of Urban Rail Transit Stations Based on POI Data[J]. Transportation Standardization,2021,7(06):69-78.DOI:10.16503/j.cnki.2095-9931.2021.06.008.
[5]. Zhao Guangying, Song Jusheng. Planning view of history: Review of Shenzhen's planning process since the reform and opening up[J]. Journal of Urban Studies,2022,43(04):23-31.
[6]. Tu Wei, Zhu Tingting, Xia Jizhe, Zhou Yulun, Lai Yani, Jiang Jincheng, Li Qingquan. Portraying the spatial dynamics of urban vibrancy using multisource urban big data[J]. Computers, Environment and Urban Systems,2020,80(C).
[7]. Yao Hong,Chen DongMei. Comparison of apportionment methods for assigning trip data to rezoned traffic analysis zones: A case study of Toronto, Canada[J]. The Canadian Geographer / Le Géographe canadien,2021,65(3).
[8]. Liu, S., Zhang, L., and Long, Y. (2019). Urban vitality area identification and pattern analysis from the perspective of time and space fusion. Sustainability.
[9]. Yue, W. Chen, Y. Zhang, Q. Liu, Y. Spatial Explicit Assessment of Urban Vitality Using Multi-Source Data: A Case of Shanghai, China. Sustainability 2019, 11, 638.
[10]. Jin, X. Long, Y. Sun, W. Lu, Y. Yang, X. Tang, J. Evaluating cities’ vitality and identifying ghost cities in China with emerging geographical data. Cities 2017, 63, 98–109, doi:10.1016/j.cities.2017.01.002.
[11]. Sung, H.; Lee, S. Cheon, S.H. Operationalizing Jane Jacobs’s Urban Design Theory: Empirical Verification from the Great City of Seoul, Korea. J. Plan. Educ. Res. 2015, 35, 117–130, doi:10.1177/0739456X14568021.
[12]. Sung, H. Lee, S. Residential built environment and walking activity: Empirical evidence of Jane Jacobs’ urban vitality. Transp. Res. Part D Transp. Environ. 2015, 41, 318–329.
[13]. Li Luanqiong,Liu Da,Li Zhigang.Analysis of the spatial and temporal characteristics of China's urban vitality recovery under the COVID-19 epidemic[J].Modern Urban Research,2022(06):1-7+15.
Cite this article
Deng,C.;Li,Z. (2023). The comment trial and comparison of urban vitality based on POI data: A case study of Shenzhen. Applied and Computational Engineering,6,59-66.
Data availability
The datasets used and/or analyzed during the current study will be available from the authors upon reasonable request.
Disclaimer/Publisher's Note
The statements, opinions and data contained in all publications are solely those of the individual author(s) and contributor(s) and not of EWA Publishing and/or the editor(s). EWA Publishing and/or the editor(s) disclaim responsibility for any injury to people or property resulting from any ideas, methods, instructions or products referred to in the content.
About volume
Volume title: Proceedings of the 3rd International Conference on Signal Processing and Machine Learning
© 2024 by the author(s). Licensee EWA Publishing, Oxford, UK. This article is an open access article distributed under the terms and
conditions of the Creative Commons Attribution (CC BY) license. Authors who
publish this series agree to the following terms:
1. Authors retain copyright and grant the series right of first publication with the work simultaneously licensed under a Creative Commons
Attribution License that allows others to share the work with an acknowledgment of the work's authorship and initial publication in this
series.
2. Authors are able to enter into separate, additional contractual arrangements for the non-exclusive distribution of the series's published
version of the work (e.g., post it to an institutional repository or publish it in a book), with an acknowledgment of its initial
publication in this series.
3. Authors are permitted and encouraged to post their work online (e.g., in institutional repositories or on their website) prior to and
during the submission process, as it can lead to productive exchanges, as well as earlier and greater citation of published work (See
Open access policy for details).
References
[1]. Jacobs, J. The death and life of American cities. New York, NY: Vintage Book Company. 1961
[2]. Guan Shu, Dang Yuting, Zhao Kai. Research on the spatial characteristics of urban vitality based on multi-dimensional perception[J/OL]. Journal of Geo-Information Science:1-16[2022-09-09].http://kns.cnki.net/kcms/detail/11.5809.P.20220426.1627.002.html
[3]. Yang Chunxia, Lv Chengzhe. Impact factor of waterfront slow walking activity based on the GWR model——Take the typical Binshui area along the Huangpu River in Shanghai as an example[J]. Journal of Human Settlements in West China,2022,37(03):55-62.DOI:10.13791/j.cnki.hsfwest.20220308.
[4]. Fu Dongwen, Han Yin, Wang Xinyu. Research on the Vitality of Urban Rail Transit Stations Based on POI Data[J]. Transportation Standardization,2021,7(06):69-78.DOI:10.16503/j.cnki.2095-9931.2021.06.008.
[5]. Zhao Guangying, Song Jusheng. Planning view of history: Review of Shenzhen's planning process since the reform and opening up[J]. Journal of Urban Studies,2022,43(04):23-31.
[6]. Tu Wei, Zhu Tingting, Xia Jizhe, Zhou Yulun, Lai Yani, Jiang Jincheng, Li Qingquan. Portraying the spatial dynamics of urban vibrancy using multisource urban big data[J]. Computers, Environment and Urban Systems,2020,80(C).
[7]. Yao Hong,Chen DongMei. Comparison of apportionment methods for assigning trip data to rezoned traffic analysis zones: A case study of Toronto, Canada[J]. The Canadian Geographer / Le Géographe canadien,2021,65(3).
[8]. Liu, S., Zhang, L., and Long, Y. (2019). Urban vitality area identification and pattern analysis from the perspective of time and space fusion. Sustainability.
[9]. Yue, W. Chen, Y. Zhang, Q. Liu, Y. Spatial Explicit Assessment of Urban Vitality Using Multi-Source Data: A Case of Shanghai, China. Sustainability 2019, 11, 638.
[10]. Jin, X. Long, Y. Sun, W. Lu, Y. Yang, X. Tang, J. Evaluating cities’ vitality and identifying ghost cities in China with emerging geographical data. Cities 2017, 63, 98–109, doi:10.1016/j.cities.2017.01.002.
[11]. Sung, H.; Lee, S. Cheon, S.H. Operationalizing Jane Jacobs’s Urban Design Theory: Empirical Verification from the Great City of Seoul, Korea. J. Plan. Educ. Res. 2015, 35, 117–130, doi:10.1177/0739456X14568021.
[12]. Sung, H. Lee, S. Residential built environment and walking activity: Empirical evidence of Jane Jacobs’ urban vitality. Transp. Res. Part D Transp. Environ. 2015, 41, 318–329.
[13]. Li Luanqiong,Liu Da,Li Zhigang.Analysis of the spatial and temporal characteristics of China's urban vitality recovery under the COVID-19 epidemic[J].Modern Urban Research,2022(06):1-7+15.