


1. Introduction
In daily life, human emotions play a crucial role [1], which affects many aspects of our lives, such as social interactions, behaviors, attitudes, and decisions [2]. Therefore, understanding human emotional patterns and people's feelings plays a crucial role in various applications such as public health and safety, emergency response, and urban planning [3]. Architecture, as an essential part of daily life, is no longer merely a physical space. The design of indoor space not only affects the comfort of the residents, but also has a direct impact on emotional and psychological states. For example, reasonable spatial layout and appropriate use of color can significantly improve the happiness of residents and promote the formation of positive emotions [4].
Emotions have very complex, multidimensional properties and can be expressed through several modalities, such as faces and movements, sounds and written language [5]. Although advances in technology have enabled users of social networking platforms to express emotions through "audio" and "video," "text" remains the most common method of communication in social networks. People usually convey their emotions through social network posts (such as status updates, comments, blogs, and Weibo, etc.) [6]. The rapid growth of emotion-rich text data makes it necessary to automatically identify and analyze the emotions expressed by people in texts [2].
2. Related works
2.1. Text based emotion analysis model
To date, many studies have used various techniques to detect emotions from social media texts and applied them in a wide range of areas. Sailunaz and Alhajj [6] used Twitter data to detect emotions and sentiments from text. They utilized emotion and sentiment scores to generate universal and personalized recommendations based on users' Twitter activities. Coviello et al. [7] explored emotional contagion on Facebook, using instrumental variable regression to analyze Facebook posts to detect people's positive and negative emotions on rainy days and the impact of a person's emotions on their friends' emotions. Rodriguez, Chen, and Argueta [8] applied sentiment analysis technology to identify hate speech on Facebook. The aim was to locate and analyze unstructured data in specific social media posts, identifying data spreading hate in the comments section.
The GoEmotions dataset used in this article is a human-annotated collection of 58,000 carefully selected Reddit comments, categorized into 27 emotional categories or neutral, aiming to support fine-grained sentiment analysis. Compared to Ekman's taxonomy, this classification covers more positive, negative, and ambiguous emotional categories, suitable for tasks requiring subtle emotional understanding [9]. At the same time, this annotated dataset has been analyzed more comprehensively, and the reliability of emotional categories has been verified through principal component analysis [10], which improves the accuracy of sentiment analysis results.
It has been found that humans have a small set of basic emotions that are discrete and detectable through an individual's verbal/nonverbal expressions [11]. Researchers try to identify and define some basic emotions that are common to all people, thereby building a variety of emotion classification models. The most popular one is a cross-cultural study by Ekman et al [11], which divided basic human emotions into six types, namely fear, joy, anger, sadness, surprise and disgust. Unlike basic emotion models, dimensional models use continuous scales to define emotions. The Circumplex model proposed by Russell is the most widely used dimensional model. It distributes emotions in a two-dimensional circular space, including two dimensions: pleasure (horizontal axis) and activation (vertical axis). Pleasure measures the positivity or negativity of an emotion, while activation assesses a person's likelihood of taking action [12]. On the basis of these studies, in order to identify emotions more accurately, the taxonomy was created into hierarchical groupings, and model performance was evaluated at each level [9]. The sentiment hierarchy divides labels into four categories: positive, negative, ambiguous and Neutral, where the neutral category remains unchanged. Further divisions are made based on the use of neutral labels and six groups at the Ekman level: anger (maps to: anger, annoyance, disapproval), disgust (maps to: disgust), fear (maps to: fear, nervousness), joy (all positive emotions), sadness (maps to: sadness, disappointment, embarrassment, grief, remorse) and surprise (all ambiguous emotions).
2.2. The influence of indoor space components on people's emotions
Many studies have explored the impact of indoor space factors on human emotions. With the advancement of technology and the emergence of the field of neuroscience, researchers now have access to new quantitative tools and methods for measuring emotions.
Vafaee et al. [13] sorted out and summarized multiple studies on the application of neuroscience to explore the impact of components of architectural interior space on human emotions. The results showed that the physical parameters of indoor space, such as form, materials and texture, furniture, ceiling height, architectural details, and openness to nature all have an impact on mood. These factors influence emotional states, giving rise to feelings such as enjoyment, pleasure, arousal, and even disgust.
The study by Banaei et al. [14] investigated the impact of the spatial shape of an indoor living room on people' emotions and brain activity. Research showed that curved geometry has a significant impact on the anterior cingulate cortex (ACC). The smaller the curvature of the space, the greater the pleasure; conversely, the greater the curvature of the space, the lower the pleasure. Zhang, Lian & Wu [15] investigated people's physiological responses in wooden and non-wooden indoor environments. The results showed that participants experienced less stress and fatigue in the wooden room compared to the non-wooden room. Vatanian et al. [16] studied the impact of ceiling height and space as visually permeable components on aesthetic judgment and decision-making in architectural design. They concluded that rooms with higher ceilings are generally more appealing to occupants, while rooms with low and narrow ceilings activate the anteromedial cortex (aMCC) in viewers, prompting a desire to leave. Yin et al. [17] evaluated different office environments (open, semi-closed, and closed) using virtual reality and found that being close to nature can reduce stress and enhance creativity. Additionally, outdoor environments are more effective in relieving stress.
In addition, Lee et al. [18] used virtual reality technology to explore the adequacy of residential space design. The final data in their study showed that bright colors can effectively produce a pleasant feeling in participants. Color psychology shows that different colors can also evoke different emotional responses. For example, blue is usually associated with calmness and relaxation, while red may cause excitement or anxiety [19]. Knez [20] found that different parameters of indoor lighting (such as brightness and color temperature) can significantly affect an individual's emotional state. His study showed that lower lighting brightness (300 lx) and "warm" white light (3000K) usually induce more positive emotions, while higher brightness (1500 lx) and "cool" white light (4000K) may lead to an increase in negative emotions.
Table 1 is a summary of these indoor spatial factors with their emotional impact on people. These labels are later used as tags in the training of the LoRA model.
Table 1: The influence of indoor space components on human emotions | ||
Space component | Tags | Human emotions |
Space form | curved geometries | Curved spaces reported more pleasure. |
Material | wooden | People feel less nervous and fatigued in wooden spaces. |
Ceiling height | … ceiling height | People prefer rooms with higher ceilings; short and narrow ceilings make people choose to leave. |
Access to nature | greenery | Greenery reduces stress and enhances pleasure. |
Lighting | … lighting | Warm light inspires positive emotions in people. |
Colour | … colour | The bright color can make people feel happy. |
3. Methodology
This research aims to train a LoRA model that can bring happy & inactive emotions to people. This emotional classification comes from the Circumplex model of affect including 28 affect words proposed by Russell [12]. Under the happy & inactive category, it includes content, satisfied, at ease, serene, calm, relaxed, sleepy, and tired. These 8 emotions are recognized to bring people relief and calm. In the GoEmotions emotion classification, this type of emotion may correspond to admiration, love, approval, amusement, gratitude, relief, joy, and neutral in the categories of positive and neutral emotions.
3.1. Data collection
Through online research and evaluation of posts on social media platforms such as Twitter, Facebook, Instagram, as well as design websites like Archdaily, Behance, and Pinterest, it was ultimately found that Instagram posts stand out with a higher number of comments, more diverse user emotions, and uniformly sized images that are convenient for post-processing. This made Instagram the most suitable platform for this study. Consequently, 53 interior design posts with a large number of comments and rich content were selected from Instagram, and their images along with corresponding comments were collected through data scraping to create the dataset.
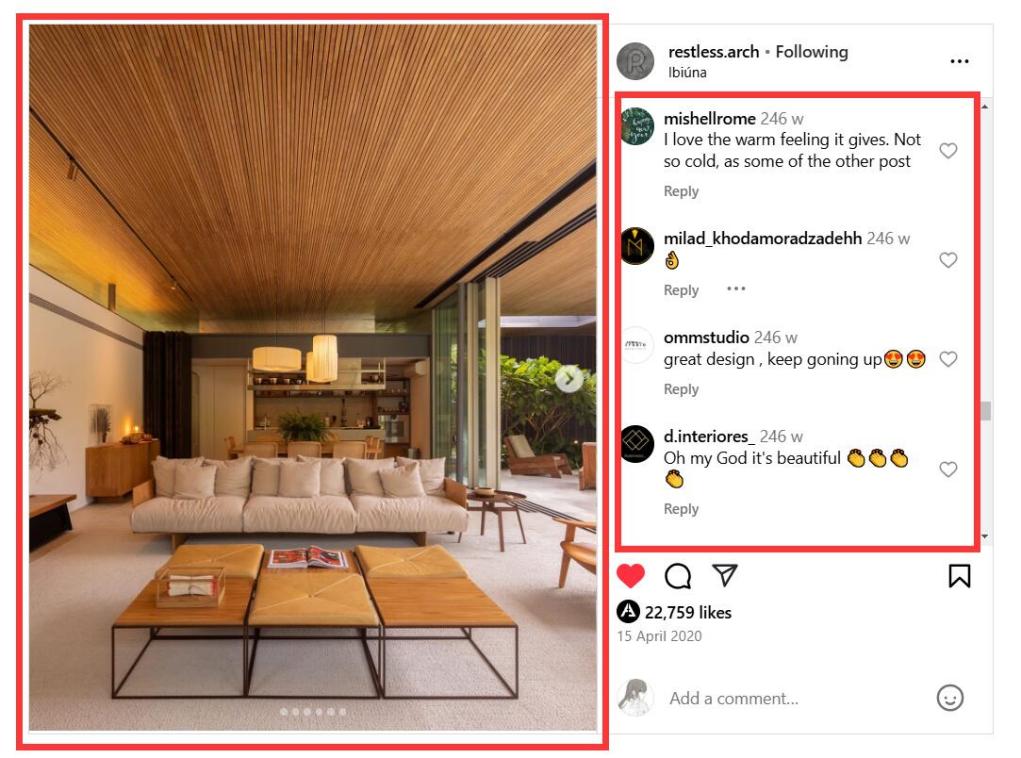
Figure 1: Pictures and comments of post on Instagram.
3.2. Sentiment and emotion detection
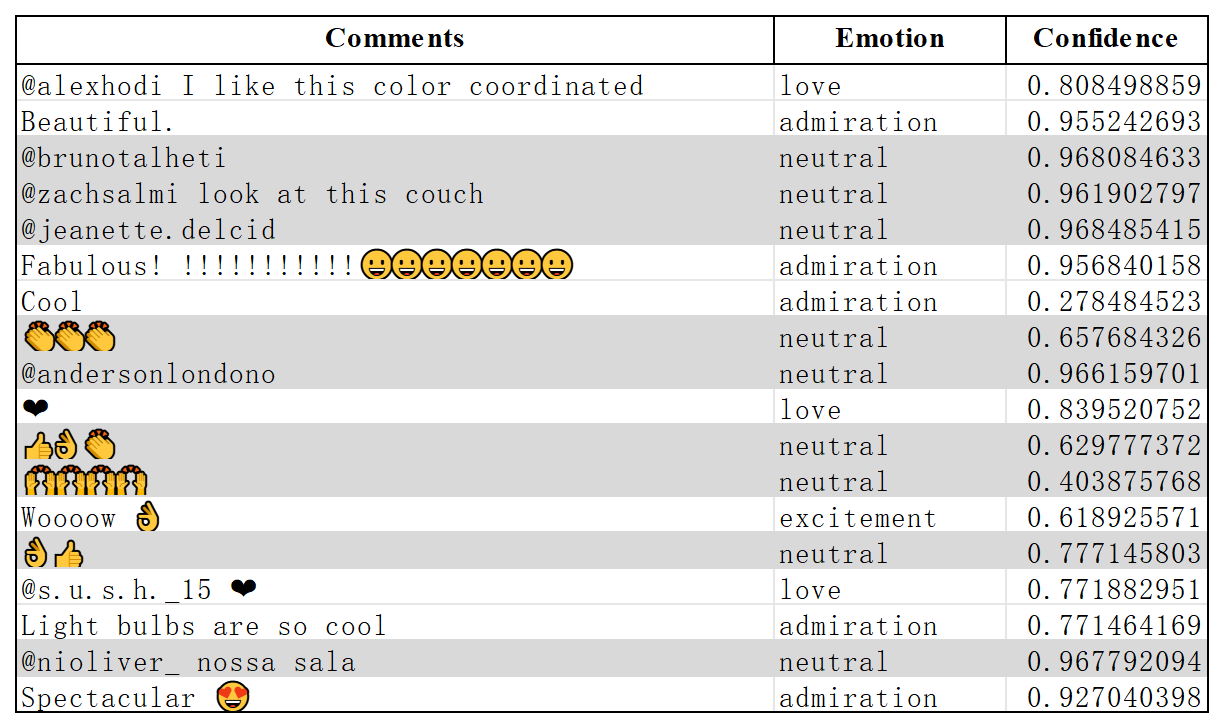
The GoEmotions model is used to perform text emotion recognition on the comments of collected post s. The final result shows the emotional keyword and its confidence. Data with the results of "neutral" is deleted. Then the weight of each emotional keyword is calculated and ranked.
|
|
Figure 2: Comments with sentiment analysis results. | Figure 3: Weight ranking of Emotion |

3.3. Data processing
In the first step of data selection, posts about indoor spaces with different styles, colors, and functions were collected. However, from the results of sentiment analysis, almost all posts ranked the top few emotions as admiration, love, approval, and amusement. However, these emotions were more of a specific emotional response, rather than the reviewer's emotional feelings about the space. Even spaces with very different artistic conceptions may produce highly similar sentiment analysis results. Based on this, a second round of data screening was conducted. 8 keywords in happy & inactive category were selected and expanded through the WordNet synonym dictionary [21] to finally get a total of 87 emotional words. The 53 posts were re-searched in the description and comments using these 87 words. Ultimately, 18 posts were sort out.
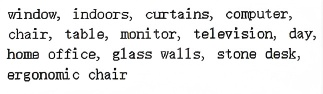
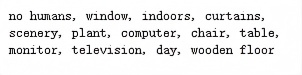
Before LoRA training, the 18 posts' images are cropped to 512x512 pixels to match Stable Diffusion’s pre-training model, and ensure consistent dimensions across all images. Following this, the images were reviewed and close-ups were removed. After cleaning, the images are tagged using Stable Diffusion's Tag Reverse plug-in, followed by manual refinement, as shown in Figure 4.
|
| |
Figure 4: Images tagging process. | Figure 5: Processed training images and tags & Dataset. |

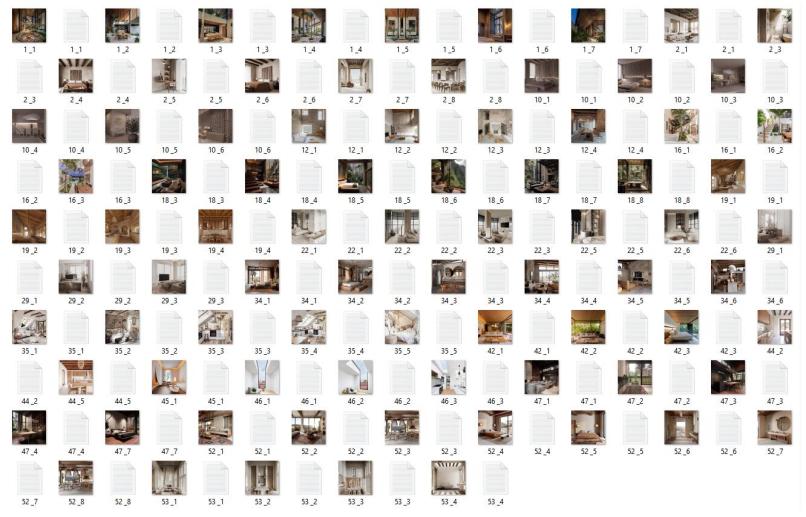


The last step is to create the dataset. As shown in Figure 5, the establishment of datasets generally consists of three levels: first, the general directory, which is the total folder of the training set, which contains each training set folder; second, the sub-directory which under the general directory is usually the training set, and its naming has a special format (<Number>_<Name>), <Number> represents the number of training times for each image. <Name> can be named freely, such as 7_trainingset01, where 7 represents the training time of each image in each round of Lora model is trained 7 times.
3.4. Low-Rank Adaptation Training
Training parameters and step count were set up in the beginning. During the training, parameters such as learning rate and epochs need to be dynamically adjusted to optimize model performance. Finally, the images generated by the trained LoRA model were compared to sort out the optimal model.
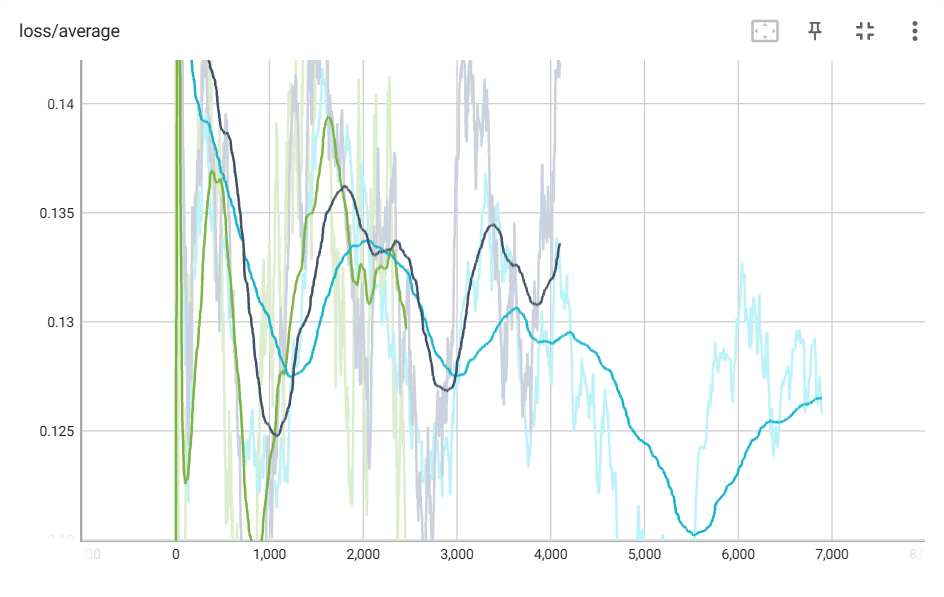
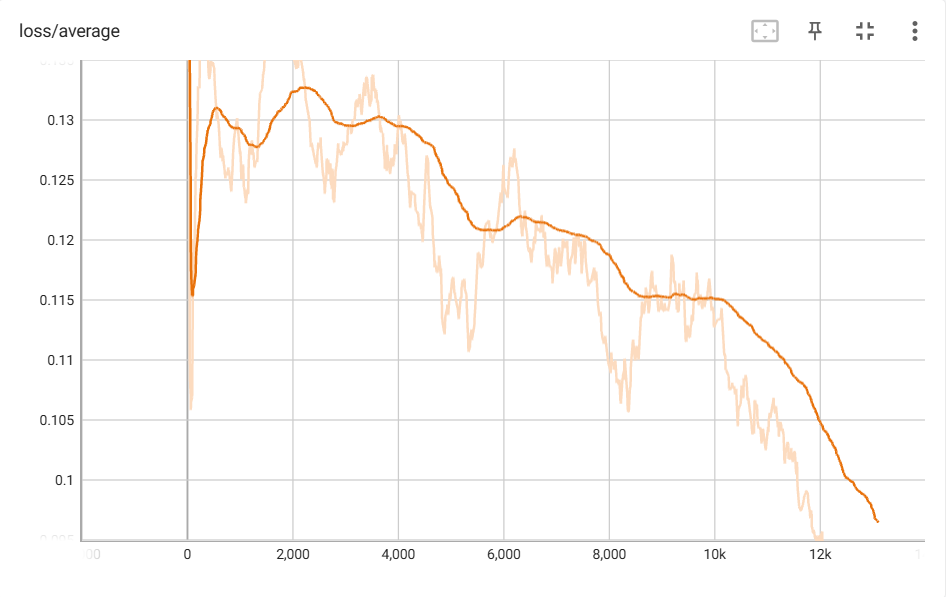
According to the test results of the 1st round training, the parameters were adjusted continuously and re-trained, and a total of four rounds of LoRA model training were carried out. The trained LoRA model in the 1st round was able to identify some spatial features that affect emotions, such as sunlight, warm colors, wood materials, etc. Therefore, in the 2nd round, only increased the number of repeat for each image, and the training steps increased accordingly. The overall tone of images generated from 2nd round LoRA was more harmonious.In the 3rd round of training, in order to make the LoRA model more accurate, the images in the dataset were reorganized, deleting images that were too bright or too dark. However, the results showed that this made the generated images too close to the architectural style in the dataset, and the images were too gray. Therefore, in the 4th round, the original dataset was re-trained, but with significant modifications to the parameters. The loss value showed a continuous downward trend as shown in Figure 6. Compared with the loss value changes in the first three rounds shown in Figure 6, this indicates that the results of this round are the most in line with the characteristics of the dataset. However, through image generation, it was found that overfitting occurred during this training, and the generated images were too dark and the content quality was poor.
|
| |
Figure 6: Dynamic changes in loss values. Table 2: Parameters used in each round of training. | ||
Parameter | 1st Round | 2nd Round | 3rd Round | 4th Round |
Training base model | v1-5-pruned.safetensors | v1-5-pruned.safetensors | v1-5-pruned.safetensors | v1-5-pruned.safetensors |
Training set | (82 images) | (82 images) | (69 images) | (82 images) |
Learning rate | 0.0001(1e-4) | 0.0001(1e-4) | 0.00015(1.5e-4) | 1(defaut) |
Optimizer type | AdamW8bit | AdamW8bit | AdamW8bit | Prodigy |
lr scheduler | Cosine_with_restarts | Cosine_with_restarts | Cosine_with_restarts | Cosine_with_restarts |
Network_dim | 32 | 32 | 32 | 64 |
Training steps | 10*3*82 | 10*5*82 | 10*10*69 | 16*10*82 |
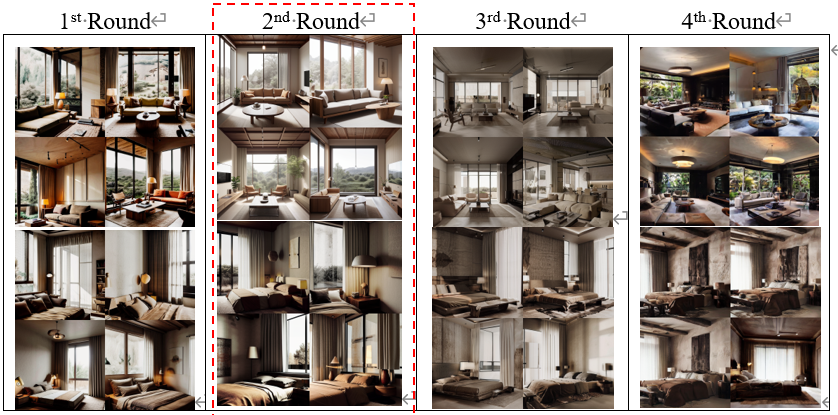
Figure 7: Testing of four rounds of LoRA.
Finally, all the LoRA models obtained in 4 rounds are tested, and several groups of prompt words containing only the basic components of space are selected, such as curtain, couch, lamp, table, bed, chair, etc. As shown in Figure 7, under the same prompt words, the image generated by LoRA in Round 2 is most likely to convey positive and inactive emotions.
4. Conclusions and future work
4.1. Issues analysis
Firstly, the limitations of sentiment classification labels. Although the GoEmotions model's database was built from extensive social media content, tags like "amusement," "love," and "admiration" were not suitable for capturing the emotional experience of spatial environments, leading to errors in sentiment analysis.
Secondly, the ambiguity of Instagram comments. User reviews are often influenced by context, personal preferences, and cultural context, rather than directly reflecting the emotions brought about by the space. In addition, different spaces may elicit similar superficial emotions, such as an intimate living room and an elegant café that may both getting "admiration".
Thirdly, there is a lack of a specific emotion analysis model designed for architectural space. Most current sentiment analysis models are based on linguistic data rather than environmental or spatial data. The emotional perception of space is usually related to factors such as color, light, and layout, which needs to be analyzed through a combination of visual models or multimodal models.
4.2. Conclusions and future work
This study found that current text-based emotion recognition technologies face significant limitations. The classification criteria of emotion models vary widely, resulting in a lack of universality, and the accuracy of detecting emotional expressions still needs improvement. For example, the GoEmotions database, which is currently the most accurate, achieves only 0.69 accuracy, leaving considerable room for enhancement. The current most advanced NLU model has not yet completely solved this task [9].
In addition, modern communication trends pose further challenges. People nowadays are more inclined to make short comments, which will also lead to insufficient effectiveness in obtaining information. At the same time, the use of rich emoji will also interfere with the credibility of emotion recognition. Therefore, it is difficult to accurately obtain people's emotions by relying solely on text. Multimodal emotion recognition (MER) systems are expected to use comprehensive information from facial expressions, voice patterns, and physiological signals to improve the accuracy and robustness of emotion recognition [22].
In the future, it can be considered that the creation of a target database in combination with offline questionnaires and other methods may improve the accuracy of sentiment analysis. The current LoRA model can only be trained for specific emotions, and recognizing multiple emotions requires training from the base model (checkpoint). Addressing this limitation will be a key focus of advancing emotion recognition in spatial design.
References
[1]. Rodríguez, A. O. R., Riaño, M. A., et al. (2020). Emotional characterization of children through a learning environment using learning analytics and AR-Sandbox. Journal of Ambient Intelligence and Humanized Computing, 11, 1–15. https://doi.org/10.1007/s12652-020-02612-x
[2]. Wang, W., Chen, L., Thirunarayan, K., & Sheth, A. P. (2012). Harnessing Twitter big data for automatic emotion identification. In 2012 International Conference on Social Computing (SocialCom) (pp. 587–592). IEEE.
[3]. Hasan, M., Rundensteiner, E., & Agu, E. (2019). Automatic emotion detection in text streams by analyzing Twitter data. International Journal of Data Science and Analytics, 7, 35–51. https://doi.org/10.1007/s41060-018-0096-z
[4]. Agrawal, Dr. (2024). Psychological impact of interior design on home residents. 7, 1-12.
[5]. Chatterjee, A., Gupta, U., Chinnakotla, M. K., et al. (2018). Understanding emotions in text using deep learning and big data. Computers in Human Behavior, 93, 309–317. https://doi.org/10.1016/j.chb.2018.12.029
[6]. Sailunaz, K., & Alhajj, R. (2019). Emotion and sentiment analysis from Twitter text. Journal of Computational Science, 36, 101003. https://doi.org/10.1016/j.jocs.2019.05.009.
[7]. Coviello, L., Sohn, Y., Kramer, A. D. I., Marlow, C., et al. (2014). Detecting emotional contagion in massive social networks. PLoS ONE, 9(3), e90315.
[8]. Rodriguez, A., Chen, Y. L., & Argueta, C. (2022). FADOHS: Framework for detection and integration of unstructured data of hate speech on Facebook using sentiment and emotion analysis. IEEE Access, 10, 22400–22419. https://doi.org/10.1109/access.2022.315.
[9]. Demszky, D., Movshovitz-Attias, D., et al. (2020). GoEmotions: A dataset of fine-grained emotions. Proceedings of the 58th Annual Meeting of the Association for Computational Linguistics, 4040–4054.
[10]. Cowen, A., Sauter, D., Tracy, J. L., & Keltner, D. (2019). Mapping the passions: Toward a high-dimensional taxonomy of emotional experience and expression. Psychological Science in the Public Interest, 20(1), 69–90. https://doi.org/10.1177/1529100619850176
[11]. Ekman, P. (1992). An argument for basic emotions. Cognition & Emotion, 6(3-4), 169-200.
[12]. Russell, J.A. (1980) 'A circumplex model of affect', Journal of Personality and Social Psychology, 39(6), pp. 1161–1178.
[13]. Vafaee, F., Rezaee, H., Asghari, E. A. M. J., et al. (2023). A review of the effects of the physical components of the interior space of architecture on emotions with an emphasis on neuroarchitecture.
[14]. Banaei, M., Hatami, J., Yazdanfar, A., & Gramann, K. (2017). Walking through architectural spaces: The impact of interior forms on human brain dynamics. Frontiers in Human Neuroscience, 11, Article 477. https://doi.org/10.3389/fnhum.2017.00477
[15]. Zhang, X., Lian, Z., & Wu, Y. (2017). Human physiological responses to wooden indoor environment. Physiology & Behavior, 174, 27–34. https://doi.org/10.1016/j.physbeh.2017.02.043
[16]. Vartanian, O., Navarrete, G., Chatterjee, A., et al. (2015). Architectural design and the brain: Effects of ceiling height and perceived enclosure on beauty judgments and approach-avoidance decisions. Journal of Environmental Psychology, 41, 10–18. https://doi.org/10.1016/j.jenvp.2014.11.006
[17]. Yin, J., Yuan, J., Arfaei, N., et al. (2020). Effects of biophilic indoor environment on stress and anxiety recovery: A between-subjects experiment in virtual reality. Environmental International, 136, Article 105427. https://doi.org/10.1016/j.envint.2019.105427
[18]. Lee, S., Alzoubi, H. H., & Kim, S. (2017). The effect of interior design elements and lighting layouts on prospective occupants’ perceptions of amenity and efficiency in living rooms. Sustainability, 9(7), 1119. https://doi.org/10.3390/su9071119.
[19]. Küller, R., Mikellides, B., & Janssens, J. (2009). Color, arousal, and performance—A comparison of three experiments. Color Research and Application, 34(1), 15-28. https://doi.org/10.1002/col.20476.
[20]. Knez, I. (1995). Effects of indoor lighting on mood and cognition. Journal of Environmental Psychology, 15(1), 39-51. https://doi.org/10.1016/0272-4944(95)90013-6.
[21]. Princeton University. (2010). WordNet. http://wordnet.princeton.edu.
[22]. Geetha, A.V., Mala, T., Priyanka, D. & Uma, E.,(2024). Multimodal emotion recognition with deep learning: Advancements, challenges, and future directions. Information Fusion, 105, p.102218. https://doi.org/10.1016/j.inffus.2023.102218.
Cite this article
Chu,L.;Zhou,K. (2025). Emotion-Driven Interior Design Using Sentiment Analysis from Social Media. Applied and Computational Engineering,108,188-196.
Data availability
The datasets used and/or analyzed during the current study will be available from the authors upon reasonable request.
Disclaimer/Publisher's Note
The statements, opinions and data contained in all publications are solely those of the individual author(s) and contributor(s) and not of EWA Publishing and/or the editor(s). EWA Publishing and/or the editor(s) disclaim responsibility for any injury to people or property resulting from any ideas, methods, instructions or products referred to in the content.
About volume
Volume title: Proceedings of the 5th International Conference on Signal Processing and Machine Learning
© 2024 by the author(s). Licensee EWA Publishing, Oxford, UK. This article is an open access article distributed under the terms and
conditions of the Creative Commons Attribution (CC BY) license. Authors who
publish this series agree to the following terms:
1. Authors retain copyright and grant the series right of first publication with the work simultaneously licensed under a Creative Commons
Attribution License that allows others to share the work with an acknowledgment of the work's authorship and initial publication in this
series.
2. Authors are able to enter into separate, additional contractual arrangements for the non-exclusive distribution of the series's published
version of the work (e.g., post it to an institutional repository or publish it in a book), with an acknowledgment of its initial
publication in this series.
3. Authors are permitted and encouraged to post their work online (e.g., in institutional repositories or on their website) prior to and
during the submission process, as it can lead to productive exchanges, as well as earlier and greater citation of published work (See
Open access policy for details).
References
[1]. Rodríguez, A. O. R., Riaño, M. A., et al. (2020). Emotional characterization of children through a learning environment using learning analytics and AR-Sandbox. Journal of Ambient Intelligence and Humanized Computing, 11, 1–15. https://doi.org/10.1007/s12652-020-02612-x
[2]. Wang, W., Chen, L., Thirunarayan, K., & Sheth, A. P. (2012). Harnessing Twitter big data for automatic emotion identification. In 2012 International Conference on Social Computing (SocialCom) (pp. 587–592). IEEE.
[3]. Hasan, M., Rundensteiner, E., & Agu, E. (2019). Automatic emotion detection in text streams by analyzing Twitter data. International Journal of Data Science and Analytics, 7, 35–51. https://doi.org/10.1007/s41060-018-0096-z
[4]. Agrawal, Dr. (2024). Psychological impact of interior design on home residents. 7, 1-12.
[5]. Chatterjee, A., Gupta, U., Chinnakotla, M. K., et al. (2018). Understanding emotions in text using deep learning and big data. Computers in Human Behavior, 93, 309–317. https://doi.org/10.1016/j.chb.2018.12.029
[6]. Sailunaz, K., & Alhajj, R. (2019). Emotion and sentiment analysis from Twitter text. Journal of Computational Science, 36, 101003. https://doi.org/10.1016/j.jocs.2019.05.009.
[7]. Coviello, L., Sohn, Y., Kramer, A. D. I., Marlow, C., et al. (2014). Detecting emotional contagion in massive social networks. PLoS ONE, 9(3), e90315.
[8]. Rodriguez, A., Chen, Y. L., & Argueta, C. (2022). FADOHS: Framework for detection and integration of unstructured data of hate speech on Facebook using sentiment and emotion analysis. IEEE Access, 10, 22400–22419. https://doi.org/10.1109/access.2022.315.
[9]. Demszky, D., Movshovitz-Attias, D., et al. (2020). GoEmotions: A dataset of fine-grained emotions. Proceedings of the 58th Annual Meeting of the Association for Computational Linguistics, 4040–4054.
[10]. Cowen, A., Sauter, D., Tracy, J. L., & Keltner, D. (2019). Mapping the passions: Toward a high-dimensional taxonomy of emotional experience and expression. Psychological Science in the Public Interest, 20(1), 69–90. https://doi.org/10.1177/1529100619850176
[11]. Ekman, P. (1992). An argument for basic emotions. Cognition & Emotion, 6(3-4), 169-200.
[12]. Russell, J.A. (1980) 'A circumplex model of affect', Journal of Personality and Social Psychology, 39(6), pp. 1161–1178.
[13]. Vafaee, F., Rezaee, H., Asghari, E. A. M. J., et al. (2023). A review of the effects of the physical components of the interior space of architecture on emotions with an emphasis on neuroarchitecture.
[14]. Banaei, M., Hatami, J., Yazdanfar, A., & Gramann, K. (2017). Walking through architectural spaces: The impact of interior forms on human brain dynamics. Frontiers in Human Neuroscience, 11, Article 477. https://doi.org/10.3389/fnhum.2017.00477
[15]. Zhang, X., Lian, Z., & Wu, Y. (2017). Human physiological responses to wooden indoor environment. Physiology & Behavior, 174, 27–34. https://doi.org/10.1016/j.physbeh.2017.02.043
[16]. Vartanian, O., Navarrete, G., Chatterjee, A., et al. (2015). Architectural design and the brain: Effects of ceiling height and perceived enclosure on beauty judgments and approach-avoidance decisions. Journal of Environmental Psychology, 41, 10–18. https://doi.org/10.1016/j.jenvp.2014.11.006
[17]. Yin, J., Yuan, J., Arfaei, N., et al. (2020). Effects of biophilic indoor environment on stress and anxiety recovery: A between-subjects experiment in virtual reality. Environmental International, 136, Article 105427. https://doi.org/10.1016/j.envint.2019.105427
[18]. Lee, S., Alzoubi, H. H., & Kim, S. (2017). The effect of interior design elements and lighting layouts on prospective occupants’ perceptions of amenity and efficiency in living rooms. Sustainability, 9(7), 1119. https://doi.org/10.3390/su9071119.
[19]. Küller, R., Mikellides, B., & Janssens, J. (2009). Color, arousal, and performance—A comparison of three experiments. Color Research and Application, 34(1), 15-28. https://doi.org/10.1002/col.20476.
[20]. Knez, I. (1995). Effects of indoor lighting on mood and cognition. Journal of Environmental Psychology, 15(1), 39-51. https://doi.org/10.1016/0272-4944(95)90013-6.
[21]. Princeton University. (2010). WordNet. http://wordnet.princeton.edu.
[22]. Geetha, A.V., Mala, T., Priyanka, D. & Uma, E.,(2024). Multimodal emotion recognition with deep learning: Advancements, challenges, and future directions. Information Fusion, 105, p.102218. https://doi.org/10.1016/j.inffus.2023.102218.