


1. Introduction
Climate change impacts every aspect of nature and human development (EPA 2016). It poses a severe threat to the Earth’s environment and ecosystems as rising temperatures, changes in precipitation, and rising chances of extreme weather. The greenhouse gasses (GHG) are trapped in the Earth’s atmosphere, increasing climate change. These effects of climate change have consequences such as habitat destruction, extinction of species, and disruption of the balance of ecosystems. Humans have caused recent climate change, and the repercussions, directly and indirectly, affect them. These repercussions include health, economic, and resource problems. If climate change cannot be dealt with in the future, humans might face an inevitable and irreversible downfall. Plastic production releases enormous amounts of CO2 into the environment, significantly contributing to climate change. The plastic production life cycle annually produced 232 million metric tons in 2021 (Earth.org 2021). The incineration of plastic waste also leads to CO2 emissions. Around 4 - 8% of annual oil consumption is associated with plastics (Momani 2009).
According to the Organization for Economic Co-operation and Development (OECD), plastic consumption has quadrupled in the past 30 years. Plastic consumption has increased fourfold in the last 30 years. Between 2000 and 2019, global plastics production doubled, reaching 460 million tonnes. Byproducts of plastic production contribute to 3.4% of global GHG emissions. (OECD 2022 Catherine Bremer). Driven by the demand, global plastics production doubled from 2000 to 2019 to reach 460 million tons. As plastic production rises, waste follows. At the same time, the percentage of recycled plastic increases, and incinerated and disposed of plastic is still 80% of all plastic waste. The incineration of plastic waste produces CO2 that fuels GHG. According to Statista, 12% of US municipal solid waste generation is from plastic (Statista 2024 Bruna Alves). When buried, plastic goes through anaerobic decomposition, which produces a significant amount of methane, another potent GHG 28 times CO2 in terms of climate change impact. Another connection between plastic and climate change is energy consumption; manufacturing items requires energy, and the primary forms of energy come from burning fossil fuels, which can also emit GHG. GHG, principally water vapor (H2O), Carbon Dioxide (CO2), and Ozone (O3), are naturally found in Earth’s Troposphere. They absorb thermal infrared (IR) radiation from the Earth’s surface and atmosphere. (Ledely 2011). With this mechanism and the relentless increase in carbon emissions, the thermal energy of Earth’s atmosphere and surface rises; with no possible way for the heat to escape without damaging the ecosystem, humanity is on the path of irreversible climate change that could negatively alter social structures forever. Changes in the climate that directly respond to the increasing levels of GHG include creases in mean surface air temperature, increases in global mean rates of precipitation and evaporation, rising sea levels, and changes in the biosphere.
Plastics, directly and indirectly, affect many parts of the world, such as land and water, wildlife, global warming, and human evolution and health. Humans created plastic for its ease of use and cheap production. However, plastics can pollute oceans and require landfills at the end of life. Marine animals often mistake plastic debris for food or become entangled in it. Sea turtles, whales, seabirds, and other marine species may ingest plastic, leading to internal injuries, blockages, or starvation. Ingesting plastics diminishes appetite, leading animals to lose the energy needed for survival, ultimately resulting in death. (Plastic Soup Foundation 2011). Additionally, animals like seals and dolphins can get entangled in plastic waste, causing physical harm or drowning. There are also microplastics in the ocean that marine life consumes. Humans then catch these marine life, allowing the microplastics to enter the human body. The production of plastics involves extracting and refining fossil fuels. Factories then use these fossil fuels to produce GHG. Yale Climate Connections states that the extraction and refinement of plastics in the United States emit between 12.5 and 13.5 million metric tons of carbon dioxide each year. (2019).
The rapid increase in plastic production corresponds to the rise of CO2 emissions. This study aims to evaluate various plastic types' climate change impacts and compare them based on annual production volume. First, we collected data on the production volume, waste, recycling rate, market volume, and CO2 emissions. We also calculated the total CO2 emissions of plastic production and total CO2 emissions of plastic waste of the plastic types, including polyethylene terephthalate (PET), High-density polyethylene (HDPE), Low-density polyethylene (LDPE), Polyvinyl Chloride (PVC), Polypropylene (PP), Polystyrene (PS), and other plastics. We then analyzed which plastic type contributes the highest CO2 emissions and discussed the future implication of carbon saving in plastics.
2. Methodology
We researched six plastic types from various websites and articles to evaluate the carbon footprint. The six plastic types we collected information on were PET, HDPE, LDPE, PVC, PP, and PS. We collected the following data: production volume, waste, recycling rate, market volume, and CO2 emissions. To calculate the total carbon footprint, we multiplied the CO2 emissions of plastic production with the production volume. We ranked the total carbon footprint for each plastic type and went deep into the top carbon emissions contributors. We then analyzed the other data for the plastic type with top carbon emissions and compared the data to other plastics. This way, we can discover why that plastic type is the top carbon emission contributor.
The production volume used in the study is the total mass amount of plastic produced, in this case, in a year (Di et al., 2021). The production volume compares the total waste and recycled percentage of the plastic. Waste is the total amount of each plastic type wasted in a year (OECD, 2022). The recycling rate is the total percentage of each plastic type recycled compared to what is produced in a year (Institute for Global Environmental Strategies, 2013). Market volume is the total amount of plastic buyers and sellers interact, calculated by millions of dollars (Wikipedia, 2022). Market volume monitors which plastic has the highest sales and compares it to the other aspects of different plastics. CO2 emissions are the amount of each plastic type’s CO2 emissions during production, considering cradle-to-gate emissions (World Data Bank, 2023). Gathering the CO2 data allows us to find the most significant CO2 emissions contributor and to compare if the other values are linear to the emission percentage. The production volume was based on the paper examining plastic flows’ production, use, and waste (Di et al., 2021). Table 1 presents the collected data for various plastic types.
Table 1: Plastic production, waste, recycling rate, and CO2 emissions data.
Plastic Type | Production volume | Waste | Recycling rate | CO2 emissions |
Unit | (million metric tons) | (thousand ton) | (% of generation) | (kgCO2e/kg) |
PET | 4.4 | 5290 | 18.5 | 5.3 |
HDPE | 8.6 | 6300 | 8.9 | 4.5 |
PVC | 6.7 | 840 | NA | 4.4 |
LDPE | 9.8 | 8590 | 4.3 | 4.5 |
PP | 7.8 | 8150 | 0.6 | 4.3 |
PS | 2.0 | 2260 | 0.9 | 5.6 |
Others | 3.6 | 1110 | 26.7 | 4.8 |
Year | 2015 | 2018 | 2018 | 2022 |
The LCA method for carbon emissions analyzes a product's life. It examines raw material extraction, production, transportation, use, disposal, and recycling. Our research uses the LCA method to analyze plastic production and disposal of carbon emissions. After gathering the raw materials, such as crude oil and natural gases. Resources that are required to produce plastic, the materials are then refined into monomers such as ethylene (for polyethylene (PE)) and propylene (for polypropylene (PP). Then comes the polymerization process, which chemically combines the monomers to create polymers, hence the name polymerization. The raw polymer is then blended with additives that give different characteristics to the plastics made by melting and mixing (compounding). Lastly, the compounded polymers are molded into the desired shapes in multiple ways, which include injection molding, blow molding, and extrusion. After gathering the necessary data for the LCA of plastics, we comprehensively understood the environmental impacts of these different plastic types. PS, emitting 5.6 kgCO2e/kg stands at the highest CO2 emitted per kilogram made. Following PS, there are PET (5.3), LDPE (4.5), and HDPE (4.5) that also hold a high percentage in CO2 emitted.
3. Results
This work examined the production volume of different plastic types in the US. Figure 1 shows that the plastic production volume ranged from 2.0 to 9.8 million metric tons in 2015. The lowest production volume is from PS, contributing to the total plastics production volume by 5.1%. The highest production volume is LDPE, taking 25% of all production volume. LDPE has a production cost of ten times less than other plastic types like PET. It has a high raw feedstock availability (Grand et al., 2023). LDPE is a commonly used plastic that makes up plastic bags and other everyday household items.
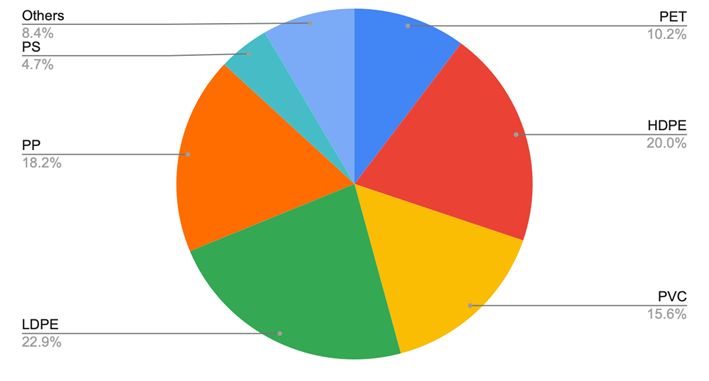
Figure 1: The percentage of PET, HDPE, LDPE, PVC, PP, and PS plastic production volume in 2015. LDPE and HDPE held 42.9% of the total production volume of all plastics in the US.
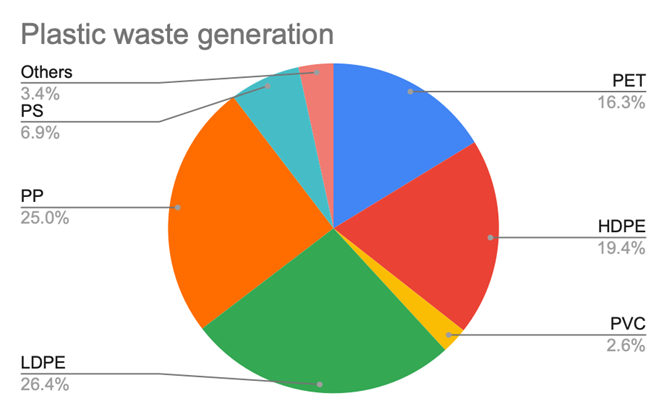
Figure 2: The percentage of waste generation of each plastic type in 2018. LDPE, as shown in Fig 1, had the highest percentage, leading to the highest waste generation as; the contrary, PP, the third highest-produced plastic (behind HDPE), is ranked second on plastic waste generation (25% compared to the production volume percent of 18.2%).
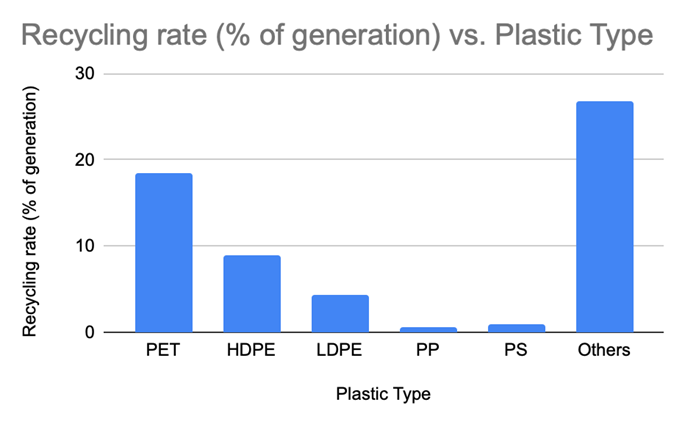
Figure 3: Bar graph for the recycling rate by type in 2018. The y-axis provides the percentage of each plastic type’s recycling rate. The overall negative trend from PET plastic’s recycling rate relates to the difficulty of recycling each plastic; PET plastics are 100% recyclable compared to a complex, expensive recycling process of PS plastics, standing at only a 46% recycling rate.
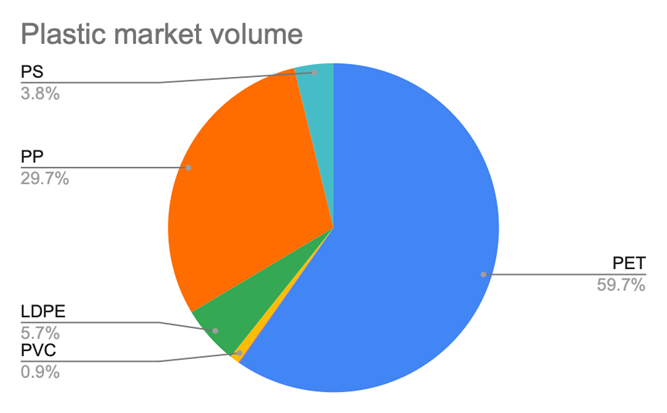
Figure 4: Pie chart for market volume of each plastic type in 2021. PET, the easiest to be produced and recycled, holds a significant percentage of the total plastic production volume.
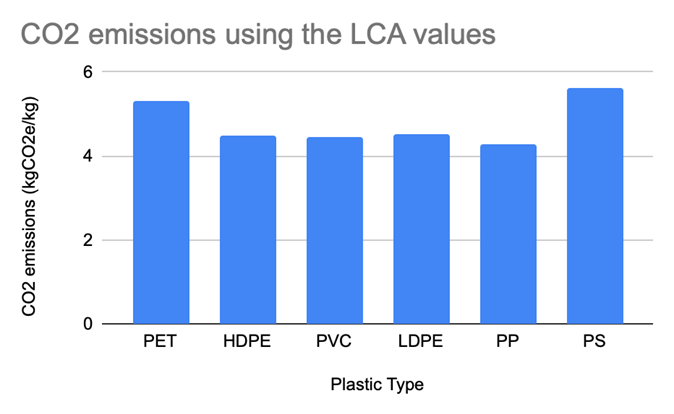
Figure 5: The total CO2 emissions using the LCA values in 2022. PS plastics having the highest emissions during the production and waste process (LC) is because of its structural complexity during its production and recycling.
4. Case Study
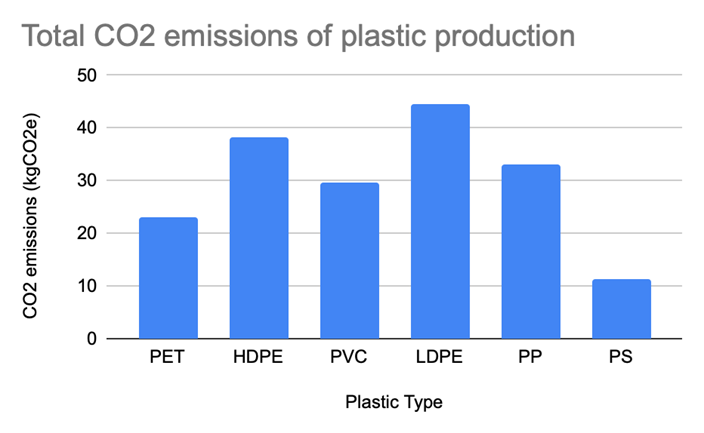
Figure 6: Total CO2 emissions of plastic production of each plastic type.
According to our analysis on the plastic carbon emissions in Fig 6, low-density polyethylene (LDPE) is the top CO2 contributor in the U.S, having more than a million metric tons of production volume compared to the second highest production volume of plastic, high-density polyethylene (HDPE). LDPE is a very commonly used product in various containers, dispensing and squeeze bottles, tubing, plastic parts of computer components, molded laboratory equipment, and many caps and closures. The production volume of LDPE is 9.8 million metric tons, while LDPE has 8.6 million metric tons. Incineration and landfilling play significant roles in CO2 emissions relating to plastic end-of-life. In the case of LDPE, with a significantly lower recycling rate, its incineration rate is much higher than other plastics, producing more CO2 emissions into the atmosphere. The recycling rate of LDPE is 4.3% of waste generation per year, which is much lower than the recycling rate of PET, 18.5%, and also lower than HDPE, 8.9%.
To reduce the CO2 emissions for LDPE, we can promote the reuse and recycling of LDPE products, switch to bio-based plastic to replace fossil-based LDPE, and encourage efficient packaging. Reusing LDPE products reduces the average LDPE waste annually, reducing the incineration of LDPE annually. Switching to bio-based plastics would also decrease CO2 emissions as the plastic would be biodegradable and would not require incineration to decompose. Bio-based plastics would also be less impactful to the environment when manufactured (Choo, 2017). Nowadays, packaging for take-out, mail, and deliveries is necessary for people, so efficient packaging is crucial for using fewer materials each year; the packages could be much smaller or tighter around the product.
Even with all the alternatives mentioned previously, we still cannot wholly cease the production of LDPE. There are, however, ways to reduce CO2 emissions during the production phase. We can use recycled LDPE instead of virgin LDPE since recycled LDPE will require fewer production stages than virgin LDPE. This reduces the energy consumption of the machines used to create the plastic. Creating LDPE is very energy intensive, so using renewable energy such as wind, solar, or hydroelectric power for production plants would reduce CO2 emissions from gathering fossil fuels. While recycled LDPE requires less effort to turn into new and reusable ones, the contamination and the quality consistency of the plastics may vary, which may cause plastic waste from these plastics that do not fit product requirements. Different types of LDPE plastics have varying chemical compositions based on their intended uses. For instance, LDPE plastics for food storage must have high purity to ensure safety. In contrast, recycled LDPE products typically have lower purity. Despite these challenges, pursuing sustainability and environmental benefits in LDPE production remains an attractive and necessary option.
5. Conclusion and discussion
We first hypothesized that PET plastic LCA, including raw material extraction, production, transportation, use, disposal, and recycling, has the largest environmental impact as PET plastics could be seen constantly being used in everyday life. Through a series of data collection and analysis as shown in the charts above. We analyzed the production volume in million metric ton, waste in thousands ton, recycling rate of generation, and market volume in billion dollars of PET, HDPE, PVC, LDPE, PP, and PS plastic types. We found that LDPE had the highest production, taking 25% of all production volume of plastics produced annually. LDPE also has a production cost of ten times less than other plastic types like PET creating a high availability of raw feedstock.
It was difficult to cross reference many datasets as various websites and articles frequently present disparate figures for the same type of data. This proved a problem as the data needed to be the most accurate for analysis, making data collecting even more arduous. Finding the data sources for market volume was especially troublesome as a lot of websites provided limited data and the data across the sites varied widely. Researching the data points could be sped up by having more knowledge about trustworthy and efficient websites. It was challenging to find the data points for all the plastics’ market volume as there are countless articles displaying vastly different values. Our work could be improved by cross referencing more articles to create more accurate results and to pay more attention to details such as creating more graphs and figures, such as providing descriptions for the “other” plastic types that in some figures, have a significant percentage.
Based on our study, we suggest policy and decision-makers implementing regulations that require a minimum percentage of recycled content in packaging materials. This can drive demand for recycled paper and ensure its quality improves over time. Additionally, setting standards for the durability and recyclability of paper packaging can further promote its use. They could also implement mandates requiring factories to utilize a significant portion of their energy from renewable sources such as solar, wind, or hydroelectric power. We could also raise plastic waste awareness in the mainstream through social media platforms to enable civilians into the solution towards reducing climate change.
References
[1]. U.S. Environmental Protection Agency. (2020). Inventory of U.S. greenhouse gas emissions and sinks: 1990-2018 (EPA 430-R-20-002). https://www.epa.gov/sites/default/files/2021-01/documents/2018_tables_and_figures_dec_2020_fnl_508.pdf
[2]. Recycling Today. (2023, June 2). Study: Recycled PP, HDPE have lower carbon footprints than virgin resins. Recycling Today. https://www.recyclingtoday.com/news/recycled-pp-hdpe-lower-carbon-footprint-pet/
[3]. Di, J., Reck, B. K., Miatto, A., & Graedel, T. E. (2021). United States plastics: Large flows, short lifetimes, and negligible recycling. Resources, Conservation and Recycling, 167, 105440. https://doi.org/10.1016/j.resconrec.2020.105440
[4]. Environmental Protection Agency. (2021, January). 2018 tables and figures. EPA Website. https://www.epa.gov/sites/default/files/2021-01/documents/2018_tables_and_figures_dec_2020_fnl_508.pdf
[5]. Grand View Research. (2023). Low-density polyethylene market size, share & trends analysis report by application, regional outlook, competitive strategies, and segment forecasts, 2019 to 2025. Grand View Research. https://www.grandviewresearch.com/industry-analysis/low-density-polyethylene-ldpe-market
[6]. Greenpeace. (2022). Circular claims fall flat again: Comprehensive U.S. survey of plastics recyclability. Greenpeace USA. https://www.greenpeace.org/usa/wp-content/uploads/2022/10/GPUS_FinalReport_2022.pdf
[7]. Ledley, T. S., Sundquist, E. T., Schwartz, S. E., Hall, D. K., Fellows, J. D., & Killeen, T. L.(1999). Climate change and greenhouse gases. Eos, Transactions American Geophysical Union, 80(39), 453–458. https://doi.org/10.1029/99EO00328
[8]. Low-Density Polyethylene Market Size, Share & Trends Analysis Report By Application, Regional Outlook, Competitive Strategies, And Segment Forecasts, 2019 To 2025. Grand View Research, www.grandviewresearch.com/industry-analysis/low-density-polyethylene-ldpe-market.
[9]. Grand View Research. (n.d.). Plastic market size, share & trends analysis report by product (PE, PP, PU, PVC, PET, PS), by application (injection molding, blow molding, roto molding, compression molding), by end-use, by region, and segment forecasts, 2024 - 2030. Grand View Research. https://www.grandviewresearch.com/industry-analysis/global-plastics-market
Cite this article
Li,Z. (2025). A Comparative Analysis of the Environmental Impacts of LDPE Plastics and Various Widely Used Plastics in the United States. Applied and Computational Engineering,129,131-138.
Data availability
The datasets used and/or analyzed during the current study will be available from the authors upon reasonable request.
Disclaimer/Publisher's Note
The statements, opinions and data contained in all publications are solely those of the individual author(s) and contributor(s) and not of EWA Publishing and/or the editor(s). EWA Publishing and/or the editor(s) disclaim responsibility for any injury to people or property resulting from any ideas, methods, instructions or products referred to in the content.
About volume
Volume title: Proceedings of the 5th International Conference on Materials Chemistry and Environmental Engineering
© 2024 by the author(s). Licensee EWA Publishing, Oxford, UK. This article is an open access article distributed under the terms and
conditions of the Creative Commons Attribution (CC BY) license. Authors who
publish this series agree to the following terms:
1. Authors retain copyright and grant the series right of first publication with the work simultaneously licensed under a Creative Commons
Attribution License that allows others to share the work with an acknowledgment of the work's authorship and initial publication in this
series.
2. Authors are able to enter into separate, additional contractual arrangements for the non-exclusive distribution of the series's published
version of the work (e.g., post it to an institutional repository or publish it in a book), with an acknowledgment of its initial
publication in this series.
3. Authors are permitted and encouraged to post their work online (e.g., in institutional repositories or on their website) prior to and
during the submission process, as it can lead to productive exchanges, as well as earlier and greater citation of published work (See
Open access policy for details).
References
[1]. U.S. Environmental Protection Agency. (2020). Inventory of U.S. greenhouse gas emissions and sinks: 1990-2018 (EPA 430-R-20-002). https://www.epa.gov/sites/default/files/2021-01/documents/2018_tables_and_figures_dec_2020_fnl_508.pdf
[2]. Recycling Today. (2023, June 2). Study: Recycled PP, HDPE have lower carbon footprints than virgin resins. Recycling Today. https://www.recyclingtoday.com/news/recycled-pp-hdpe-lower-carbon-footprint-pet/
[3]. Di, J., Reck, B. K., Miatto, A., & Graedel, T. E. (2021). United States plastics: Large flows, short lifetimes, and negligible recycling. Resources, Conservation and Recycling, 167, 105440. https://doi.org/10.1016/j.resconrec.2020.105440
[4]. Environmental Protection Agency. (2021, January). 2018 tables and figures. EPA Website. https://www.epa.gov/sites/default/files/2021-01/documents/2018_tables_and_figures_dec_2020_fnl_508.pdf
[5]. Grand View Research. (2023). Low-density polyethylene market size, share & trends analysis report by application, regional outlook, competitive strategies, and segment forecasts, 2019 to 2025. Grand View Research. https://www.grandviewresearch.com/industry-analysis/low-density-polyethylene-ldpe-market
[6]. Greenpeace. (2022). Circular claims fall flat again: Comprehensive U.S. survey of plastics recyclability. Greenpeace USA. https://www.greenpeace.org/usa/wp-content/uploads/2022/10/GPUS_FinalReport_2022.pdf
[7]. Ledley, T. S., Sundquist, E. T., Schwartz, S. E., Hall, D. K., Fellows, J. D., & Killeen, T. L.(1999). Climate change and greenhouse gases. Eos, Transactions American Geophysical Union, 80(39), 453–458. https://doi.org/10.1029/99EO00328
[8]. Low-Density Polyethylene Market Size, Share & Trends Analysis Report By Application, Regional Outlook, Competitive Strategies, And Segment Forecasts, 2019 To 2025. Grand View Research, www.grandviewresearch.com/industry-analysis/low-density-polyethylene-ldpe-market.
[9]. Grand View Research. (n.d.). Plastic market size, share & trends analysis report by product (PE, PP, PU, PVC, PET, PS), by application (injection molding, blow molding, roto molding, compression molding), by end-use, by region, and segment forecasts, 2024 - 2030. Grand View Research. https://www.grandviewresearch.com/industry-analysis/global-plastics-market