1. Introduction
The term "life expectancy" refers to the life expectancy a person can expect. By definition, life expectancy is based on an estimate of the average age at death for a given population, indicating both the quantity and quality of life [1]. WHO's World health statistics report finds an overall increase in the global average Life expectancy as a result of overcoming several of the leading causes of illness and death [2]. It's now above 70 years and is doubled the one in the 19th century. However, this progress has been uneven, particularly between countries. Since 1900 there is a high inequality between the early industrialized countries and the rest of the world [3]. In 2019, life expectancy at birth in the least developed countries was 7.4 years lower than the global average, due in large part to persistently high child and maternal mortality, as well as the continuing effects of violence, conflict, and HIV epidemic [4].
As various responses to the spread of the COVID-19 pandemic in different countries, critical inequalities have significantly surfaced. Moreover, with the increase in the scale of transmission reinforcing the risk of variants, the pandemic shows an intense shift of its epicenter to the developing countries, acting as a serious impediment to the world's collective goal of reducing health inequalities [2]. The United Nation's Transforming our world: the 2030 agenda for sustainable development supports a call to "leave no one behind" for concerning the countries at the risk of missing out on the health services that they need and deserve. These agenda provide an ambitious vision of a healthier and more inclusive world in the future [5].
This paper is concerned with identifying variables that can help to explain the different distribution of life expectancy. From this, it would be possible to reduce disparities in health outcomes and promote the entire sustainable development agenda based on these findings within policies. The GHO dataset of the World Health Organization provides the data from 2000 to 2015 on the relationship between life expectancy and some variables crossing 133 countries. This research begins with an examination of the definition and measurement of several domains for the independent variables in this dataset: mortality (Adult Mortality, infant deaths, under-five deaths), health(Hepatitis B, Measles, BMI: Average Body Mass Index of the entire population, Polio, Diphtheria, HIV/AIDS, thinness 1-19 years, thinness 5-9 years), living habit (Alcohol), national conditions (percentage expenditure, Total expenditure, GDP, Population, Income composition of resources), and relate socioeconomic status (SES)(Schooling). Then those factors will be addressed to explore the underlying drivers of the existing situation and current trends in life expectancy.
2. Literature review
The following literature review aims to outline existing research on factors influencing life expectancy. By exploring this research, the significant findings, which emphasize the factors that will be important to focus on in this project, will be highlighted.
The Infant mortality rate is one of the most general indicators of health status. It was accepted as an accurate and sensitive measure of health conditions. Firstly, it could serve as a dependable measure of life expectancy. Secondly, this factor could sensitively reflect the changes in the socio-economic environment and health interventions. However, according to the UN empirical life table data for 78 developing countries from 1947 to 1981, the relationship between life expectancy and linear index of mortality (LIM) is non-linear. Also, it showed that 37% of the difference in LIM between high and low life expectancy countries is due to infant mortality. Likewise, 40% is due to adult mortality and 23% to child mortality [6]. But in fact, it is not always appropriate to undertake a thorough investigation to establish an exact cause of death. It is because the causes of death recorded could be of mixed quality, and the registration of ill-defined death causes remains widespread even within developed countries, which have robust death registration systems ensuring deaths are routinely registered [7].
Income and education are both important SES indicators, but income is difficult to estimate as to the reluctance of people to provide accurate information, while education could be measured by the certificates and the number of years of schooling [8]. Some researchers point to a widening of educational disparities in mortality because of the increase in average educational level in developed countries [9] According to two data sets, the Authors' calculations using data on non-Hispanic blacks and whites in the National Longitudinal Mortality Study (NLMS) and death certificate data from the Multiple Cause of Death (MCD), between 1990 and 2000, education-related gaps in life expectancy increased by about 30 percent [10]. Many findings across numerous studies consistently showed the association between education and the risk of a series of chronic diseases, the main source of mortality and functional limitations in advanced ages in developed countries [11]. There is also evidence of an association between education and functional limitations in a developing country where the average education level of the elderly population is low [12].
Multiple studies have indicated that increased social spending such as a share of total gross domestic product, a proportion of health spending, and welfare generosity, is positively associated with life expectancy [13,14]. OWUMI and EBOH (2021) found out that the healthcare system funding sources had significant positive effects on life expectancy in Nigeria for the past 18 years (2000-2017). Specifically, holding other variables constant, a $1% increase in the domestic general government health expenditure was associated with a 6% increase in life expectancy at birth in Nigeria. Comparatively, a 1-cent increase in social spending per dollar spent on health would lead to a 0.01% increase in life expectancy from 1981 to 2011 in Canada [15].
3. Method
Once a data set was found that matched the questions in this project, the analysis process began using Logistic Regression (LR). One of the first steps in the feature selection analysis was to determine what the independent variable would be. The objective of this article was to explore the relationship between life expectancy and variables in different countries, therefore, the t-test was chosen as the method to obtain the significant factors related to life expectancy. In addition, the status of the countries was highlighted within this project by grouping the countries into developed and developing. Therefore, after training LR to investigate the coefficient for all countries in the dataset, this exercise was performed on developed and developing countries respectively. And then further data extraction and data analysis would be exercised based on the existing data.
4. Result
To identify the association between the variables (GDP, Adult Mortality, infant deaths, Alcohol, Population, Income composition of resources, Schooling) and the independent variable(life expectancy), a series of preliminary tests were computed. It shows that life expectancy was related to Adult Mortality, infant deaths, Alcohol, Income composition of resources, Schooling.
Table 1. Relation between life expectancy and .the variables (GDP, Adult Mortality, infant deaths, Alcohol, Population, Income composition of resources, Schooling), according to Logistic Regression.
coef | std err | t | P>|t| | [0.025 | 0.975] | |
Intercept | 54.2999 | 0.74 | 73.399 | 0 | 52.849 | 55.751 |
percentageexpenditure | 0.0003 | 0 | 1.354 | 0.176 | 0 | 0.001 |
Totalexpenditure | 0.0034 | 0.049 | 0.07 | 0.944 | -0.093 | 0.099 |
GDP | 1.95E-05 | 3.45E-05 | 0.565 | 0.572 | -4.81E-05 | 8.70E-05 |
AdultMortality | -0.0305 | 0.001 | -31.059 | 0 | -0.032 | -0.029 |
infantdeaths | -0.0046 | 0.001 | -3.644 | 0 | -0.007 | -0.002 |
Alcohol | -0.1461 | 0.036 | -4.08 | 0 | -0.216 | -0.076 |
Population | 3.53E-09 | 2.09E-09 | 1.69 | 0.091 | -5.66E-10 | 7.62E-09 |
Incomecompositionofresources | 12.7368 | 0.992 | 12.835 | 0 | 10.79 | 14.683 |
Schooling | 1.0329 | 0.07 | 14.828 | 0 | 0.896 | 1.17 |
After dividing the status of country into two group (developing country and developed country) to investigate, the variables' significant correlation with life expectancy turns out in a different way. In the developing countries, Percentage expenditure, adultMortality, infantdeaths, Alcohol, Income composition of resources, Schooling could influence life expectancy in some degree.
Table 2. Relation between life expectancy and .the variables (GDP, Adult Mortality, infant deaths, Alcohol, Population, Income composition of resources, Schooling) in developing countries, according to Logistic Regression.
coef | std err | t | P>|t| | [0.025 | 0.975] | |
Intercept | 54.2072 | 0.825 | 65.73 | 0 | 52.589 | 55.825 |
percentageexpenditure | 0.0008 | 0 | 2.084 | 0.037 | 4.47E-05 | 0.001 |
Totalexpenditure | -0.0141 | 0.057 | -0.25 | 0.803 | -0.125 | 0.097 |
GDP | 2.23E-05 | 5.58E-05 | 0.399 | 0.69 | -8.73E-05 | 0 |
AdultMortality | -0.03 | 0.001 | -28.92 | 0 | -0.032 | -0.028 |
infantdeaths | -0.0039 | 0.001 | -2.995 | 0.003 | -0.006 | -0.001 |
Alcohol | -0.2352 | 0.043 | -5.462 | 0 | -0.32 | -0.151 |
Population | 2.94E-09 | 2.16E-09 | 1.365 | 0.173 | -1.29E-09 | 7.17E-09 |
Incomecompositionofresources | 11.1716 | 1.037 | 10.769 | 0 | 9.137 | 13.207 |
Schooling | 1.1243 | 0.079 | 14.301 | 0 | 0.97 | 1.279 |
By contrast, merely three variables, adultMortality, Income composition of resources and Schooling, were connected to the life expectancy in the developed countries.
Table 3. Relation between life expectancy and .the variables (GDP, Adult Mortality, infant deaths, Alcohol, Population, Income composition of resources, Schooling) in developed countries, according to Logistic Regression.
coef | std err | t | P>|t| | [0.025 | 0.975] | |
Intercept | 34.3938 | 4.086 | 8.417 | 0 | 26.343 | 42.445 |
percentageexpenditure | 0.0002 | 0 | 0.902 | 0.368 | 0 | 0.001 |
Totalexpenditure | 0.1238 | 0.073 | 1.698 | 0.091 | -0.02 | 0.268 |
GDP | -2.82E-05 | 2.95E-05 | -0.954 | 0.341 | -8.64E-05 | 3.00E-05 |
AdultMortality | -0.0111 | 0.004 | -2.962 | 0.003 | -0.019 | -0.004 |
infantdeaths | 0.0477 | 0.207 | 0.23 | 0.818 | -0.36 | 0.456 |
Alcohol | -0.1545 | 0.083 | -1.855 | 0.065 | -0.319 | 0.01 |
Population | 1.19E-08 | 1.23E-08 | 0.963 | 0.336 | -1.24E-08 | 3.62E-08 |
Incomecompositionofresources | 64.5169 | 5.972 | 10.803 | 0 | 52.751 | 76.283 |
Schooling | -0.5153 | 0.146 | -3.529 | 0.001 | -0.803 | -0.228 |
5. Analysis
This table was created to see the differences between developed countries and developing countries. The average life expectancy in developed countries was 78.69 years, while that in developing countries was 67.69 years.
Table 4. Life expectancy in developed and developing countries.
status | Life expectancy |
Developed | 78.691736 |
Developing | 67.687349 |
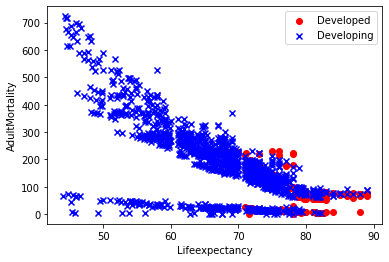
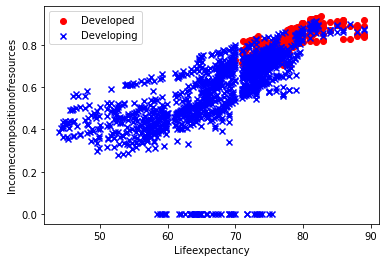
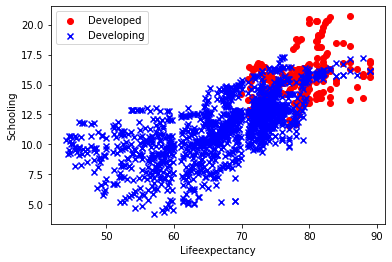
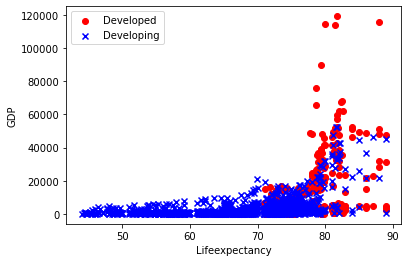
In addition, three scatterplots were constructed to further explore the differences in life expectancy between developed and developing countries based on three factors as follows that were simultaneously associated with both developed and developing countries.
The blue x marks point to developing countries while the red represents developing countries.
Adult mortality has correlation coefficients of -0.01 and -0.03 with life expectancy in developed and developing countries respectively. The negative correlation with life expectancy means that as adult mortality increase in a nation, it is likely to lead to a record of reduced life expectancy among the people, particularly in developing countries.
| |
Figure 1. Relation between life expectancy and adult mortality, income composition of resources, schooling in developed countries compared with that in developing countries. | |
The income composition of resources had a positive correlation with life expectancy, and its coefficient with life expectancy was 64.52 and 11.17 in developed and developing countries respectively. It implied that how productive resources are used significantly influenced the life expectancy in developed countries.
The scatter plot for schooling was positively more moderately correlated with life expectancy compared with adult mortality and income composition of resources. Prior to around age 70, the blue dot spread out in the range of around 5-15 years of schooling. It means that a number of years of schooling did not have that much impact on life expectancy for people younger than 70 in developing countries.
| |
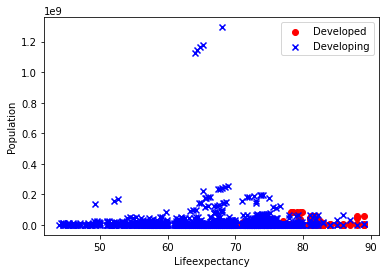
Figure 2. Relation between life expectancy and GDP, population in developed countries compared with that in developing countries. | |
However, the two scatter plots showed that though GDP and population factors show correlations with life expectancy, the correlations are not linear.
There are three variables: percentage expenditure, infant deaths, and alcohol, associated with the life expectancy in developing rather than developed countries. This table recorded the proportion of developed and developing countries among the top 80 countries with the highest Expenditure on health as a percentage of Gross Domestic Product per capita, infant deaths rates, and recorded alcohol per capita (15+) consumption.
Table 5. The proportion of developed and developing countries among the top 80 countries with the highest Expenditure on health as a percentage of Gross Domestic Product per capita, infant deaths rates, and recorded alcohol per capita (15+) consumption.
Countries | Percentage expenditure | Infant deaths | Alcohol |
Developed | 92.50% | 0.00% | 70.00% |
Developing | 7.50% | 100.00% | 30.00% |
According to this table, the 80 countries with the highest infant mortality rates are all developing countries, meaning that the number of infant deaths in developing countries was much higher than in developed countries. Life expectancy in developed countries was not associated with the number of infant deaths, probably because most developed countries have not been concerned with the problem of high infant mortality rates. It could be the same reason that percentage expenditure was not associated with life expectancy in developed countries. Probably this is because expenditure on health as a percentage of Gross Domestic Product in most developed countries is high at a similar level.
6. Conclusion
The independent variables that were chosen for this project were Adult Mortality, infant deaths, Alcohol, percentage expenditure, Hepatitis B, Measles, BMI, under-five deaths, Polio, Total expenditure, Diphtheria, HIV/AIDS, GDP, Population, thinness 1-19 years, thinness 5-9 years, Income composition of resources, and Schooling. Several logistic regression models were tested to examine the significance of the relationships between these independent variables and life expectancy, life expectancy in developed countries, as well as life expectancy in developing countries respectively. The result shows only three variables: adultMortality, Income composition of resources, and Schooling, are associated with all of them, implying that if a country reduces adult mortality, productively uses resources, or promotes education, it is more likely to see its citizens live longer than expected. Percentage expenditure, Infant deaths, and Alcohol are associated with the life expectancy in developing rather than developed countries. The top 80 countries with the highest infant mortality rates are all developing countries, which means a large gap in this dimension between the different states of the countries.
The analyses of the factors associated with life expectancy could augment our understanding of disparities in different countries' life expectancy. The factors are more amenable to intervention than others, suggesting different policy approaches to ameliorate disparities.
References
[1]. Crimmins, E.M. and Zhang, Y.S., 2019. Aging populations, mortality, and life expectancy. Annual Review of Sociology, 45, pp.69-89.
[2]. World Health Organization.(2021). World Health Statistics. Available at:https://www.who.int/data/gho/publications/world-health-statistics. (Accessed 18 May 2022).
[3]. Roser M,Ortiz-Ospina E, and Ritchie H.(2019). Life Expectancy. Available at:https://ourworldindata.org/life-expectancy. (Accessed 18 May 2022).
[4]. United States.(2019) World Population Prospects 2019: Highlights. Available at: https://www.un.org/development/desa/publications/world-population-prospects-2019-highlights.html#:~:text=The%20world's%20population%20is%20expected,United%20Nations%20report%20launched%20today. (Accessed 21 May 2022).
[5]. Mohammed, A.J. and Ghebreyesus, T.A., 2018. Healthy living, well-being and the sustainable development goals. Bulletin of the World Health Organization, 96(9), p.590.
[6]. Murray, C.J., 1988. The infant mortality rate, life expectancy at birth, and a linear index of mortality as measures of general health status. International journal of epidemiology, 17(1), pp.122-128.
[7]. Kulhánová, I., Menvielle, G., Bopp, M., Borrell, C., Deboosere, P., Eikemo, T.A., Hoffmann, R., Leinsalu, M., Martikainen, P., Regidor, E. and Rodríguez-Sanz, M., 2014. Socioeconomic differences in the use of ill-defined causes of death in 16 European countries. BMC Public Health, 14(1), pp.1-8.
[8]. Taylor, R. and Quine, S., 1992. Differences in life expectancy: social factors in mortality rates. Australian Journal on Ageing, 11(1), pp.21-35.
[9]. Preston, S.H. and Taubman, P., 1994. Socioeconomic differences in adult mortality and health status. Demography of aging, 1, pp.279-318.
[10]. Meara, E.R., Richards, S. and Cutler, D.M., 2008. The gap gets bigger: changes in mortality and life expectancy, by education, 1981–2000. Health affairs, 27(2), pp.350-360.
[11]. Hidajat, M.M., Hayward, M.D. and Saito, Y., 2007. Indonesia's social capacity for population health: The educational gap in active life expectancy. Population Research and Policy Review, 26(2), pp.219-234.
[12]. Zimmer, Z., Liu, X., Hermalin, A. and Chuang, Y.L., 1998. Educational attainment and transitions in functional status among older Taiwanese. Demography, 35(3), pp.361-375.
[13]. Bradley, E. H., Elkins, B. R., Herrin, J., & Elbel, B. (2011). Health and social services expenditures: associations with health outcomes. BMJ quality & safety, 20(10), 826-831.
[14]. Bradley, E. H., Canavan, M., Rogan, E., Talbert-Slagle, K., Ndumele, C., Taylor, L., & Curry, L. A. (2016). Variation in health outcomes: the role of spending on social services, public health, and health care, 2000–09. Health Affairs, 35(5), 760-768.
[15]. Dutton, D. J., Forest, P. G., Kneebone, R. D., & Zwicker, J. D. (2018). Effect of provincial spending on social services and health care on health outcomes in Canada: an observational longitudinal study. Cmaj, 190(3), E66-E71.
[16]. OWUMI, B. and EBOH, A., 2021. An assessment of the contribution of healthcare expenditure to life expectancy at birth in Nigeria. Journal of Public Health, pp.1-9.
[17]. World Health Organization.(2018). Global Health Estimates: Life expectancy and leading causes of death and disability.Available at: https://www.who.int/data/gho/data/themes/mortality-and-global-health-estimates. (Accessed 18 May 2022).
Cite this article
Liu,Q. (2023). Difference in the lifeexpectancy between countries: Mortality, health, lifestyle habits, national conditions, and related socioeconomic status (SES). Applied and Computational Engineering,4,561-568.
Data availability
The datasets used and/or analyzed during the current study will be available from the authors upon reasonable request.
Disclaimer/Publisher's Note
The statements, opinions and data contained in all publications are solely those of the individual author(s) and contributor(s) and not of EWA Publishing and/or the editor(s). EWA Publishing and/or the editor(s) disclaim responsibility for any injury to people or property resulting from any ideas, methods, instructions or products referred to in the content.
About volume
Volume title: Proceedings of the 3rd International Conference on Signal Processing and Machine Learning
© 2024 by the author(s). Licensee EWA Publishing, Oxford, UK. This article is an open access article distributed under the terms and
conditions of the Creative Commons Attribution (CC BY) license. Authors who
publish this series agree to the following terms:
1. Authors retain copyright and grant the series right of first publication with the work simultaneously licensed under a Creative Commons
Attribution License that allows others to share the work with an acknowledgment of the work's authorship and initial publication in this
series.
2. Authors are able to enter into separate, additional contractual arrangements for the non-exclusive distribution of the series's published
version of the work (e.g., post it to an institutional repository or publish it in a book), with an acknowledgment of its initial
publication in this series.
3. Authors are permitted and encouraged to post their work online (e.g., in institutional repositories or on their website) prior to and
during the submission process, as it can lead to productive exchanges, as well as earlier and greater citation of published work (See
Open access policy for details).
References
[1]. Crimmins, E.M. and Zhang, Y.S., 2019. Aging populations, mortality, and life expectancy. Annual Review of Sociology, 45, pp.69-89.
[2]. World Health Organization.(2021). World Health Statistics. Available at:https://www.who.int/data/gho/publications/world-health-statistics. (Accessed 18 May 2022).
[3]. Roser M,Ortiz-Ospina E, and Ritchie H.(2019). Life Expectancy. Available at:https://ourworldindata.org/life-expectancy. (Accessed 18 May 2022).
[4]. United States.(2019) World Population Prospects 2019: Highlights. Available at: https://www.un.org/development/desa/publications/world-population-prospects-2019-highlights.html#:~:text=The%20world's%20population%20is%20expected,United%20Nations%20report%20launched%20today. (Accessed 21 May 2022).
[5]. Mohammed, A.J. and Ghebreyesus, T.A., 2018. Healthy living, well-being and the sustainable development goals. Bulletin of the World Health Organization, 96(9), p.590.
[6]. Murray, C.J., 1988. The infant mortality rate, life expectancy at birth, and a linear index of mortality as measures of general health status. International journal of epidemiology, 17(1), pp.122-128.
[7]. Kulhánová, I., Menvielle, G., Bopp, M., Borrell, C., Deboosere, P., Eikemo, T.A., Hoffmann, R., Leinsalu, M., Martikainen, P., Regidor, E. and Rodríguez-Sanz, M., 2014. Socioeconomic differences in the use of ill-defined causes of death in 16 European countries. BMC Public Health, 14(1), pp.1-8.
[8]. Taylor, R. and Quine, S., 1992. Differences in life expectancy: social factors in mortality rates. Australian Journal on Ageing, 11(1), pp.21-35.
[9]. Preston, S.H. and Taubman, P., 1994. Socioeconomic differences in adult mortality and health status. Demography of aging, 1, pp.279-318.
[10]. Meara, E.R., Richards, S. and Cutler, D.M., 2008. The gap gets bigger: changes in mortality and life expectancy, by education, 1981–2000. Health affairs, 27(2), pp.350-360.
[11]. Hidajat, M.M., Hayward, M.D. and Saito, Y., 2007. Indonesia's social capacity for population health: The educational gap in active life expectancy. Population Research and Policy Review, 26(2), pp.219-234.
[12]. Zimmer, Z., Liu, X., Hermalin, A. and Chuang, Y.L., 1998. Educational attainment and transitions in functional status among older Taiwanese. Demography, 35(3), pp.361-375.
[13]. Bradley, E. H., Elkins, B. R., Herrin, J., & Elbel, B. (2011). Health and social services expenditures: associations with health outcomes. BMJ quality & safety, 20(10), 826-831.
[14]. Bradley, E. H., Canavan, M., Rogan, E., Talbert-Slagle, K., Ndumele, C., Taylor, L., & Curry, L. A. (2016). Variation in health outcomes: the role of spending on social services, public health, and health care, 2000–09. Health Affairs, 35(5), 760-768.
[15]. Dutton, D. J., Forest, P. G., Kneebone, R. D., & Zwicker, J. D. (2018). Effect of provincial spending on social services and health care on health outcomes in Canada: an observational longitudinal study. Cmaj, 190(3), E66-E71.
[16]. OWUMI, B. and EBOH, A., 2021. An assessment of the contribution of healthcare expenditure to life expectancy at birth in Nigeria. Journal of Public Health, pp.1-9.
[17]. World Health Organization.(2018). Global Health Estimates: Life expectancy and leading causes of death and disability.Available at: https://www.who.int/data/gho/data/themes/mortality-and-global-health-estimates. (Accessed 18 May 2022).


