


1. Introduction
Low-light image enhancement plays a fundamental role in a variety of tasks in computer vision, where tasks such as target tracking, target detection, and entity segmentation are highly dependent on high-quality input images. However, in real-world scenarios, darker images are often easily captured due to poor lighting conditions, which seriously affects the performance of subsequent tasks. For example, in images captured by nighttime surveillance cameras, low illumination makes it difficult to clearly identify the target, which increases the safety hazard; in automatic driving scenarios [1] , unevenly cast shadows usually produce irregular dark areas on the lane [2] , which affects obstacle recognition, etc. Therefore, proposing an algorithm for low-light image enhancement is of great value to promote the development and application of computer vision technology, which has a positive effect on social security and various industries.
In recent years, with the development of artificial intelligence, deep learning-based low-light image enhancement methods can be broadly categorized into supervised and unsupervised learning methods based on convolutional neural networks and Transformer [3] . CNN-based methods such as Retinex-Net are based on Retinex theory, which decomposes low-light images into illumination and reflection components to realize image decomposition and enhancement [4] ; KinD introduces a two-branch network while designing a joint optimization strategy, which improves the contrast and detail retention of the image [5] . Transformer-based methods, on the other hand, leverage their global feature modeling capabilities to show strong potential in enhancement tasks due to their global feature modeling capabilities [6] , e.g., Restorm er utilizes the self-attention mechanism to model the long-range dependency of images for enhancement and denoising of low-light images [7] . Unsupervised learning methods such as EnlightenGAN achieve image brightness enhancement and effective preservation of details by modeling the distribution of low and normal light images without paired data by generating an adversarial network GAN framework [8] .
Although existing methods have achieved excellent results in low-light image enhancement, they still have some limitations: supervised learning methods are usually more computationally demanding and rely on large-scale pairwise data, while collecting such data is costly in practical applications [9] . To address these issues, researchers have proposed the zero-learning ZSL method [10] , in which the Zero-DCE model optimizes the image enhancement curves in a reference-free manner, which significantly reduces the dependence on pairwise data [11] . However, the color loss function of Zero-DCE simply subtracts the pixel values of the three RGB channels two by two to measure the color difference when processing color images, which is not robust and precise enough, and this insufficiently reasonable assumption leads to obvious color deviations and unnatural visual effects in Zero-DCE-enhanced images, which seriously affects the overall quality of images.
Based on the above problems, we have improved the color loss function in Zero-DCE, which can improve the color deviation, unnatural visual effect and other problems that affect the overall quality of the image when processing color images in Zero-DCE.
2. Methodology
2.1. Introduction to the Zero-DCE methodology
Zero-DCE is an unsupervised image enhancement algorithm that does not require paired training data [12] , unlike traditional networks that learn the mapping between low-light images and Ground Truth, this method designs a DCE-Net to estimate a set of best-fit light enhancement curves as a means of iteratively enhancing a given low-light image. The DCE-Net consists of 7 convolutional layers, of which there are 3 cross-layer connections to help the information flow and avoid the gradient vanishing problem, the network structure is shown in Fig.1 .
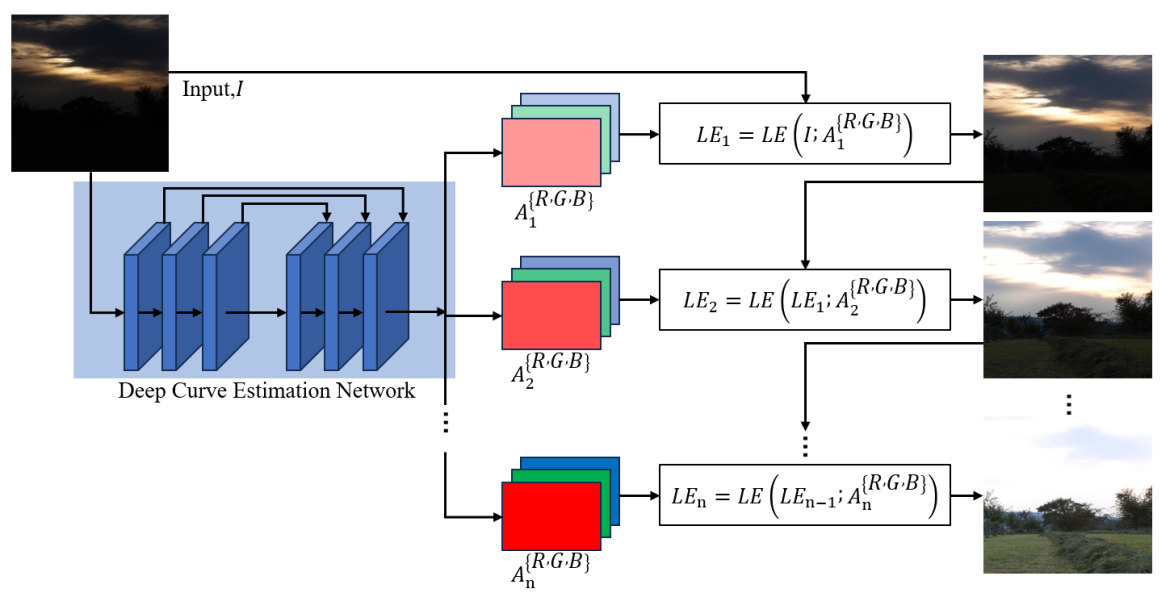
Figure 1: Zero-DCE network architecture diagram [12].
With this method, Zero-DCE is able to complete the enhancement without Ground Truth, which is very suitable for dealing with the situation where pairwise data is not available, and greatly reduces the training cost and data collection cost.
2.2. Introduction to Zero-DCE loss function
The loss function of the Zero-DCE algorithm includes several components, due to space limitation only the color loss function is introduced, which is based on the assumption of gray-world color constancy, i.e., the average luminance of each channel should converge to the same level in the enhanced image, whose expression is shown in Equation (1):
\( {L_{col}}=\sum _{∀(p,q)∈ε} ({J^{p}}-{J^{q}}{)^{2}},ε=\lbrace (R,G),(R,B),(G,B)\rbrace \ \ \ (1) \)
where \( p \) and \( q \) are R/G/B, respectively.
2.3. Improved color loss function
During our experiments, we observed that the loss function of Zero-DCE may be oversimplified in some cases, because in real images, the luminance distributions between different channels are proportional and not strictly equal.
We randomly selected 1000 high-quality color images on two websites [13] [14] for calculating the average value of the three RGB channels, and found that in high-quality real images, the average luminance values of the three RGB channels are not equal, but there is a certain proportional relationship. After statistical analysis, it is concluded that the average proportional relationship of R, G, and B is about 1:1:0.96. Therefore, the original color loss function may not accurately reflect the true color relationship of the image, thus affecting the effect of image enhancement.
Based on the above observations, we improved the color loss function, and the improved color loss function takes into account the actual proportionality between the RGB channels, and the expression is shown in Equation (2).
\( \begin{array}{c} {L_{col}}=\sum _{∀(p,q)∈ε} ({J^{p}}-{J^{q}}{)^{2}},ε=\lbrace (R,G)\rbrace \\ {L_{col}}=\sum _{∀(p,q)∈ε} ({J^{p}}-\frac{1}{0.96}{J^{q}}{)^{2}},ε=\lbrace (R,B),(G,B)\rbrace \end{array} \ \ \ (2) \)
where \( p \) and \( q \) are R/G/B, respectively.
3. Experimental Setup
3.1. Experimental environment
This experiment was computed on NVIDIA GeForce RTX 3050 Ti GPUs and utilized the PyTorch deep learning framework for model building and training, using PyCharm as the integrated development environment. During the training process, the learning rate is set to 0.0001, the batch size is 8, and the total number of rounds (epochs) of training is 200.
3.2. Introduction to the dataset
In this paper, LOL[15] and VE-LOL[16] are selected as the datasets for the experiments.
The LOL dataset is a publicly available dataset for low-light image enhancement research, containing a large number of images taken under low-light conditions and their corresponding normal-light images, covering a wide range of indoor scenes (e.g., indoor people, indoor objects, etc.) and outdoor scenes (e.g., nighttime streets, night scenes, etc.). Among them, the training set contains 485 low-light images and their corresponding normal-light images, and the test set contains 15 low-light images and their corresponding normal-light images. Fig.2 shows some example images in the LOL dataset.
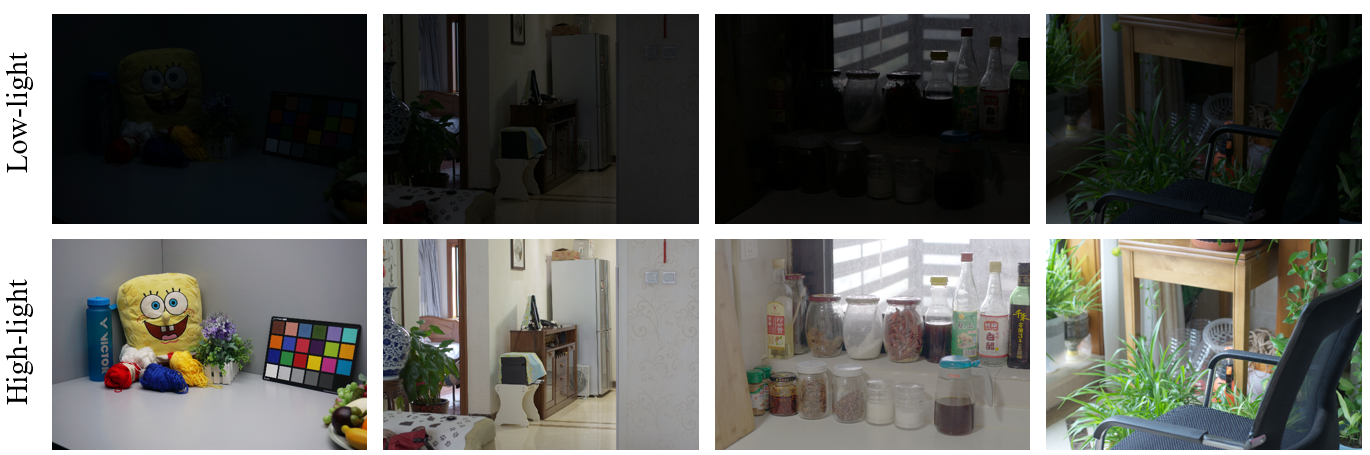
Figure 2: Example image of the LOL dataset.
VE-LOL is also a large-scale dataset for low-light image research, which consists of two subsets: the VE-LOL-L subset consists of real pairs of images and composite images captured under low and normal lighting conditions with diverse backgrounds and various objects, which can be used for the bottom-level visual assessment; the VE-LOL-H subset consists of 10,940 annotated low-light face images, labeled as face bounding boxes, which can be used for the high-level visual assessment. consisting of 10,940 low-light face images with annotations on face bounding boxes, which can be used for high-level visual assessment, and the VE-LOL-L dataset is used in this paper. Fig.3 is some example images from this dataset .
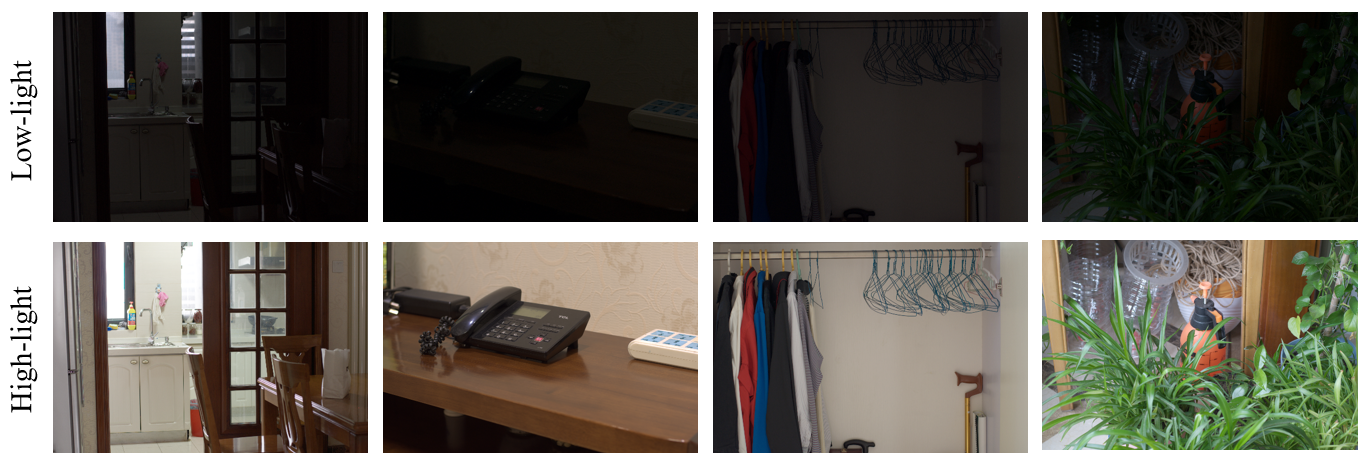
Figure 3: Some sample images from the VE-LOL-L dataset.
3.3. Comparison experiment
3.3.1. Quantitative comparison
For quantitative evaluation, we tested the models before and after improving the color loss function using common metrics such as PSNR (Peak Signal-to-Noise Ratio), SSIM (Structural Similarity), and MSE (Mean Squared Error) on the LOL dataset and VE-LOL-L dataset, respectively, and the results are shown in Table 1.
It can be seen that compared with Zero-DCE, the MSE value of our method is smaller, indicating that the enhanced image of our method has less difference from the normal illumination image at the pixel level; both PSNR and SSIM values are higher, indicating that the improved method performs better in maintaining the structural information of the image. These data indicate that the improved model has significantly improved the reconstruction quality and structural similarity of the image, and is able to generate enhancement results that are closer to the real image, reflecting the superiority of our method.
Table 1: Quantitative Comparison Results on LOL and VE-LOL-L Datasets.
Method | LOL | VE-LOL-L | ||||
MSE | PSNR | SSIM | MSE | PSNR | SSIM | |
Zero-DCE | 0.0293 | 16.06 | 0.5071 | 0.0216 | 16.84 | 0.5091 |
Improved Zero-DCE | 0.0265 | 16.55 | 0.5241 | 0.0210 | 17.44 | 0.5372 |
3.3.2. Qualitative comparison
In the qualitative evaluation, we selected several representative low-light images from the test sets of LOL and VE-LOL datasets to compare the enhancement effects on the same image before and after the improved model. As shown in Fig.4 , it can be seen that the Zero- DCE model suffers from over- or under-enhancement in some regions, resulting in image color distortion or loss of details. In contrast, the improved model has an obvious advantage in visual effect, which can enhance the brightness of the image more naturally while maintaining good color consistency and detail retention. In the dark areas, the improved model is able to clearly show more details, while the bright areas are not overexposed, and the overall visual effect is more realistic and comfortable.
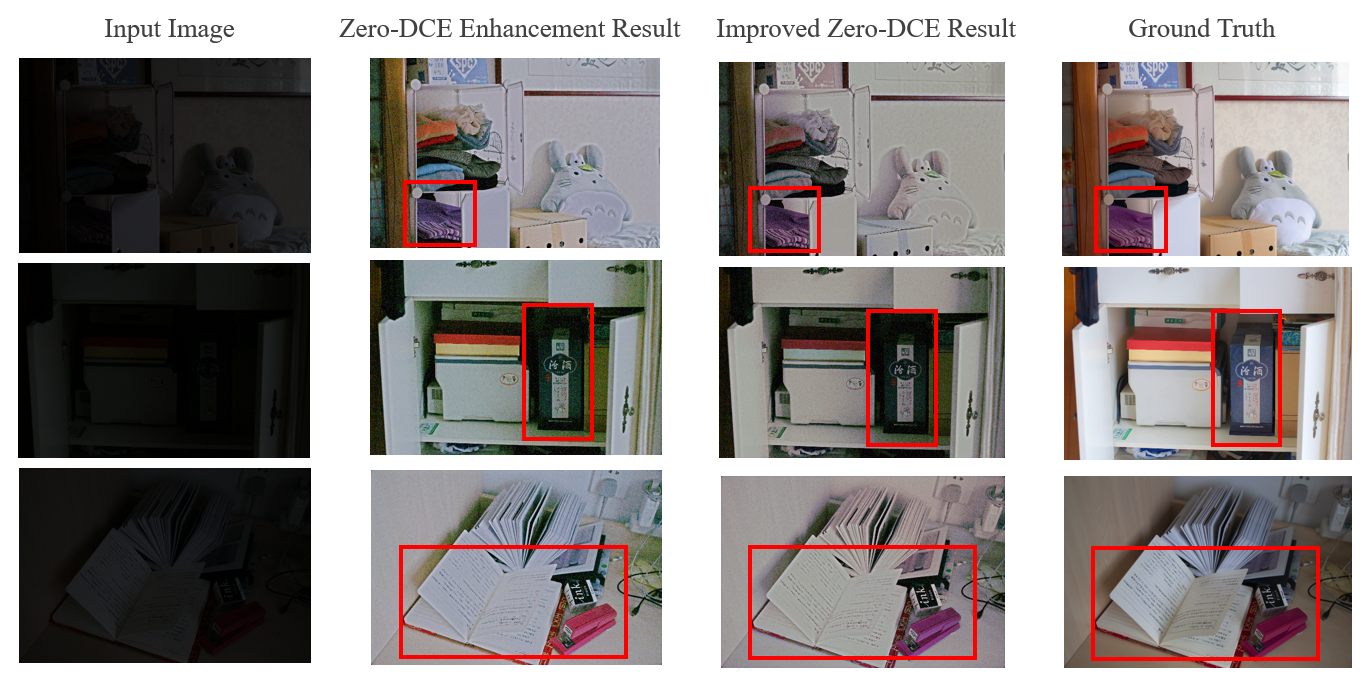
Figure 4: Before and After Improvement.
3.4. Ablation experiments
We carried out ablation experiments to verify the effectiveness of the improved color loss function in the Zero-DCE model, and the experimental results are shown in Table2 It can be found that after removing the color loss function, the MSE metric of the model increases from the original 0.0293 to 0.2561, the PSNR decreases significantly from 16.06 to 5.75, and the SSIM decreases from 0.5071 to 0.2983, which indicates that the removal of this function seriously affects the model performance, resulting in a significant increase in the difference between the enhanced image and the real image in terms of pixel value, quality and structural similarity.
The MSE of the Zero- DCE model with improved color loss function is reduced to 0.0265, PSNR is enhanced to 16.55, and SSIM is improved to 0.5241, which fully proves that the improved color loss function plays a key role in enhancing the performance of the model, and it can effectively reduce the difference between the enhanced image and the real image, and improve the image quality and structural similarity.
Table 2: Ablation Experiments.
Method | MSE | PSNR | SSIM |
Original Zero-DCE | 0.0293 | 16.06 | 0.5071 |
Remove the color loss function | 0.2561 | 5.75 | 0.2983 |
Improvements to Zero-DCE | 0.0265 | 16.55 | 0.5241 |
3.5. Hyperparameter selection
In order to explore the hyperparameter settings for optimizing the model performance, we conducted hyperparameter selection experiments. Learning rate, convolutional kernel size, convolutional step size, and number of convolutional layers were tuned respectively, and changes in model performance were observed.
As shown in Table 3 , with the original hyperparameter settings, the model's MSE is 0.0265, PSNR reaches 16.55, and SSIM is 0.5241. When the learning rate is set to 0.001, the MSE rises slightly to 0.0266, the PSNR decreases to 16.39, and the SSIM also decreases to 0.5204. Setting the convolution kernel size to 5*5, the MSE rises to 0.0337, PSNR decreases to 15.16 and SSIM decreases to 0.4986, indicating that this convolution kernel size is not favorable for the model to process the image. When the convolution step size is set to 2, the MSE increases to 0.0416, the PSNR decreases to 14.83, but the SSIM rises to 0.6677, which shows that the change in convolution step size uniquely affects the structural similarity of the image. When the convolutional layers were reduced to 6 layers, the MSE was 0.0294, PSNR was 16.10, and SSIM was 0.5279, which showed some degree of fluctuation in the performance of the model when compared to the original setup.
Table 3: Hyperparameter Selection.
Hyperparameter Setting | MSE | PSNR | SSIM |
original setup | 0.0265 | 16.55 | 0.5241 |
Learning rate set to 0.001 | 0.0266 | 16.39 | 0.5204 |
The convolution kernel size is set to 5*5 | 0.0337 | 15.16 | 0.4986 |
The convolution step is set to 2 | 0.0416 | 14.83 | 0.6677 |
Convolutional layers reduced to 6 | 0.0294 | 16.10 | 0.5279 |
4. Conclusion
In this paper, LOL and VE-LOL-L are used as the experimental datasets, and a multifaceted experimental study of the Zero-DCE model with improved color loss function is conducted. In the comparison experiments, the improved model performs well in quantitative metrics, with the MSE value reduced by 9.56% and the PSNR and SSIM values improved by 3.05% and 3.35%, respectively, on the LOL dataset; and on the VE-LOL-L dataset, the MSE value is reduced by 2.78%, and the PSNR and SSIM values are improved by 3.56% and 5.52%, respectively. Qualitative evaluation also showed significant advantages in visualization, enhancing the image more naturally and preserving more details. The ablation experiments, on the other hand, demonstrate the key role of the improved color loss function in enhancing the model performance. However, there are still limitations that can be optimized in this method, and in future research, we can consider further optimizing the network structure and exploring more complex channel proportionality relationship modeling methods, to improve the adaptability of the model in complex scenes; at the same time, we can try to combine with other advanced deep learning techniques, such as more efficient attention mechanisms, to further improve the quality of image enhancement.
References
[1]. Badue, C., Guidolini, R., Carneiro, R. V., Azevedo, P., Cardoso, V. B., Forechi, A., ... & De Souza, A. F. (2021). Self-driving cars: A survey. Expert systems with applications, 165, 113816.
[2]. Kim, W. (2022). Low-light image enhancement: A comparative review and prospects. IEEE Access, 10, 84535-84557.
[3]. Ma, L., Ma, T., Liu, R., Fan, X., & Luo, Z. (2022). Toward fast, flexible, and robust low-light image enhancement. In Proceedings of the IEEE/CVF conference on computer vision and pattern recognition (pp. 5637-5646).
[4]. Yang, W., Wang, W., Huang, H., Wang, S., & Liu, J. (2021). Sparse gradient regularized deep retinex network for robust low-light image enhancement. IEEE Transactions on Image Processing, 30, 2072-2086.
[5]. Li, J., Feng, X., & Hua, Z. (2021). Low-light image enhancement via progressive-recursive network. IEEE Transactions on Circuits and Systems for Video Technology, 31(11), 4227-4240.
[6]. Wang, T., Zhang, K., Shen, T., Luo, W., Stenger, B., & Lu, T. (2023, June). Ultra-high-definition low-light image enhancement: A benchmark and transformer-based method. In Proceedings of the AAAI Conference on Artificial Intelligence (Vol. 37, No. 3, pp. 2654-2662).
[7]. Zamir, S. W., Arora, A., Khan, S., Hayat, M., Khan, F. S., & Yang, M. H. (2022). Restormer: Efficient transformer for high-resolution image restoration. In Proceedings of the IEEE/CVF conference on computer vision and pattern recognition (pp. 5728-5739).
[8]. Jiang, Y., Gong, X., Liu, D., Cheng, Y., Fang, C., Shen, X., ... & Wang, Z. (2021). Enlightengan: Deep light enhancement without paired supervision. IEEE transactions on image processing, 30, 2340-2349.
[9]. Lehr, J., Philipps, J., Hoang, V. N., von Wrangel, D., & Krüger, J. (2021, May). Supervised learning vs. unsupervised learning: A comparison for optical inspection applications in quality control. In IOP Conference Series: Materials Science and Engineering (Vol. 1140, No. 1, p. 012049). IOP Publishing.
[10]. Zheng, S., & Gupta, G. (2022). Semantic-guided zero-shot learning for low-light image/video enhancement. In Proceedings of the IEEE/CVF Winter conference on applications of computer vision (pp. 581-590).
[11]. Li, C., Guo, C., Han, L., Jiang, J., Cheng, M. M., Gu, J., & Loy, C. C. (2021). Low-light image and video enhancement using deep learning: A survey. IEEE transactions on pattern analysis and machine intelligence, 44(12), 9396-9416.
[12]. Guo, C., Li, C., Guo, J., Loy, C. C., Hou, J., Kwong, S., & Cong, R. (2020). Zero-reference deep curve estimation for low-light image enhancement. In Proceedings of the IEEE/CVF conference on computer vision and pattern recognition (pp. 1780-1789).
[13]. Unsplash. (n.d.). A platform for high-quality, royalty-free images. https://unsplash.com/. Accessed [2025-01-12].
[14]. Pexels. (n.d.). A website providing free stock photos and videos. https://www.pexels.com/zh-cn/. Accessed [2025-01-12].
[15]. Wei, C., Wang, W., Yang, W., & Liu, J. (2018). Deep retinex decomposition for low-light enhancement. arXiv preprint arXiv:1808.04560.
[16]. Liu, J., Xu, D., Yang, W., Fan, M., & Huang, H. (2021). Benchmarking low-light image enhancement and beyond. International Journal of Computer Vision, 129, 1153-1184.
Cite this article
Yu,L. (2025). Research on Low-Light Image Enhancement Algorithm Based on Color-Improved Zero-DCE. Applied and Computational Engineering,142,57-63.
Data availability
The datasets used and/or analyzed during the current study will be available from the authors upon reasonable request.
Disclaimer/Publisher's Note
The statements, opinions and data contained in all publications are solely those of the individual author(s) and contributor(s) and not of EWA Publishing and/or the editor(s). EWA Publishing and/or the editor(s) disclaim responsibility for any injury to people or property resulting from any ideas, methods, instructions or products referred to in the content.
About volume
Volume title: Proceedings of MSS 2025 Symposium: Automation and Smart Technologies in Petroleum Engineering
© 2024 by the author(s). Licensee EWA Publishing, Oxford, UK. This article is an open access article distributed under the terms and
conditions of the Creative Commons Attribution (CC BY) license. Authors who
publish this series agree to the following terms:
1. Authors retain copyright and grant the series right of first publication with the work simultaneously licensed under a Creative Commons
Attribution License that allows others to share the work with an acknowledgment of the work's authorship and initial publication in this
series.
2. Authors are able to enter into separate, additional contractual arrangements for the non-exclusive distribution of the series's published
version of the work (e.g., post it to an institutional repository or publish it in a book), with an acknowledgment of its initial
publication in this series.
3. Authors are permitted and encouraged to post their work online (e.g., in institutional repositories or on their website) prior to and
during the submission process, as it can lead to productive exchanges, as well as earlier and greater citation of published work (See
Open access policy for details).
References
[1]. Badue, C., Guidolini, R., Carneiro, R. V., Azevedo, P., Cardoso, V. B., Forechi, A., ... & De Souza, A. F. (2021). Self-driving cars: A survey. Expert systems with applications, 165, 113816.
[2]. Kim, W. (2022). Low-light image enhancement: A comparative review and prospects. IEEE Access, 10, 84535-84557.
[3]. Ma, L., Ma, T., Liu, R., Fan, X., & Luo, Z. (2022). Toward fast, flexible, and robust low-light image enhancement. In Proceedings of the IEEE/CVF conference on computer vision and pattern recognition (pp. 5637-5646).
[4]. Yang, W., Wang, W., Huang, H., Wang, S., & Liu, J. (2021). Sparse gradient regularized deep retinex network for robust low-light image enhancement. IEEE Transactions on Image Processing, 30, 2072-2086.
[5]. Li, J., Feng, X., & Hua, Z. (2021). Low-light image enhancement via progressive-recursive network. IEEE Transactions on Circuits and Systems for Video Technology, 31(11), 4227-4240.
[6]. Wang, T., Zhang, K., Shen, T., Luo, W., Stenger, B., & Lu, T. (2023, June). Ultra-high-definition low-light image enhancement: A benchmark and transformer-based method. In Proceedings of the AAAI Conference on Artificial Intelligence (Vol. 37, No. 3, pp. 2654-2662).
[7]. Zamir, S. W., Arora, A., Khan, S., Hayat, M., Khan, F. S., & Yang, M. H. (2022). Restormer: Efficient transformer for high-resolution image restoration. In Proceedings of the IEEE/CVF conference on computer vision and pattern recognition (pp. 5728-5739).
[8]. Jiang, Y., Gong, X., Liu, D., Cheng, Y., Fang, C., Shen, X., ... & Wang, Z. (2021). Enlightengan: Deep light enhancement without paired supervision. IEEE transactions on image processing, 30, 2340-2349.
[9]. Lehr, J., Philipps, J., Hoang, V. N., von Wrangel, D., & Krüger, J. (2021, May). Supervised learning vs. unsupervised learning: A comparison for optical inspection applications in quality control. In IOP Conference Series: Materials Science and Engineering (Vol. 1140, No. 1, p. 012049). IOP Publishing.
[10]. Zheng, S., & Gupta, G. (2022). Semantic-guided zero-shot learning for low-light image/video enhancement. In Proceedings of the IEEE/CVF Winter conference on applications of computer vision (pp. 581-590).
[11]. Li, C., Guo, C., Han, L., Jiang, J., Cheng, M. M., Gu, J., & Loy, C. C. (2021). Low-light image and video enhancement using deep learning: A survey. IEEE transactions on pattern analysis and machine intelligence, 44(12), 9396-9416.
[12]. Guo, C., Li, C., Guo, J., Loy, C. C., Hou, J., Kwong, S., & Cong, R. (2020). Zero-reference deep curve estimation for low-light image enhancement. In Proceedings of the IEEE/CVF conference on computer vision and pattern recognition (pp. 1780-1789).
[13]. Unsplash. (n.d.). A platform for high-quality, royalty-free images. https://unsplash.com/. Accessed [2025-01-12].
[14]. Pexels. (n.d.). A website providing free stock photos and videos. https://www.pexels.com/zh-cn/. Accessed [2025-01-12].
[15]. Wei, C., Wang, W., Yang, W., & Liu, J. (2018). Deep retinex decomposition for low-light enhancement. arXiv preprint arXiv:1808.04560.
[16]. Liu, J., Xu, D., Yang, W., Fan, M., & Huang, H. (2021). Benchmarking low-light image enhancement and beyond. International Journal of Computer Vision, 129, 1153-1184.