


1. Introduction
Bitcoin, the first decentralized cryptocurrency, has gained significant attention as a digital asset with substantial market volatility. Its price movements are influenced by various factors, including market sentiment, technology advancements, regulatory changes, and macroeconomic events. These frequent price fluctuations make it challenging for investors to navigate the market and for researchers to develop reliable analytical methods. This research focuses on Bitcoin price behavior during the second half of 2024, a period characterized by unusual volatility and significant price increases toward year-end. By combining forecasting techniques with anomaly detection methods, this study aims to better understand both the underlying trends and notable deviations in Bitcoin prices during this period.
The research objectives are to: (1) Identify major price patterns in Bitcoin during H2 2024. (2) Develop forecasting models to predict price movements trend. (3) Detect and analyze unusual price events in the historical data, and (4) Examine connections between Bitcoin prices and key socioeconomic events, particularly the U.S. presidential election.
This study intends to provide investors with a more practical framework for cryptocurrency investment decisions that considers both technical analysis and external socioeconomic factors. The following sections cover literature review, methodology, forecasting approaches, anomaly detection, results, and conclusions, offering a systematic analysis of Bitcoin’s behavior during this important period in cryptocurrency market history.
2. Literature Review (Related Work)
The analysis of cryptocurrency markets has employed various forecasting methods over time. The auto-regressive integrated moving average (ARIMA) model has been widely used in financial market forecasting due to its linear nature and reliance on stationary data [1]. This traditional approach provides a foundation for time series analysis in volatile markets. As computational capabilities advanced, deep learning methods emerged as powerful alternatives. Long short-term memory (LSTM) networks gained popularity for their ability to predict future values from variable-length sequences for both linear and non-linear data [2]. Unlike ARIMA models, LSTM networks can capture complex patterns and dependencies in time series data without requiring stationarity assumptions. More recently, Facebook introduced Prophet in 2018, a novel forecasting approach that performs exceptionally well for datasets with strong seasonal effects[3]. This method provides decomposable models with interpretable parameters, making it particularly useful for business forecasting applications. Machine learning approaches to cryptocurrency analysis can be categorized into supervised and unsupervised methods. Supervised learning techniques include regression problems (linear regression, Support Vector Machine regression) and classification problems (logistic regression, SVM classification, Random Forest classification). Unsupervised learning methods, which only require input data without corresponding output variables, are particularly valuable for anomaly detection [4]. Beyond technical analysis, research has identified several socio-economic factors that influence Bitcoin prices, including GDP per capita, freedom of trade, and Internet penetration. Bimbrahw’s work demonstrated that the spread of blockchain technology affects international Bitcoin flow, which directly impacts its price [5].
While cryptocurrency analysis has received significant research attention, there is a notable gap in recent studies examining the impact of major events in 2024 on Bitcoin market volatility. The unprecedented nature of these events and their effect on cryptocurrency markets warrants dedicated investigation. This research aims to address this gap by analyzing Bitcoin price movements during the second half of 2024, with particular attention to the relationship between significant socioeconomic events and market behavior.
3. Methodology
3.1. Data Collection
This study utilizes data from Binance APIs, a powerful set of tools provided by the Binance cryptocurrency exchange. These APIs offer extensive endpoints that enable access to trading information, market data, and account management functionality. The dataset covers Bitcoin 1-minute transaction data from June 2, 2024, to December 31, 2024. Data was retrieved from “https://api.binance.com/api/v3/klines”[6] and stored in a CSV file named “BTCUSDT_1min.csv” using Python. This process was implemented through a custom function called “fetch_historical_data” with parameters including “symbol,” “interval,” “start_time,” and “end_time.”
3.2. Data Preprocessing
In order to organize data more representative of the overall situation, Bitcoin’s highest price and lowest price in one minute of the day were picked out, respectively, the price at the open time, 9:30 a.m., and the close time of 4:00 p.m. was chosen, and the sum of the volume of a day. Then, those data were placed in a new file and converted to the character encoding standard of UTF-8, readable by a machine.
3.3. Exploratory Data Analysis (EDA)
The exploratory analysis decomposed each time series (highest price, lowest price, open price, close price, and volume) into trend and fluctuation components using the Hodrick-Prescott filter from statsmodels.tsa.filters.hp_filter. This decomposition allowed for separate examination of long-term trends and short-term fluctuations.
|
|
Figure 1: Bitcoin’s Highest Daily Price Decomposition. | Figure 2: Bitcoin’s Lowest Daily Price Decomposition. |
|
|
Figure 3: Bitcoin’s Open Time Price Decomposition. | Figure 4: Bitcoin’s Close Time Price Decomposition. |
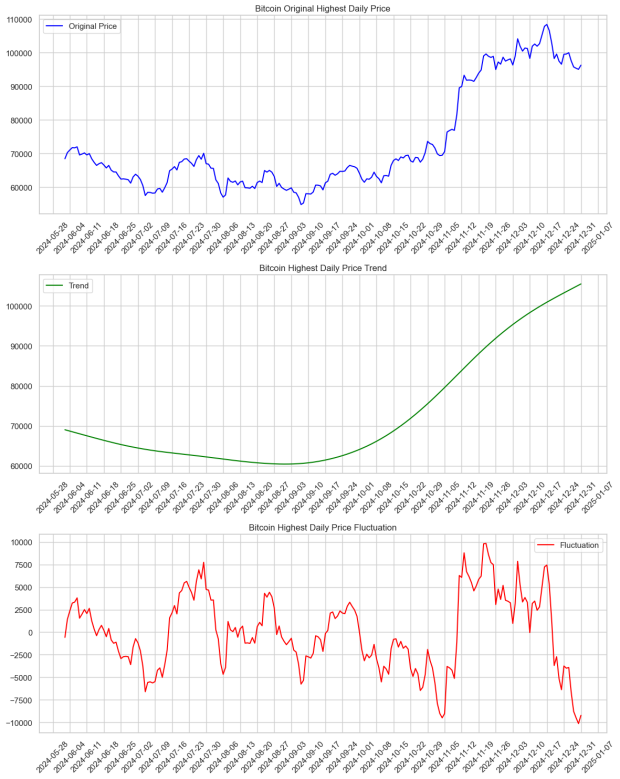
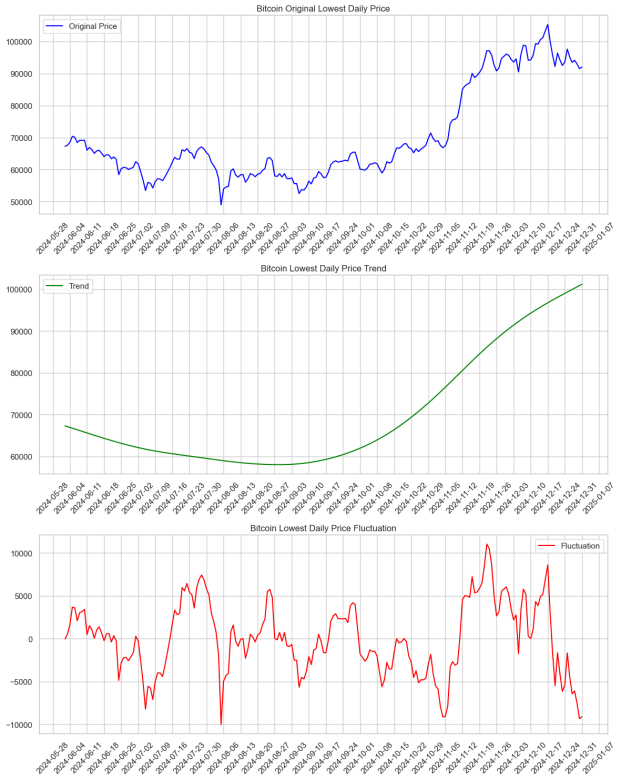
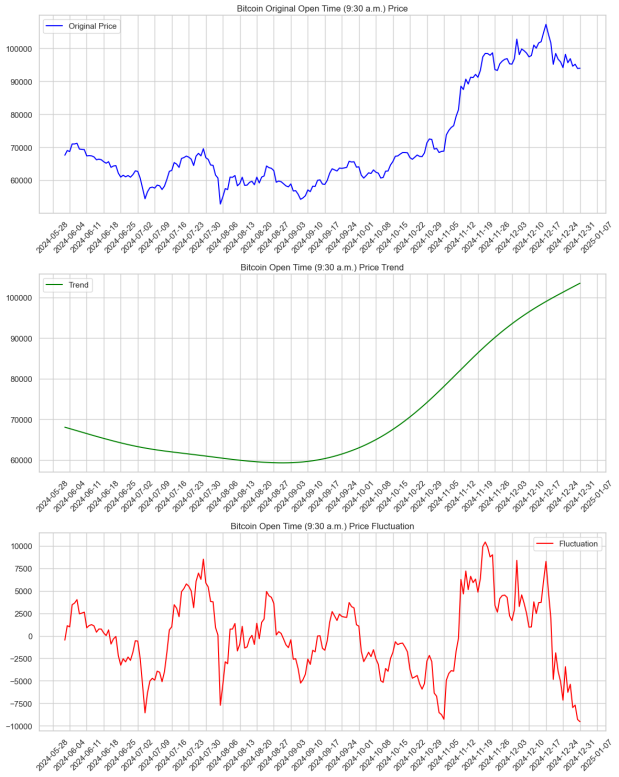
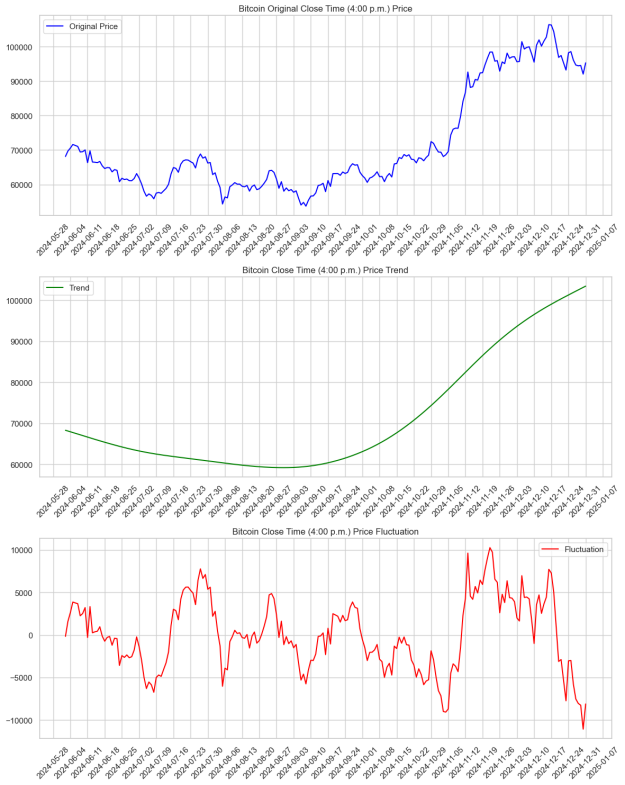
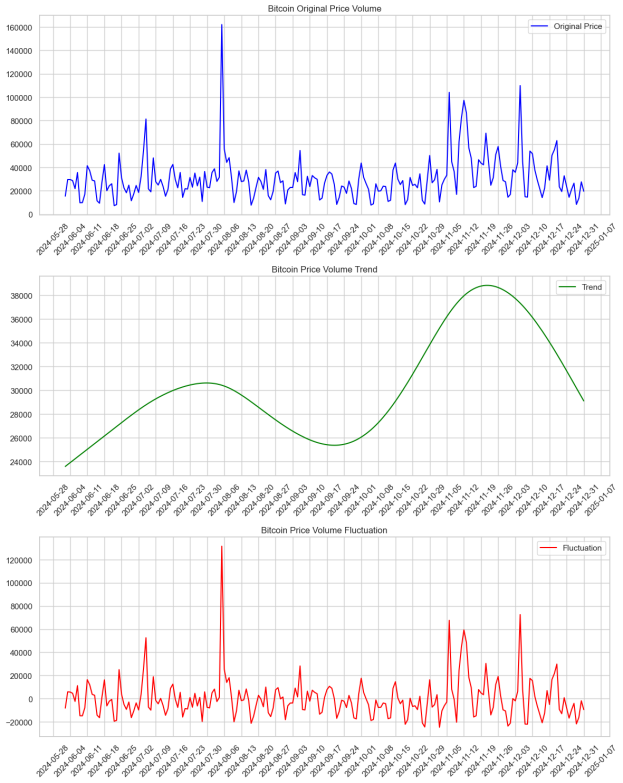
Figure 5: Bitcoin’s Price Volume Decomposition.
The analysis of price metrics (highest, lowest, open, and close) revealed similar patterns across all four metrics: (1) An initial downward trend in the early period, (2) A stable mid-term phase with relatively flat price movement, indicating a market adjustment period, and (3) A sharp upward surge in the later stage, reflecting significant macroeconomic changes.
The residual part fluctuates greatly overall without a clear periodic pattern. There are relatively large up-and-down swings with distinct peaks and valleys. In the later stage, the amplitude of fluctuations augmented, suggesting the increasing market activity, which may be associated with high-frequency trading or major news events.
The volume analysis demonstrated an interesting relationship with price movements. During price declines, volume initially increased as investors sought buying opportunities at lower prices, then subsequently decreased as market sentiment shifted toward fear of sustained price drops. Similar patterns were observed during price increases, shows the complex relationship between price movements and trading volume.
4. Forecasting Bitcoin Prices
4.1. Model Selection and Rationale
For this study, the autoregressive integrated moving average (ARIMA) model was selected to forecast Bitcoin prices. This choice was based on the time-varying nature of Bitcoin prices in the second half of 2024. ARIMA is well-suited for this task because it captures both autoregressive (AR) patterns and moving average (MA) components while addressing non-stationarity through differencing (I). This makes ARIMA effective and flexible for modeling time series data like Bitcoin prices.
4.2. Forecasting Process
First, the data was split into one training set and one testing set, which was stored in the variables “train” and “test” separately. In this model, the training set included the 80% of the original data of the highest Bitcoin price of the day, and the testing set was the remaining 20%. Then, the model was trained with the training set and parameters p, d, and q, which represent the number of previous values to consider for the forecast, the number of differences needed to make the time series stationary, the number of previous error values to consider for the forecast respectively. In this model, p, d, and q were set to 5, 1, and 0 separately to maintain the model’s generality while considering the variation. Finally, the graph containing both the original and predicted data sets was visualized. The forecasting trend of Bitcoin price overlapped the actual price more when the testing set had just begun but deviated increasingly as time passed.
4.3. Model Evaluation
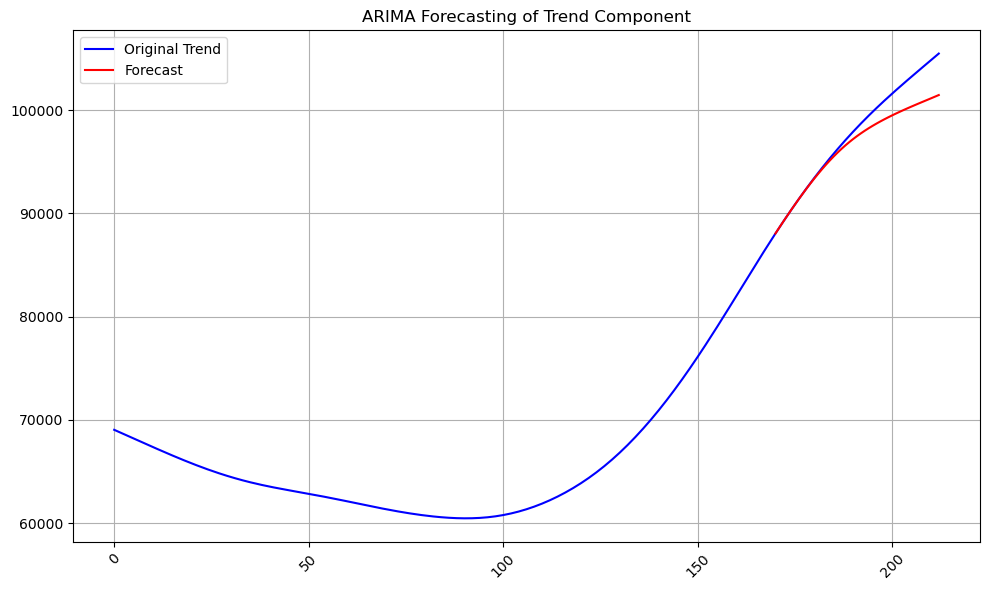
Figure 6: Original and ARIMA Forecasting Trend.
The ARIMA model’s performance revealed several important insights about Bitcoin price forecasting. When compared with actual price data, the forecasts underestimated the true price trajectory at the end of time window. This underestimation primarily stemmed from Bitcoin’s unexpected sharp upward trend in late 2024, a pattern not sufficiently represented in the training data. The model’s accuracy metrics reflected this challenge, with increasing mean absolute percentage error (MAPE) values as the forecast extended further into the future.
Several factors contributed to this forecasting difficulty: (1)The presence of external market-moving events (particularly the U.S. presidential election); (2) the non-linear nature of cryptocurrency price movements; and the influence of market sentiment and institutional investment flows that accelerated in Q4 2024.
Despite these limitations, the ARIMA model successfully captured short-term price dynamics and provided a useful baseline for comparison. The gap between forecasted and actual prices itself reveals valuable information about market behavior, indicates that periods where external factors significantly influenced price beyond what historical patterns would suggest.
For future work, combining ARIMA with models that can incorporate external variables (such as ARIMAX) or exploring non-linear alternatives might improve forecasting accuracy during periods of significant market transformation.
5. Anomaly Detection
5.1. Detection Approaches
This study employed the Isolation Forest algorithm as the primary method for anomaly detection in Bitcoin price data. Isolation Forest is an unsupervised machine learning algorithm that effectively identifies outliers by randomly selecting features and splitting data based on threshold values. This approach is particularly well-suited for Bitcoin price analysis because it can isolate unusual price movements without requiring labeled training data. The algorithm works on the principle that anomalies are “few and different,” making them easier to isolate than normal observations. In the context of Bitcoin prices, this translates to identifying days where price movements significantly deviated from typical patterns. To complement the machine learning approach, statistical methods were also used, including rolling statistics to define thresholds and residual analysis to identify deviations from the trend.
5.2. Implementation Steps
The implementation began by extracting the residual (cyclical) component of Bitcoin price data using the Hodrick-Prescott filter from statsmodels.tsa.filters.hp_filter. This cyclical component, stored in the variable “cycle,” represents the short-term fluctuations after removing the long-term trend.
Then, IsolationForest was imported from sklearn.ensemble for the model training. It had several parameters, but in this model, four were chosen: n_estimatorsr, set as 100, refers to the exact number of iTrees in iForest; max_samples, set as “auto”, refers to the numbers of data used to train to trees; bootstrap refers to sampling whether with or without replacement was set as “False” meaning without replacement; and contamination, set as 0.05 based on Bitcoin context, refers to the threshold indicating where raw anomaly data are translated into inliers or outliers.
With the set of values of residuals, the trained isolation forest model was able to be applied to run for detecting anomalies. In order to distinguish between normal values and outliers, 1 and -1 were used to represent normal ones and anomalous ones separately. Finally, by picking out the label equal to -1, the values of anomalies were stored in the variable “anomalies,” and the actual date each anomaly appeared was stored in “anomaly_dates.” Additionally, after the graph was plotted, those anomalies were marked in the residual graph with orange points, showing the Bitcoin price where it experienced unusual fluctuation.
5.3. Validation of Anomalies
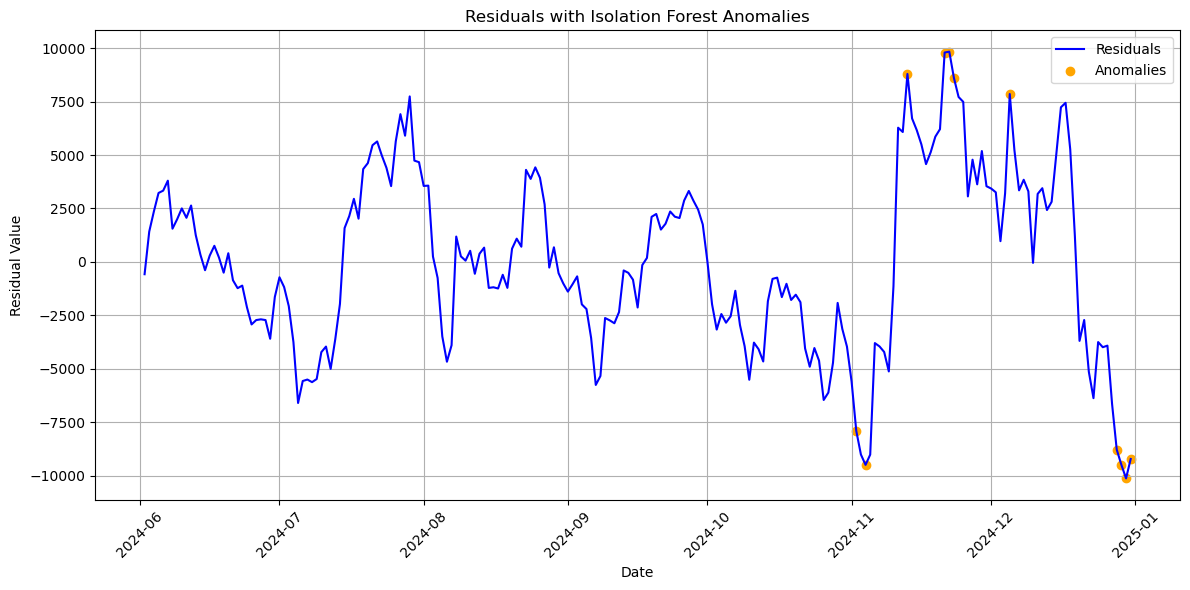
Figure 7: Residuals with Isolation Forest Anomalies.
The anomaly detection results revealed three distinct clusters of unusual price activity:
(1) Early November Cluster: Centered around November 4, just before the 2024 US presidential election. This cluster reflected market uncertainty and heightened volatility as investors positioned themselves ahead of potential election outcomes.
(2) Mid-November to Early December Cluster: Including two slightly separated dates (November 13 and December 5) and additional anomalies around November 22. These anomalies corresponded to the market reaction following Donald Trump’s election victory, whose supportive stance on cryptocurrency contributed to dramatic upward price movements. This period also saw increased institutional investment in the cryptocurrency market, further driving unusual price activity.
(3) Late December Cluster: Occurring in the final days of 2024, these anomalies likely represented a market correction following the dramatic price increases in the preceding weeks.
The temporal distribution of these anomalies strongly corresponded with significant political events, particularly the US presidential election and its aftermath. This correlation validates the effectiveness of the Isolation Forest approach in identifying meaningful anomalies rather than random noise in the data.
6. Results
The ARIMA model and Isolation Forest algorithm both effectively captured the main characteristics of Bitcoin price movements in the second half of 2024. Analysis of the decomposed time series revealed three distinct phases in Bitcoin price behavior: an initial downward movement, followed by a stable mid-term phase with relatively flat price action, and finally a sharp upward surge in the later period.
The 2024 United States presidential election in November emerged as a pivotal event coinciding with significant Bitcoin price changes. Anomalies detected through the Isolation Forest algorithm clustered predominantly in three time periods: early November (around November 4), mid-November to early December (November 13, November 22, and December 5), and the final days of December 2024.
Residual analysis showed greater fluctuations in Bitcoin price after November, with the amplitude of oscillations increasing significantly compared to earlier months. This increase in volatility aligned with the election timeline and subsequent market reactions.
The ARIMA forecasting model underestimated actual Bitcoin prices for longer forecast horizons. The model’s parameters (p=5, d=1, q=0) captured short-term dynamics reasonably well, but failed to anticipate the magnitude of the upward price movement that occurred in the post-election period.
Trading volume analysis revealed interesting patterns related to price movements. During price declines, volume initially increased then subsequently decreased, suggesting changing market sentiment from opportunity-seeking to fear. Similar volume patterns appeared during price increases, indicating complex market psychology throughout the period.
Federal Reserve interest rate cuts of 1% in both September and November coincided with changes in Bitcoin price trends. These monetary policy changes occurred during the transition from the stable phase to the upward surge in Bitcoin prices identified in our decomposition analysis.
Institutional participation in the cryptocurrency market increased noticeably in Q3-Q4 2024, as evidenced by larger transaction volumes and reduced price sensitivity to minor market events compared to earlier in the year.
7. Conclusion and Future Work
This paper analyzed Bitcoin price movements during the second half of 2024 using a combination of time series forecasting and anomaly detection techniques. Our research successfully identified significant price patterns, predicted future price movements with reasonable short-term accuracy, detected anomalous price events, and established strong connections between Bitcoin price dynamics and major socioeconomic events.
The findings revealed that the 2024 US presidential election served as a critical inflection point for Bitcoin prices, triggering both increased volatility and a sustained upward trend. The ARIMA forecasting model provided valuable insights into underlying price patterns, though its accuracy diminished during periods of rapid market transformation. The Isolation Forest algorithm effectively identified anomalous price movements that clustered around significant political events, validating our approach to anomaly detection. This research shows that cryptocurrency markets, while often portrayed as independent from traditional financial systems, are significantly influenced by major political and economic developments. The technical analysis of Bitcoin price data, when combined with consideration of external factors, offers a more comprehensive understanding of cryptocurrency market behavior.
For investors navigating the volatile cryptocurrency landscape, our findings underscore the importance of monitoring both technical indicators and broader socioeconomic developments, particularly political events with potential regulatory implications for digital assets.
Several promising directions for future research emerge from this study. Future studies could expand the dataset to include multiple years of Bitcoin price data, enabling analysis of longer-term patterns and the impact of various types of economic and political events across different market cycles. This extended timeframe would provide more robust insights into how Bitcoin responds to different types of external influences throughout complete market cycles.
Future models could formally incorporate external variables such as political event probabilities, regulatory announcements, or macroeconomic indicators through ARIMAX or related approaches to enhance forecasting capabilities. This integration would create a more holistic analytical framework that acknowledges the interconnection between cryptocurrency markets and broader economic systems.
Expanding the scope to include other major cryptocurrencies would allow for comparative analysis of how different digital assets respond to the same external events, potentially revealing asset-specific vulnerabilities or strengths. Such cross-cryptocurrency analysis could identify which digital assets are most sensitive to particular types of external shocks.
Incorporating social media sentiment analysis could provide additional insights into how public perception influences cryptocurrency prices, potentially serving as a leading indicator for price movements. The relationship between social sentiment and market behavior represents a promising area for investigation, particularly given the significant role of retail investors in cryptocurrency markets.
Developing a systematic framework for assessing the potential impact of regulatory changes on cryptocurrency markets could help investors anticipate market reactions to policy developments. As regulatory environments continue to evolve globally, understanding how different types of regulation affect market behavior will become increasingly important for investors.
By pursuing these research directions, future work can build upon the foundation established in this study to develop more robust analytical tools for cryptocurrency market analysis, benefiting both individual investors and institutional participants in this evolving market.
References
[1]. Almasarweh, M., & Wadi, S. (2018). ARIMA model in predicting banking stock market data. Modern Applied Science, 12(11), 309-318. https://doi.org/10.5539/mas.v12n11p309
[2]. Hochreiter, S., Schmidhuber, J., & Elvezia, C. (1997). Long short-term memory. Neural Computation, 9(8), 1735–1780. https://doi.org/10.1162/neco.1997.9.8.1735
[3]. Aditya Satrio, C. B., Darmawan, W., Nadia, B. U., & Hanafiah, N. (2021). Time series analysis and forecasting of coronavirus disease in Indonesia using ARIMA model and PROPHET. Procedia Computer Science, 179, 524-532. https://doi.org/10.1016/j.procs.2021.01.036
[4]. Ning, S., Shi, J., & Ren, M. (2022). A systematic review of machine learning in cryptocurrency market forecasting. Expert Systems with Applications, 202, 117200. https://doi.org/10.1016/j.eswa.2022.117200
[5]. Parino, F., Beiró, M. G., & Gauvin, L. (2018). Analysis of the Bitcoin blockchain: Socio-economic factors behind the adoption. EPJ Data Science, 7(1), 38. https://doi.org/10.1140/epjds/s13688-018-0170-8
[6]. Binance. (2024). Binance API Documentation. https://api.binance.com/api/v3/klines
Cite this article
Li,X. (2025). Forecasting and Anomaly Detection in Bitcoin Historical Data. Applied and Computational Engineering,139,1-9.
Data availability
The datasets used and/or analyzed during the current study will be available from the authors upon reasonable request.
Disclaimer/Publisher's Note
The statements, opinions and data contained in all publications are solely those of the individual author(s) and contributor(s) and not of EWA Publishing and/or the editor(s). EWA Publishing and/or the editor(s) disclaim responsibility for any injury to people or property resulting from any ideas, methods, instructions or products referred to in the content.
About volume
Volume title: Proceedings of the 7th International Conference on Computing and Data Science
© 2024 by the author(s). Licensee EWA Publishing, Oxford, UK. This article is an open access article distributed under the terms and
conditions of the Creative Commons Attribution (CC BY) license. Authors who
publish this series agree to the following terms:
1. Authors retain copyright and grant the series right of first publication with the work simultaneously licensed under a Creative Commons
Attribution License that allows others to share the work with an acknowledgment of the work's authorship and initial publication in this
series.
2. Authors are able to enter into separate, additional contractual arrangements for the non-exclusive distribution of the series's published
version of the work (e.g., post it to an institutional repository or publish it in a book), with an acknowledgment of its initial
publication in this series.
3. Authors are permitted and encouraged to post their work online (e.g., in institutional repositories or on their website) prior to and
during the submission process, as it can lead to productive exchanges, as well as earlier and greater citation of published work (See
Open access policy for details).
References
[1]. Almasarweh, M., & Wadi, S. (2018). ARIMA model in predicting banking stock market data. Modern Applied Science, 12(11), 309-318. https://doi.org/10.5539/mas.v12n11p309
[2]. Hochreiter, S., Schmidhuber, J., & Elvezia, C. (1997). Long short-term memory. Neural Computation, 9(8), 1735–1780. https://doi.org/10.1162/neco.1997.9.8.1735
[3]. Aditya Satrio, C. B., Darmawan, W., Nadia, B. U., & Hanafiah, N. (2021). Time series analysis and forecasting of coronavirus disease in Indonesia using ARIMA model and PROPHET. Procedia Computer Science, 179, 524-532. https://doi.org/10.1016/j.procs.2021.01.036
[4]. Ning, S., Shi, J., & Ren, M. (2022). A systematic review of machine learning in cryptocurrency market forecasting. Expert Systems with Applications, 202, 117200. https://doi.org/10.1016/j.eswa.2022.117200
[5]. Parino, F., Beiró, M. G., & Gauvin, L. (2018). Analysis of the Bitcoin blockchain: Socio-economic factors behind the adoption. EPJ Data Science, 7(1), 38. https://doi.org/10.1140/epjds/s13688-018-0170-8
[6]. Binance. (2024). Binance API Documentation. https://api.binance.com/api/v3/klines