


1. Introduction
Electrocardiogram (ECG) classification can efficiently identify diseases such as arrhythmia, myocardial ischemia and myocardial infarction, thus enabling early diagnosis and timely treatment of the diseases, which is of great value in medical diagnosis [1]. The accuracy and reliability of ECG classification techniques are directly related to the efficiency of clinical diagnosis, so they have far-reaching social significance in the medical field.
Under the continuous development of artificial intelligence technology, the research on ECG classification has made significant progress [2]. Artificial intelligence methods consist of two main categories: the first is through traditional machine learning algorithms such as Support Vector Machines (SVM), Random Forests (RF), and Plain Bayes (NB) [3], Combination of extracted time domain features, frequency domain features and wavelet features of ECG to construct a classification model[4]. Wang Guanjun et al[5] concluded that the SVM algorithm was significantly better than other classification algorithms in terms of model evaluation metrics such as accuracy, recall, precision, area under the curve (AUC), etc., by conducting classification studies and performance comparisons on 21837 ECG data. Ayano et al[6] deeply analyzed multiple ECG signal recording datasets and systematically evaluated the feasibility of Interpretable Machine Learning (IML) models to provide solid evidence support for cardiac diagnosis. The second category is deep learning methods mainly based on neural networks. For example, convolutional neural networks can effectively extract morphological features of ECG[7], while long and short-term memory networks and gated loop units can mine temporal correlation information of ECG[8]. Wang Dong et al[9] proposed a cross-patient ECG feature wave detection method combining convolutional neural network and Transformer, which significantly improved the performance of ECG classification. Cha Xingzeng et al[10] did pre-training based on a lightweight convolutional neural network model to achieve early classification identification and prediction of high-risk ECG signals from cardiac arrests.
Conventional machine learning algorithms usually rely on hand-designed feature extraction methods in conjunction with traditional analysis methods to identify abnormal patterns in ECG. However, these methods are weak against noise, and there is no specialized mechanism to deal with noise in ECG data [11]. When the ECG data is disturbed by noise, the accuracy of feature extraction will be affected, which in turn leads to inaccurate classification results and increases the risk of misdiagnosis and omission. In contrast, deep learning models have the capability to automatically extract complex features from ECG signals, so as to enhance the accuracy and reliability of classification tasks. However, these models typically demand substantial computational resources and time for training. Moreover, they are susceptible to overfitting, particularly when the volume of available data is limited[12].
Based on the above analysis, we propose a method for machine learning ECG prediction combined with wavelet transform noise reduction. Specifically, we first perform wavelet transform noise reduction on ECG signals, and then input the noise reduced signals into a traditional machine learning algorithm for classification. This approach not only retains the advantages of traditional machine learning algorithms, such as high computational efficiency and model interpretability, but also effectively handles the noise problem through the preprocessing step, which further improves classification performance.
2. Method
2.1. Wavelet Transform Noise Reduction
The wavelet transform is a mathematical tool for decomposing a signal into its different frequency components, \( ψ(t)∈{L^{2}}(R) \) , If meet the condition
(1)
That is, a wavelet mother function or fundamental wavelet, where \( Ψ(ω) \) is the Fourier transform of \( ψ(t) \) . This wavelet function is operated by scaling and translation to obtain a wavelet basis function determined by the scale factor and translation factor:
(2)
Where a is the scale factor, \( τ \) is the translation factor. The wavelet transform of the signal x(t) is obtained by inner product of the signal x(t) with the wavelet basis function:
(3)
The wavelet transform decomposes the signal into a low-frequency part and a high-frequency part, in which the low-frequency part mainly displays the overall trend of the signal, while the high-frequency component captures the details of the signal and transient changes. The core idea of wavelet transform noise reduction is to use the different performance of the signal and noise in the wavelet domain to distinguish and remove the noise by thresholding[13].
2.1.1. Thresholding
Thresholding is a key step in wavelet noise reduction, and its step is to process the wavelet coefficients decomposed from the signal to remove the noise coefficients and thus achieve noise reduction. The principle of threshold noise reduction is to set a critical threshold value \( λ \) , If the wavelet coefficient is less than \( λ \) , it is thought to be mainly resulted from noise and can be removed; if greater than \( λ \) , it can be considered to be mainly caused by signal and reserve it. The common threshold value is:
(4)
(5)
MAD is the median value of the wavelet coefficient amplitude for all high frequency subbands.
However, the traditional threshold selection method does not consider the effect of the decomposition scale, and the size of the threshold should decrease with the increase of the decomposition scale[14]. Therefore, a more accurate and easily implemented threshold selection method is used instead:
(6)
Where \( α \) is the standard deviation of Gaussian white noise, N is the signal length, j as a decomposition scale.
Once the threshold is determined, the wavelet coefficients \( ω \) can be subjected to thresholding. Common thresholding methods include hard thresholding and soft thresholding:
Hard thresholding is to set to zero the wavelet coefficients that are less than \( λ \) and keep the original value for those that are greater than \( λ \) . The function is expressed as
(7)
Soft thresholding is based on hard thresholding, and wavelet coefficients greater than the threshold are "contracted", i.e., they are all subtracted from the threshold, so that the function curve becomes continuous. The function is expressed as
(8)
2.1.2. Wavelet Reconstruction
Wavelet reconstruction is the process of reassembling the processed wavelet coefficients into a signal. At each layer of reconstruction, the approximate coefficients from the previous layer are upsampled and filtered through the low-pass filter p0, while the corresponding detail coefficients are upsampled and filtered through the high-pass filter p1, and then the two are summed. This process is carried out layer by layer upwards until the resolution of the original signal is restored:
(9)
The reconstruction processing diagram is shown in Figure 1.
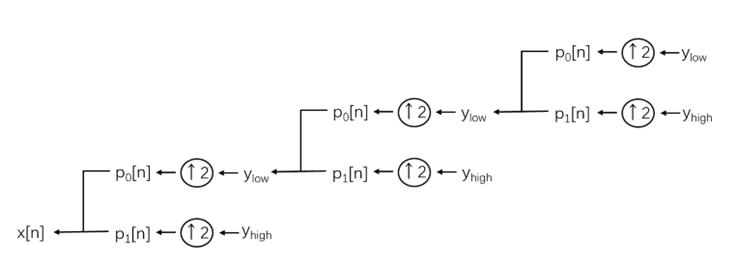
Figure 1: Structural diagram of signal reconstruction.
Through this layer-by-layer reconstruction, the global features and local details of the signal are gradually integrated, ultimately achieving an accurate reconstruction of the signal after noise reduction.
2.2. Random Forest
Random Forest (RF) can improve the predictive accuracy and robustness of a model by generating several decision trees and aggregating the predictions. The process of constructing RF mainly includes the following steps:
A decision tree is generated with the sample set obtained from the sampling, and at each node generated, d features are selected randomly and without repetition, and these d features are used to divide the sample set separately. Afterwards, the Gini coefficient is used to measure the purity gain under different divisions and the optimal features are selected for splitting. A smaller value of Gini coefficient indicates a higher purity of the dataset. For a dataset containing c categories, the Gini coefficient is
(10)
Where is the proportion of samples belonging to category i in the data set.
Repeat the above operation to form a random forest of the generated T decision trees, ensuring that each tree grows as much as it can and there is no pruning process. The more decision trees, the better the performance of the model, as more trees can better capture the features of the data, which improves the accuracy of the predictions and generalization ability computational cost increases. However, an increase in the number of trees also increases the computational cost, so a balance needs to be found between performance and computational cost. The impact of different numbers of decision trees on model performance is assessed through cross-validation, starting with a smaller number of trees and gradually increasing to a larger number and observing the average performance of the model. A more reasonable number of trees is considered to have been found when the performance improvement levels off.
For classification tasks, commonly used combining strategy is the voting method. Absolute majority voting is a type of voting method, which is based on the principle that if a mark receives more than half of the votes, the prediction is made for that category, otherwise the prediction is rejected, and the formula is expressed as
(11)
The intrinsic mechanism of random forests is mainly in its randomness and integration. Randomness comes from sample randomness and feature randomness, which makes each decision tree different and increases the diversity of the model. Integration is reflected in the combination of the prediction results of multiple decision trees through voting or averaging, which effectively reduces the variance of the model and improves the stability and accuracy of the model.
2.3. Smote
The SMOTE algorithm is an oversampling technique for dealing with unbalanced datasets, which balances the dataset by generating new minority class samples instead of simply copying the existing minority class samples, thus avoiding the overfitting problem associated with simple copying[15]. The core idea of the SMOTE algorithm is to increase the sample number by selecting one of its k nearest neighbors for each minority class sample, and then randomly generating new sample points between these two samples.
Firstly, calculating the distance between a minority sample and others minority samples using the Euclidean distance formula to get its k-nearest neighbors. The distance between two instance points in the feature space reflects the similarity between the two instance points, which can be calculated here by formula 12.
(12)
The first K samples are selected as K nearest neighbors based on distance sorted from smallest to largest.
Thereafter, a sampling ratio is set to determine the sampling multiplier N based on the sample imbalance ratio. For each randomly selected nearest neighbors \( {x_{n}} \) , respectively, with the original sample to synthesize a new sample according to the following formula, thus increasing the number of minority class samples.
(13)
3. Experiment
3.1. Experimental Hardware and Software Environment
This experiment was conducted on a workstation equipped with an NVIDIA GeForce RTX 3090 GPU with 10496 CUDA cores, 24GB of video memory, Python 3.12 as the programming language, and PyCharm 2023.2 as the development environment.
3.2. Data Presentation and Processing Methods
3.2.1. Data Set Noise Reduction
The dataset used for the experiment was the MIT-BIH arrhythmia database[16]. It contains 48 dual-channel ECG recordings, each of which is 30 minutes long and has a sampling frequency of 360 Hz. The dataset contains 41 normal heartbeats and a variety of arrhythmia types, such as premature ventricular beats and premature atrial beats. To ensure the quality of the signal, we first performed noise reduction on the raw ECG signal before further analysis. The noise reduction method employed a wavelet transform-based denoising technique, using the Daubechies 5 (db5) wavelet basis function to decompose the signal in 9 layers and thresholding by soft thresholding. Comparison of ECG signals before and after wavelet noise reduction shows that the noise reduction process effectively removes high frequency noise and baseline drift from the ECG signals, while preserving the main features of the signals.
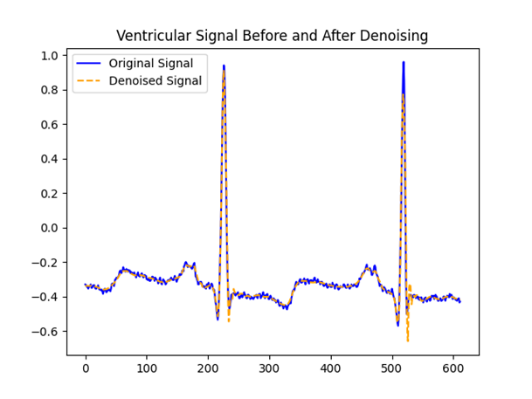
Figure 2: ECG waveforms before and after wavelet transform noise reduction.
As can be seen in Figure 2, the signal is smoother after noise reduction and the peak of the R-wave is more obvious, which is helpful for the next step of reading the cardiac beat signal. The reading of the beat-to-beat signal is a key step in the analysis of ECG signals, and the localization of the R-point, which is the highest point of the QRS cluster in the ECG signal and usually corresponds to the peak of ventricular depolarization, is the core task in this process. Due to its large amplitude and ease of identification, the R-point is often used as a reference point for beat-to-beat segmentation, and the beat-to-beat labels in the MIT-BIH Arrhythmia Database indicate not only the location of the R-point, but also the types of R-points, of which there are 19 types.
Table 1: R Dim Sum Shoot Tag.
N | Normal beat | L | Left bundle branch block beat | R | Right bundle branch block beat |
a | Aberrated atrial premature beat | V | Premature ventricular contraction | F | Fusion of ventricular and normal beat |
J | Nodal (junctional) premature beat | A | Atrial premature contraction | S | Premature or ectopic supraventricular beat |
E | Ventricular escape beat | j | Nodal (junctional) escape beat | / | Paced beat |
Q | Unclassifiable beat | | | Isolated QRS-like artifact | B | Left or right bundle branch block |
? | Learning | e | Atrial escape beat | n | Supraventricular escape beat |
f | Fusion of paced and normal beat | R | R-on-T premature ventricular contraction | ||
These labels reflect the type of heart beat and the type of arrhythmia. Therefore, by identifying the type of R-point, the type of ECG and the presence of arrhythmia can be initially determined. According to the AAMI criteria, the 19 heart beat signals above can be classified into 5 major categories.
Table 2: Heartbeat Classification.
Category | subcategory |
N | Nfe/jnBLR |
S | SAJa |
V | VEr |
F | F |
Q | Q? |
3.2.2. Data Set Equalization
We find that there is a significant imbalance in the number of samples of different classes in the original dataset, the model may tend to learn the features of the majority class during the training process while ignoring the features of the minority class, which leads to a poorer classification of the minority class and thus reduces the overall generalization ability of the model, and the phenomenon of overfitting may occur.
In order to alleviate the category imbalance problem, we interpolate the minority category samples to generate new synthetic samples by oversampling, thus increasing the number of minority category samples and equalizing the number of samples in each category. Differentiating from others, this experiment uses a combination of SMOTE and ADASYN. Priority is given to using SMOTE to generate synthetic samples, and if SMOTE is unable to generate synthetic samples due to too few minority class samples or distributional problems, anomalies are captured and ADASYN is used to generate synthetic samples. This combination results in more even and diverse samples being generated and better reflects the true distribution of the minority class samples. In addition, the combination of SMOTE and ADASYN can effectively avoid data balancing failures due to too few samples or distribution problems, ensuring the stability of the training process. After the oversampling process, we successfully increase the number of minority class samples to a level similar to that of the majority class samples, thus alleviating the class imbalance problem.
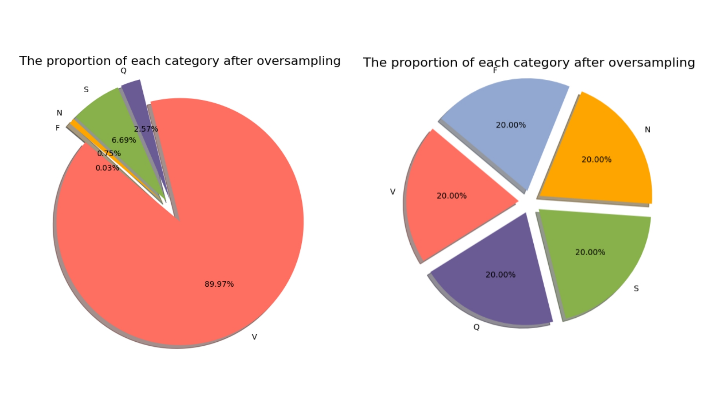
Figure 3: Percentage of each category before and after oversampling.
3.3. Comparison Experiment
In this study, we conducted comparative experiments on three different machine learning algorithms to evaluate their performance on specific datasets. The comparison indicators and data are shown in Table 3.
Table 3: Indicators for each algorithm.
Indicators | Random Forest | XGBOOST | SVM |
Accuracy | 98.66% | 98.22% | 97.85% |
Precision | 98.59% | 98.13% | 97.67% |
Recall | 98.66% | 98.22% | 97.85% |
F1 Score | 98.60% | 98.10% | 97.71% |
The data in the table shows that Random Forest outperforms XGBoost and SVM in all four evaluation metrics, demonstrating its significant advantage in this task. Specifically, Random Forest has the highest accuracy and recall, both reaching 98.66%, which is significantly better than the other two algorithms. The high accuracy and precision of Random Forest shows that the Random Forest algorithm can more accurately distinguish different classes of heart beat signals, and also has higher accuracy in predicting positive examples, while the high recall and F1 score also reduces the possibility of misjudgment, and is better able to identify all the positive example samples and reduces the risk of missed judgement. In addition, the high F1 score demonstrates that Random Forest strikes a better balance between precision and recall, and achieves optimal overall performance.
3.4. Hyperparameter Selection
Hyperparameters are parameters that need to be set before the training of a machine learning model, which will directly affect the structure, training process and final performance of the model. The purpose of hyperparameter tuning is to find a set of optimal hyperparameter combinations to optimize the performance of the model on the validation or test set. Through cross-validation, the final hyperparameters for this experiment are selected as
Table 4: Hyperparameter selection.
parameter | value |
n_estimators | 200 |
max_depth | None |
min_samples_split | 2 |
min_samples_leaf | 1 |
3.5. Ablation Experiment
In this study, we verify the contribution of wavelet transform noise reduction and oversampling to the model performance through the ablation method.
Table 5: Changes in indicators during ablation experiments.
Accuracy | Precision | Recall | F1 Score | |
Complete method | 98.63% | 98.57% | 98.63% | 98.57% |
Remove wavelet transform noise reduction | 98.60% | 98.54% | 98.60% | 98.53% |
Remove wavelet transform noise reduction and oversampling | 98.22% | 98.16% | 98.22% | 98.07% |
The data in the Table 5 show that the complete method reaches the highest value in all indicators, indicating that the combination of wavelet transform noise reduction and oversampling can significantly improve the classification performance of the model. After removing the wavelet transform noise reduction, the performance of the model decreases slightly, indicating that the wavelet transform noise reduction contributes to the enhancement of the model performance, but its effect is relatively small, probably because the oversampling method compensates for the effect of noise on the model to some extent. The significant decrease in the performance of the model after removing both wavelet transform noise reduction and oversampling indicates that the oversampling method plays a key role in the enhancement of the model performance. After removing oversampling, the model's ability to recognize a few classes of samples decreases significantly, leading to a reduction in overall performance.
The experimental results show that the complete method outperforms the model with the key step removed in all the indexes, verifying the effectiveness of the wavelet transform noise reduction and oversampling methods in the task of ECG signal classification.
4. Conclusion
In this study, based on the MIT-BIH arrhythmia database, we propose a random forest ECG signal classification method combining wavelet transform noise reduction and oversampling techniques, aiming at solving the problems of noise interference and category imbalance in ECG signals. Through wavelet transform noise reduction, we effectively remove the high-frequency noise and baseline drift in the signal; meanwhile, the oversampling method combining SMOTE and ADASYN significantly alleviates the data imbalance problem and equalizes the number of samples from a few categories. The experiments use four indicators, namely, accuracy, precision, recall and F1 score, to evaluate the model performance, and the results show that the random forest algorithm outperforms the support vector machine (SVM) and XGBoost in all the indicators, with an accuracy of 98.66%, a precision of 98.59%, a recall of 98.66% and an F1 score of 98.60%.The results of the ablation experiments show that the complete method significantly outperforms the model with the removal of the key steps in all indicators, with the accuracy rate falling to 98.60% after removing the wavelet transform noise reduction, while the accuracy rate further falls to 98.22% after removing the wavelet transform noise reduction and oversampling, which fully proves the important role of the wavelet transform noise reduction and oversampling in enhancing the performance of the model. In future research, we can consider expanding more arrhythmia types and verifying the generalization ability of the model on a larger dataset.
References
[1]. Sathi T A, Jany R, Ela R Z, et al. An interpretable electrocardiogram-based model for predicting arrhythmia and ischemia in cardiovascular disease[J]. Results in Engineering, 2024, 24: 103381.
[2]. Liu J, Li Z, Jin Y, et al. A review of arrhythmia detection based on electrocardiogram with artificial intelligence[J]. Expert review of medical devices, 2022, 19(7): 549-560.
[3]. Charoenpong J, Pimpunchat B, Amornsamankul S, et al. A Comparison of Machine Learning Algorithms and their Applications[J]. International Journal of Simulation--Systems, Science & Technology, 2019, 20(4).
[4]. Gondowijoyo S M, Setiawan R, Hikmah N F. Applying artificial neural network on heart rate variability and electroencephalogram signals to determine stress[J]. TELKOMNIKA (Telecommunication Computing Electronics and Control), 2024, 22(4): 910-920.
[5]. Wang Guanjun, Wu Ting, Wang Long, et al. Study on electrocardiogram diagnosis based on Machine learning[J]. Journal of Practical Electrocardiology, 2020, 29(4).
[6]. Ayano Y M, Schwenker F, Dufera B D, et al. Interpretable machine learning techniques in ECG-based heart disease classification: a systematic review[J]. Diagnostics, 2022, 13(1): 111.
[7]. Zahid M U, Kiranyaz S, Gabbouj M. Global ECG classification by self-operational neural networks with feature injection[J]. IEEE Transactions on Biomedical Engineering, 2022, 70(1): 205-215.
[8]. Ramachandran D, Kumar R S, Alkhayyat A, et al. Classification of Electrocardiography Hybrid Convolutional Neural Network‐Long Short Term Memory with Fully Connected Layer[J]. Computational Intelligence and Neuroscience, 2022, 2022(1): 6348424.
[9]. Wang D, Qiu L, Zhu W, et al. Inter-patient ECG characteristic wave detection based on convolutional neural network combined with transformer[J]. Biomedical Signal Processing and Control, 2023, 81: 104436.
[10]. Cha X, Zhang Y, Zhang Y, et al. [Early classification and recognition algorithm for sudden cardiac arrest based on limited electrocardiogram data trained with a two-stages convolutional neural network]. Sheng Wu Yi Xue Gong Cheng Xue Za Zhi. 2024 Aug 25;41(4):692-699. Chinese. doi: 10.7507/1001-5515.202306066. PMID: 39218594; PMCID: PMC11366462.
[11]. Tang Xiao, Tang Li, Mo Zhiwen. ECG classification strategy based on support vector Machine algorithm[J]. Journal of Biomedical Engineering, 2008, 25(2): 246-249.
[12]. Fila R J J B, Attri S H, Sharma V. Mitigating Overfitting in Deep Learning: Insights from Bayesian Regularization[C]//2024 IEEE Region 10 Symposium (TENSYMP). IEEE, 2024: 1-6.
[13]. Feng Yi, Wang Xianghua. Wavelet transform noise reduction processing and its Matlab implementation [J]. Data Acquisition and Processing,2006,21(B12):37-39
[14]. Chen Xiaoxi; Wang Yanjie; Liu Xiang. An in-depth study of wavelet threshold denoising method. Laser and infrared.2012(01):107-112
[15]. complexity analysis[J]. IEEE Transactions on Knowledge and Data Engineering, 2022, 35(7): 6651-6672.
[16]. https://physionet.org/content/mitdb/1.0.0/
Cite this article
Li,Y. (2025). Research on ECG Classification Algorithm Based on Wavelet Transform Noise Reduction and Random Forest. Applied and Computational Engineering,146,33-42.
Data availability
The datasets used and/or analyzed during the current study will be available from the authors upon reasonable request.
Disclaimer/Publisher's Note
The statements, opinions and data contained in all publications are solely those of the individual author(s) and contributor(s) and not of EWA Publishing and/or the editor(s). EWA Publishing and/or the editor(s) disclaim responsibility for any injury to people or property resulting from any ideas, methods, instructions or products referred to in the content.
About volume
Volume title: Proceedings of SEML 2025 Symposium: Machine Learning Theory and Applications
© 2024 by the author(s). Licensee EWA Publishing, Oxford, UK. This article is an open access article distributed under the terms and
conditions of the Creative Commons Attribution (CC BY) license. Authors who
publish this series agree to the following terms:
1. Authors retain copyright and grant the series right of first publication with the work simultaneously licensed under a Creative Commons
Attribution License that allows others to share the work with an acknowledgment of the work's authorship and initial publication in this
series.
2. Authors are able to enter into separate, additional contractual arrangements for the non-exclusive distribution of the series's published
version of the work (e.g., post it to an institutional repository or publish it in a book), with an acknowledgment of its initial
publication in this series.
3. Authors are permitted and encouraged to post their work online (e.g., in institutional repositories or on their website) prior to and
during the submission process, as it can lead to productive exchanges, as well as earlier and greater citation of published work (See
Open access policy for details).
References
[1]. Sathi T A, Jany R, Ela R Z, et al. An interpretable electrocardiogram-based model for predicting arrhythmia and ischemia in cardiovascular disease[J]. Results in Engineering, 2024, 24: 103381.
[2]. Liu J, Li Z, Jin Y, et al. A review of arrhythmia detection based on electrocardiogram with artificial intelligence[J]. Expert review of medical devices, 2022, 19(7): 549-560.
[3]. Charoenpong J, Pimpunchat B, Amornsamankul S, et al. A Comparison of Machine Learning Algorithms and their Applications[J]. International Journal of Simulation--Systems, Science & Technology, 2019, 20(4).
[4]. Gondowijoyo S M, Setiawan R, Hikmah N F. Applying artificial neural network on heart rate variability and electroencephalogram signals to determine stress[J]. TELKOMNIKA (Telecommunication Computing Electronics and Control), 2024, 22(4): 910-920.
[5]. Wang Guanjun, Wu Ting, Wang Long, et al. Study on electrocardiogram diagnosis based on Machine learning[J]. Journal of Practical Electrocardiology, 2020, 29(4).
[6]. Ayano Y M, Schwenker F, Dufera B D, et al. Interpretable machine learning techniques in ECG-based heart disease classification: a systematic review[J]. Diagnostics, 2022, 13(1): 111.
[7]. Zahid M U, Kiranyaz S, Gabbouj M. Global ECG classification by self-operational neural networks with feature injection[J]. IEEE Transactions on Biomedical Engineering, 2022, 70(1): 205-215.
[8]. Ramachandran D, Kumar R S, Alkhayyat A, et al. Classification of Electrocardiography Hybrid Convolutional Neural Network‐Long Short Term Memory with Fully Connected Layer[J]. Computational Intelligence and Neuroscience, 2022, 2022(1): 6348424.
[9]. Wang D, Qiu L, Zhu W, et al. Inter-patient ECG characteristic wave detection based on convolutional neural network combined with transformer[J]. Biomedical Signal Processing and Control, 2023, 81: 104436.
[10]. Cha X, Zhang Y, Zhang Y, et al. [Early classification and recognition algorithm for sudden cardiac arrest based on limited electrocardiogram data trained with a two-stages convolutional neural network]. Sheng Wu Yi Xue Gong Cheng Xue Za Zhi. 2024 Aug 25;41(4):692-699. Chinese. doi: 10.7507/1001-5515.202306066. PMID: 39218594; PMCID: PMC11366462.
[11]. Tang Xiao, Tang Li, Mo Zhiwen. ECG classification strategy based on support vector Machine algorithm[J]. Journal of Biomedical Engineering, 2008, 25(2): 246-249.
[12]. Fila R J J B, Attri S H, Sharma V. Mitigating Overfitting in Deep Learning: Insights from Bayesian Regularization[C]//2024 IEEE Region 10 Symposium (TENSYMP). IEEE, 2024: 1-6.
[13]. Feng Yi, Wang Xianghua. Wavelet transform noise reduction processing and its Matlab implementation [J]. Data Acquisition and Processing,2006,21(B12):37-39
[14]. Chen Xiaoxi; Wang Yanjie; Liu Xiang. An in-depth study of wavelet threshold denoising method. Laser and infrared.2012(01):107-112
[15]. complexity analysis[J]. IEEE Transactions on Knowledge and Data Engineering, 2022, 35(7): 6651-6672.
[16]. https://physionet.org/content/mitdb/1.0.0/