


1. Introduction
The core of risk management is to incorporate risk factors into the management process of the company and explore how to minimize their negative impact. With the socio-economic development, enterprises face more and more uncertainties, and risk management can effectively avoid or reduce the adverse effects of various uncertainties, thereby improving management efficiency and economic benefits. With self-evident importance, risk management of enterprises is not only about judgments based on the data in accounting reports, but also more importantly about identifying potential major problems though in-depth analysis. Founded in 1962 in Arkansas by American retail legend Sam Walton, Walmart Inc. is the largest private employer in the United States and the world largest chained retail enterprise. In 1991, the company's sales reached an amazing $40 billion, and a new world record of annual sales of $93.6 billion in 1995 which was almost equal to the sum of all department stores in the United States. Walmart has achieved such amazing results in just over a decade, becoming one of the most successful business empires in the world, which was both from Walmart's own efforts and the support of the outside environment. Presently, it has achieved amazing development in the United States, Germany, the United Kingdom, China, Japan, Mexico, Canada and many other countries and regions in just a few decades, which is undoubtedly a major miracle in the retail industry [1]. However, Walmart is facing increasing external risks as the market becomes more competitive and gradually exposed potential risks within the company due to its rapid development momentum. Facing with such situation, Walmart has adopted a management process that is closely integrated with the company's strategy, created jointly by the company's board of directors and management layer, with the aim of identifying potential events that may affect the company's operations and controlling the related risks within the acceptable range, so as to achieve the company's goals. Walmart's external risks include laws and regulations, political issues, and the business environment. Among them, business environment is the most prominent external risk, such as market competition and consumer preferences. And its internal risks cover strategic risk, financial risk, and operational risk.
In the context of the current economic environment, which is gradually moving towards marketization and internationalization, enterprises are undergoing more and more serious financial risk. Financial risk refers to the possibility that the financial income or expenditure of enterprises may deviate from the expected target due to various significantly impactive uncertainties. These risks are not only caused by market instability and macroeconomic conditions, but also by management strategies and operational decisions within the company. The financial risk will lead to the waste of financial resources, the decline of business results, and even bankruptcy, which may bring huge economic losses to the company. Therefore, it is particularly critical for listed companies and their stakeholders to predict and prevent financial risk. At present, despite a variety of prediction algorithms such as parallel computing, multi-level feedback, and adaptive learning, which still have limitations in practical applications, it is difficult for traditional machine learning algorithms to meet the requirements of classifying and processing large-scale financial data due to the limited size of the dataset and the high complexity of the model [2]. For instance, such algorithms often result a phenomenon known as the “black box effect,” which requires a large amount of training data, and the training process is often slow. In addition, because these algorithms usually consider only a single dimension of information, ignoring the connections between multiple dimensions, they cannot process multi-dimensional data well. And moreover, as the company's financial data is obtained through financial statements, while the financial statements themselves have strong unstructured characteristics, it is difficult for the traditional indicators-based financial early warning model to meet the real needs. Hence it is increasingly urgent to find out new prediction criteria and tools. This article will focus on combining predictive modeling techniques for marketing with financial risk management strategies. Specifically, we will study how these integrated approaches can be applied in retail to optimize marketing activities and minimize financial risk.
2. Literature Review
Retail businesses are highly dependent on accurate sales forecasting to optimize their inventory and make sound operational decisions. The classical and widely used forecasting methods include moving averages and ARIMA (AutoRegressive Integrated Moving Average), which are both univariate time-series forecasting predictive methods for future values based on the past trend. Unlike multivariate time-series forecasting, these methods are not able to acknowledge the impact by other factors such as the holiday effect, economic state or marketing promotions on the sales in the retail environment, which is extremely crucial information for business forecasting [3]. However, ARIMA is still considered to be a very useful method as it can capture trends and seasonality.
Various studies have emphasized the significant impact of external factors on retail sales forecasting. Ailawadi et al. found that holiday and promotional periods have significant impact on retail sales forecasts, with holiday weeks outperforming up to 30% than regular weeks. Additionally, economic fluctuations like high fuel prices and unemployment rate can positively or negatively affect consumer purchasing behavior. Hendry and Mizonobserved that high levels of discretionary spending will be reduced by low unemployment rates and increasing fuel prices, which leading to lower sales turnover for retailers [4]. Incorporating these factors into forecasting models, particularly retail spending forecasting, may improve the model's performance in predicting sales peaks and economic cycle variations. This integration helps to account for both internal sales fluctuations and external influences, making methods like VARMAX more applicable compared to the purely univariate ARIMA model.
While VAR and VARMAX models have been widely studied, there is a gap in their application to large-scale retail environments like Walmart [5]. Most research has focused on smaller retail operations or single product categories. Additionally, although holidays and economic factors have been commonly included in models, few studies have considered the combined effect of these factors alongside weather-related data such as temperature [6]. This thesis aims to address these gaps by applying a VARMAX model to forecast Walmart’s weekly sales while incorporating a diverse range of exogenous factors, including holidays, economic indicators, and weather conditions.
3. Data and Exploratory Analysis
Table 1: Walmart’s Weekly Sales Data from Kaggle
Store | Date | Weekly_Sales | Holiday_Flag | Temperature | Fuel_Price | CPI | Unemployment |
1 | 05-02-2010 | 16436909 | 0 | 42.31 | 2.572 | 211.0963582 | 8.106 |
1 | 12-02-2010 | 1641957.44 | 1 | 38.51 | 2.548 | 211.2421698 | 8.106 |
1 | 19-02-2010 | 1611968.17 | 0 | 39.93 | 2.514 | 211.2891429 | 8.106 |
1 | 26-02-2010 | 1409727.59 | 0 | 46.63 | 2.561 | 211.3196429 | 8.106 |
1 | 05-03-2010 | 1554806.68 | 0 | 46.50 | 2.625 | 211.3501429 | 8.106 |
1 | 12-03-2010 | 1439541.59 | 0 | 57.79 | 2.667 | 211.3806429 | 8.106 |
1 | 19-03-2010 | 1472515.79 | 0 | 54.58 | 2.720 | 211.215635 | 8.106 |
1 | 26-03-2010 | 1404429.92 | 0 | 51.45 | 2.732 | 211.0180424 | 8.106 |
1 | 02-04-2010 | 1594968.28 | 0 | 62.27 | 2.719 | 210.8204499 | 7.808 |
1 | 09-04-2010 | 1545418.53 | 0 | 65.86 | 2.770 | 210.6228574 | 7.808 |
1 | 16-04-2010 | 1466058.28 | 0 | 66.32 | 2.808 | 210.4887 | 7.808 |
1 | 23-04-2010 | 1391256.12 | 0 | 64.84 | 2.795 | 210.4391228 | 7.808 |
1 | 30-04-2010 | 1425100.71 | 0 | 67.41 | 2.780 | 210.3895456 | 7.808 |
1 | 07-05-2010 | 1603955.12 | 0 | 72.55 | 2.835 | 210.3399684 | 7.808 |
1 | 14-05-2010 | 1494251.5 | 0 | 74.78 | 2.854 | 210.3374261 | 7.808 |
1 | 21-05-2010 | 1399662.07 | 0 | 76.44 | 2.826 | 210.6170934 | 7.808 |
1 | 28-05-2010 | 1432069.95 | 0 | 80.44 | 2.759 | 210.8967606 | 7.808 |
1 | 04-06-2010 | 1615524.71 | 0 | 80.69 | 2.705 | 211.1764278 | 7.808 |
1 | 11-06-2010 | 1542561.09 | 0 | 80.43 | 2.668 | 211.4560951 | 7.808 |
1 | 18-06-2010 | 1503284.06 | 0 | 84.11 | 2.637 | 211.4537719 | 7.808 |
1 | 25-06-2010 | 1422711.6 | 0 | 84.34 | 2.653 | 211.3386526 | 7.808 |
1 | 02-07-2010 | 1492418.14 | 0 | 80.91 | 2.603 | 211.223533 | 7.787 |
1 | 09-07-2010 | 1546074.18 | 0 | 80.48 | 2.642 | 211.108414 | 7.787 |
1 | 16-07-2010 | 1448938.92 | 0 | 83.15 | 2.623 | 211.1003854 | 7.787 |
1 | 23-07-2010 | 1385065.20 | 0 | 83.36 | 2.608 | 211.2351443 | 7.787 |
1 | 30-07-2010 | 1371986.60 | 0 | 81.84 | 2.640 | 211.3699032 | 7.787 |
1 | 06-08-2010 | 1605491.78 | 0 | 87.16 | 2.627 | 211.5046621 | 7.787 |
As seen in Fig. 1, we used a data set from Kaggle that displays the weekly sales from 45 different Walmart stores across the United States. The data set starts on the week of February 5th, 2010 and ends on the week of November 1st, 2012. The data set also shows the average temperature, fuel price, CPI, and unemployment rate, as well as whether there was a holiday during that week.
The following are important insights revealed by Exploratory Data Analysis (EDA) about Walmart's weekly sales patterns and their relationship with various exogenous factors. The time-series graph of weekly sales shows significant fluctuations over time, especially during major retail periods such as Thanksgiving, Black Friday, and Christmas, when there are significant spikes in sales [7]. The graph highlights strong seasonality, where sales rise during specific weeks of the year, especially during the holiday season. In addition, sales trends remain relatively consistent overall and are accompanied by certain prolonged growth and higher sales spikes that can be attributed to holiday promotions and consumer spending behavior influenced by external factors.
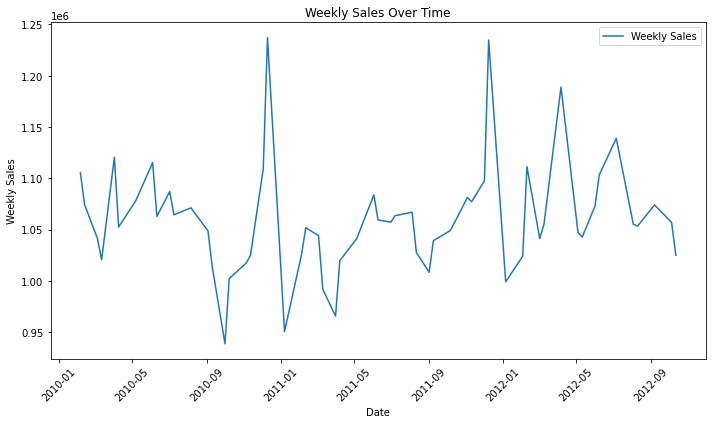
Figure 1: Walmart’s Average Weekly Sales Over Time
As shown in Fig. 2 below, Walmart’s correlation heatmap clearly demonstrates the relationship between weekly sales and other variables. Whether there’s a holiday during the week shows a moderate positive correlation with sales. Other variables such as fuel prices and CPI also show a slight positive correlation, indicating that economic conditions and fuel costs have an impact on consumer spending. Surprisingly, there is a slight negative correlation between sales and unemployment rate, suggesting that higher unemployment rate may slightly reduce sales, though this effect is not strong. Through insights extracted from the correlation matrix, the significance of sonsonal and external influences are captured which provides guidance for constructing the model.
The data set was compressed so that there was one line for every week instead of 45 lines. Simply put, weekly data across 45 stores were combined into one line. Each line would display the averages across all stores for each factor (sales number, temperature, etc). Data was preprocessed through removal of duplicates, interpolation of missing values, outlier treatment, and transformation. Feature engineering included creating lag variables and indicators for holidays and economic conditions.
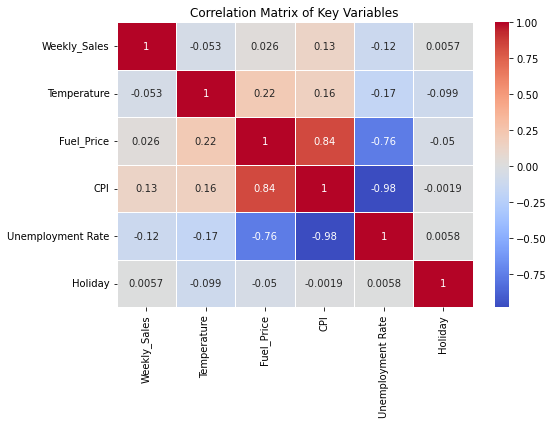
Figure 2: Walmart’s Correlation Matrix of Key Variables
4. Methodology
In this thesis, a VARMAX (Vector Autoregressive with Exogenous Factors) model is used to predict weekly sales at Wal-Mart by combining historical sales data with exogenous variables such as holidays, temperature, fuel prices, and economic indicators. The total process includes data preprocessing, feature engineering, model selection, implementation, and validation to make sure the accuracy and reliability of the predictions.
The dataset covers the years 2010 to 2012 and includes key variables,weekly sales, holidays, temperature data, the change of fuel prices, CPI (Consumer Price Index) and unemployment rate in the local area. Some missing values, such as in the temperature and fuel price section, were first coped with by linear interpolation.In addition, outliers were detected and dealt with using the interquartile range (IQR) method. Meanwhile, feature engineering was performed to enhance forecasting capabilities, creating lagged variables (e.g., sales in the previous week) and rolling averages to smooth out short-term fluctuations. Special attention was given to holidays by customizing function to measure the warm-up effect of major shopping vacation.
In terms of model selection, the VARMAX model was chosen due to its ability to handle multivariate time series data while taking into account external factors affecting sales. The optimal lag order was determined by minimizing the values of Akaike Information Criterion (AIC) and Bayesian Information Criterion (BIC). And the lag order of 3 was finally chosen, which means that the model uses the date of first three weeks to predict future sales.
The model was implemented by the statsmodels Python library. The data was scaled using MinMaxScaler to standardize all variables and ensure that characteristics in different units (e.g., sales in dollars and temperature in degrees Fahrenheit) were comparable. Exogenous variables (holidays, temperature, CPI, etc.) were included in the model along with the sales data, so the impact of these factors on sales could be considered.
The performance of the model was validated with a separate test dataset, to assess its effectiveness on unseen data. The main evaluation metrics used were Root Mean Square Error (RMSE) and Mean Absolute Percentage Error (MAPE.) The RMSE measures the average deviation between predicted and actual values, while the MAPE provides a percentage-based error metric. According to the final model,an RMSE of 18,961 and a MAPE of approximately 4%, which shows a high level of predictive precision.considering exogenous aspect,in particular vacation and fossil fuel price, played a significant role in improving reliability of prediction in the period of peak sale time.
5. Results
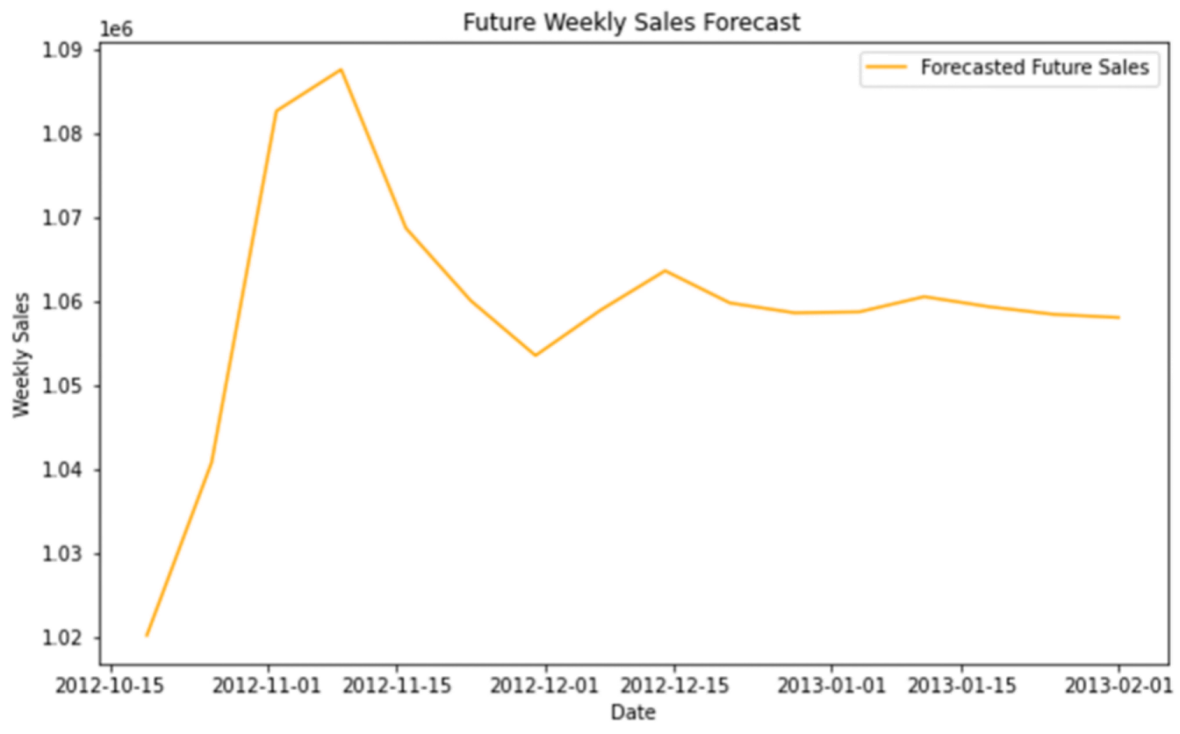
Figure 3: Future Weekly Sales Forecast Plot
The achievement of forecast about Walmart’s weekly sales use the VARMAX model that incorporate the historical sales data and external variables. After adjusting the model,RMSE of the model is 18,961, which is close to the actual weekly sales and only present minor differences. Moreover, the MAPE of the model is 4%, means that the average deviation of predicted sales from actual sales is 4%, showcasing the model’s high accuracy and suitability for real-world retail applications.
5.1. Root Mean Squared Error (RMSE) Calculation
RMSE is a commonly used metric to measure the difference between actual and predicted values. It gives the standard deviation of the residuals (prediction errors), with larger errors having a bigger impact on the metric.
Formula:
\( RMSE=\sqrt[]{\frac{1}{n}\sum _{i=1}^{n}{({y_{i}}-{y_{p}})^{2}}} \)
Where:
• \( {y_{i}} \) = Actual Sales value at time \( i \)
• \( {y_{p}} \) = Predicted sales value at time \( i \)
• \( n \) = Number of data points (weeks in this case)
5.2. Mean Absolute Percentage Error (MAPE) Calculation
MAPE expresses the prediction error as a percentage. It measures the average percentage error between predicted and actual values.
Formula:
\( MAPE=\frac{1}{n}\sum _{i=1}^{n}|\frac{{y_{i}}-{y_{p}}}{{y_{i}}}|×100 \)
Where:
• \( {y_{i}} \) = Actual Sales value at time \( i \)
• \( {y_{p}} \) = Predicted sales value at time \( i \)
• \( n \) = Number of data points
Adding exogenous variables into the model significantly raised its predictive accuracy. Among the various exogenous variables, holidays were one of the most influential factors on weekly sales, as shown in Fig. 4, where there were notable peaks for Thanksgiving, Black Friday, and Christmas. The model was able to accurately recreate these holiday-related peaks, showing its capabilities. Additionally, fuel prices and CPI also had decent impact on sales. Higher fuel prices led to slight decrease in weekly sales, reflecting changes in customer behavior. Although variables like fuel prices and CPI produced less impact compared to holidays, including them still added to the model’s overall predictive power and its ability to forecast sales during non-holiday periods.
The model also shows sensitivity to weather conditions, as evidenced by the effect of temperature on sales trends. During the weeks of persistent extreme weather, either extremely high or low temperatures, the sales seem to decrease significantly, which is captured accurately by the model. Moderate weather, by contrast, is associated with more stable sales, suggesting that shopping activity can be encouraged by favorable conditions.
To assess the effectiveness of the VARMAX model, we compared its performance to simpler forecasting models such as ARIMA and Exponential Smoothing. The results show that the performance of VARMAX model is significantly better than these models. For example, the RMSE and MAPE of ARIMA model are 34,500 and 8%, while the Exponential Smoothing model has the values with RMSE of 28,000 and a MAPE of 6.5%. Due to the inability to integrative exogenous variables, both of the two models perform poorly as they are less capable of capturing external influences such as holidays and economic conditions. The forecasts of VARMAX model are more accurate and reliable as it is able to account for the interactions between sales and external factors.
6. Conclusion and Discussion
In this paper, using the VARMAX method to establish a weekly sales forecasting model for Walmart by combining historical sales data and external factors like holidays, temperature, fuel prices, CPI, and unemployment rates. The model achieved an RMSE of 18,961 and MAPE of 4%, better than simpler models like ARIMA and Exponential Smoothing. This model can effectively capture the impact of holidays and economic conditions on sales, especially during seasonal peaks and extreme weather weeks, its accuracy in predicting sales patterns is demonstrated.
The model can be directly applied to retail operations, especially for large chains like Walmart. Accurate sales forecasting is critical for optimizing inventory, staffing, and promotional activities. It can help retailers manage peak demand and avoid excess inventory of shortages. By incorporating external factors such as fuel prices and CPI, the model can be used for a broader range of retailers and industries, such as food, clothing, and electronics, which sales are sensitive to economic and environmental factors.
6.1. Future Improvements
While the model performed well, there are several way to improve it further. Integrating more granular data, such as store-level promotions or regional economic conditions, can improve forecasting accuracy, especially during short-term sales peak resulting by promotions. In industries that weather has significantly influences on shopping behavior, integrating real-time weather forecasts could also help the model respond to changing conditions has. Additionally, the model’s handling non-linear relationships can be improved by using machine learning techniques such as LSTM (Long Short-Term Memory) models, so the model is able to capture complex dependencies and improve accuracy during periods of extreme sales volatility such as major product launches or economic abrupt changes. Lastly, advanced hyperparameter tuning techniques, such as Bayesian Optimization or GridSearchCV can be used to further refine the lag structure and model parameters, to make the forecasting process more efficient and precise.
6.2. Wider Implications
The findings of this thesis have significant implications for the retail industry and demand forecasting. Retailers are face increasing challenges due to the volatility of consumer behavior and the influence of external factors like holidays and economic changes. Accurate forecasting models (the one developed in this paper) can help manage supply chains and reduce costs, it also can improve customer satisfaction by ensuring product flow. In addition, this model provides a framework can expand sales forecasting beyond retail, with wide range of potential applications in industries such as hospitality, energy, and e-commerce. By incorporating external factors, businesses across industries can make more informed decisions and better cope with uncertainties. In conclusion, the VARMAX model provides a reliable solution for forecasting Walmart's weekly sales, while capturing both regular and extreme demand shifts. Although the model performed well, its accuracy and broader applicability can be further increased by future improvements—such as integrating more granular data and advanced techniques increase, making it a valuable tool for improving operational efficiency in retail and other industries.
Acknowledgments
This work was intellectually supported by Professor Cosimo Arnesano of University of Southern California.
References
[1]. Box, G. E., & Jenkins, G. M. (1970). "Time Series Analysis: Forecasting and Control." Holden-Day.
[2]. Ailawadi, K. L., Gedenk, K., Lutzky, C., & Neslin, S. A. (2009). "Decomposition of the 2sales impact of promotion-induced stockpiling." Journal of Marketing Research, 46(3), 450-462.
[3]. Hendry, D. F., & Mizon, G. E. (1993). "Evaluating dynamic models by encompassing the VAR." Econometrica, 61(4), 989-1002.
[4]. Ashuri, B. , & Mostaan, K. . (2015). State of private financing in development of highway projects in the united states. Journal of Management in Engineering, 04015002.
[5]. Kumar, L. , Jindal, A. , Velaga, N. R. , & Hayashi, Y. . (2018). Financial risk assessment and modelling of ppp based indian highway infrastructure projects.
[6]. Akintoye, A. S. , & Macleod, M. J. . (1997). Risk analysis and management in construction. International Journal of Project Management, 15(1), 31-38.
[7]. Au, S. K. , Wang, Z. H. , & Lo, S. M. . (2007). Compartment fire risk analysis by advanced monte carlo simulation. Engineering Structures, 29(9), 2381-2390.
Cite this article
Chau,O.;Liu,J. (2025). Forecasting Walmart Store Weekly Sales Using Vector Autoregression with Exogenous Factors. Applied and Computational Engineering,134,79-88.
Data availability
The datasets used and/or analyzed during the current study will be available from the authors upon reasonable request.
Disclaimer/Publisher's Note
The statements, opinions and data contained in all publications are solely those of the individual author(s) and contributor(s) and not of EWA Publishing and/or the editor(s). EWA Publishing and/or the editor(s) disclaim responsibility for any injury to people or property resulting from any ideas, methods, instructions or products referred to in the content.
About volume
Volume title: Proceedings of the 5th International Conference on Signal Processing and Machine Learning
© 2024 by the author(s). Licensee EWA Publishing, Oxford, UK. This article is an open access article distributed under the terms and
conditions of the Creative Commons Attribution (CC BY) license. Authors who
publish this series agree to the following terms:
1. Authors retain copyright and grant the series right of first publication with the work simultaneously licensed under a Creative Commons
Attribution License that allows others to share the work with an acknowledgment of the work's authorship and initial publication in this
series.
2. Authors are able to enter into separate, additional contractual arrangements for the non-exclusive distribution of the series's published
version of the work (e.g., post it to an institutional repository or publish it in a book), with an acknowledgment of its initial
publication in this series.
3. Authors are permitted and encouraged to post their work online (e.g., in institutional repositories or on their website) prior to and
during the submission process, as it can lead to productive exchanges, as well as earlier and greater citation of published work (See
Open access policy for details).
References
[1]. Box, G. E., & Jenkins, G. M. (1970). "Time Series Analysis: Forecasting and Control." Holden-Day.
[2]. Ailawadi, K. L., Gedenk, K., Lutzky, C., & Neslin, S. A. (2009). "Decomposition of the 2sales impact of promotion-induced stockpiling." Journal of Marketing Research, 46(3), 450-462.
[3]. Hendry, D. F., & Mizon, G. E. (1993). "Evaluating dynamic models by encompassing the VAR." Econometrica, 61(4), 989-1002.
[4]. Ashuri, B. , & Mostaan, K. . (2015). State of private financing in development of highway projects in the united states. Journal of Management in Engineering, 04015002.
[5]. Kumar, L. , Jindal, A. , Velaga, N. R. , & Hayashi, Y. . (2018). Financial risk assessment and modelling of ppp based indian highway infrastructure projects.
[6]. Akintoye, A. S. , & Macleod, M. J. . (1997). Risk analysis and management in construction. International Journal of Project Management, 15(1), 31-38.
[7]. Au, S. K. , Wang, Z. H. , & Lo, S. M. . (2007). Compartment fire risk analysis by advanced monte carlo simulation. Engineering Structures, 29(9), 2381-2390.