


1. Literature Review
Wu et al. [1] established a BP-ANN model with 15 independent variables to predict disease status. The results showed that the differences between patients with and without sexually transmitted diseases in 10 factors were statistically significant. The optimal BP-ANN network structure was 15-7-1, with 7 neurons in the hidden layer, achieving the best prediction results. The training accuracy, validation accuracy, and testing accuracy were 93.94%, 88.48%, and 89.60%, respectively. Wang et al. [2] applied ANN and logistic regression to establish hypertension prediction models, evaluating the models’ performance using ROC analysis. The results showed that the sensitivity, specificity, Youden index, and consistency of the ANN prediction model were superior to those of the logistic regression model. Fan et al. [3] designed a classification system based on a BP training algorithm with custom network structure and other parameters. The system was trained and classified using actual disease sample data, and the results indicated that the system had good classification performance, making it suitable for guiding the diagnosis and treatment of depression. Qian et al. [4] used BPNN, univariate, and multivariate unconditional logistic regression methods. The results showed that the BPNN network structure was 54-1, with no hidden layer. The BPNN network, univariate logistic regression, and multivariate unconditional logistic regression methods selected 35, 29, and 10 factors influencing the occurrence of DM complications, respectively. A comparison of the results showed that the BPNN selected factors included all those identified by multivariate logistic regression and correctly reflected the magnitude and direction of their effects. Ren et al. [5] proposed a hypertension prediction model based on artificial neural networks. This model introduced batch normalization layers and residual connections to improve the defects of the original ANN model. The dataset consisted of 12 basic variables and 1 target variable. Experiments showed that this model had a significantly faster convergence rate than the original model, effectively accelerating the training process. Gao et al. [6] used a BP network as the fitting model, with a network structure of 22-6-1, to analyze the mean influence values (MIV) of various potential risk factors for diabetes, ranking the factors by the absolute values of the MIV, and comparing the results with logistic regression model analysis. A logarithmic linear model was used to analyze the interactions between factors. The NN was capable of performing disease risk factor analysis and could fit more complex variable relationships than traditional models. Ma and Tian [7] established a BP neural network model for predicting the incidence of non-stationary cardiomyopathy. The resulting BP neural network model for predicting non-stationary cardiomyopathy incidence, with 4 input units, 1 output unit, and 11 hidden units, achieved satisfactory results, with maximum relative error and average error both lower than traditional prediction models. Ma [8] applied artificial neural network methods, using operations such as missing value treatment, data transformation, and discretization, to preprocess the data. The optimized BP artificial neural network-based prediction model achieved an accuracy of 73.4%, sensitivity of 72.7%, specificity of 69.3%, and an area under the ROC curve of 0.731. The model’s performance was better than that of logistic regression, decision tree, and support vector machine models. Shen, Zhu, and Hu [9] applied an improved U-net algorithm to segment the lesion sites of lung cancer, then used PCA to extract features, which were categorized as morphological, intensity, grayscale, and texture features. BP neural networks were used for classification, achieving an overall accuracy of 91.13%. Sun et al. [10] used a BP algorithm-based multilayer feedforward network model and the function approximation capabilities of artificial neural networks to establish a function mapping relationship from input to output. The results showed that the model effectively reflected the system’s dynamics and the time-series correlation of the data. The application of the model to lung cancer diagnosis data showed a correct detection rate of 96.2% for lung cancer patients, with a misdiagnosis rate of 3.8%, and a correct detection rate of 88% for non-lung cancer patients, with a misdiagnosis rate of 12%. Zhen, Xie, and Zeng [11] applied BP artificial neural network principles, using 8 sensitive indicators for rheumatoid arthritis as input data for the BP artificial neural network, to train and predict the samples. The results showed that the correct rate for the training set was 97.4%, and for the prediction set, it was 91.9%. Finally, Fan et al. [12] identified key osteoarthritis genes from differential genes using Lasso regression models, support vector machine models, and random forest tree models. After screening the results from the three machine learning methods and taking their intersection, they identified 5 key genes for diagnosing osteoarthritis. The artificial neural network model built with these 5 key genes in the Train group showed an accuracy of 96.36% and an AUC of 0.997. Five-fold cross-validation of the neural network model indicated an average AUC greater than 0.9, demonstrating robustness. In the Test group, two independent datasets yielded AUC values of 0.814 and 0.788, respectively.
2. Research Results and Analysis
The dataset used in this study comes from the cardiovascular disease dataset provided by the Kaggle platform. This dataset consists of 11 basic variables and 1 target variable. The dataset contains two types of data: categorical data and ratio data, as shown in Table 1.
Table 1: Feature Description
Feature Name | Feature Description | Feature Type |
Age | Unit: days | Ratio Data |
Height | Unit: cm | Ratio Data |
Weight | Unit: kg | Ratio Data |
Gender | 1 = Male, 2 = Female | Categorical Data |
Systolic Pressure | Integer | Ratio Data |
Diastolic Pressure | Integer | Ratio Data |
Cholesterol | 1 = Normal, 2 = High, 3 = Very High | Categorical Data |
Glucose | 1 = Normal, 2 = High, 3 = Very High | Categorical Data |
Smoking | Binary | Ratio Data |
Alcohol Intake | Binary | Ratio Data |
Physical Activity | Binary | Ratio Data |
Presence of Cardiovascular Disease | Binary | Ratio Data |
The preprocessed dataset is divided into training and testing sets at a ratio of 9:1, and training is conducted for 1000 epochs, with the MAE and MSE values recorded for each epoch.
After training the model for 1000 epochs, the results are shown in Table 2.
Table 2: Statistical Indicators of Control Groups
Basic Control Group (Sample Size, Mean, and Standard Deviation of Height and Weight) | ||||||||
Gender1 Control Group | Gender2 Control Group | |||||||
Age | 29-40 | 40-50 | 50-60 | 60-70 | 30-40 | 40-50 | 50-60 | 60-70 |
Sample Size | 1110 | 12182 | 23826 | 8362 | 676 | 7428 | 11687 | 4665 |
Height (Mean,Standard Deviation) | 162(7.5) | 162(6.8) | 161(7.0) | 160(7.4) | 171(8.0) | 171(7.1) | 170(7.2) | 169(7.1) |
Weight (Mean,Standard Deviation) | 70.0(14.6) | 71.2(14.3) | 73.0(14.1) | 73.7(14.2) | 76.2(14.8) | 80.0(14.6) | 77.6(14.0) | 77.0(13.7) |
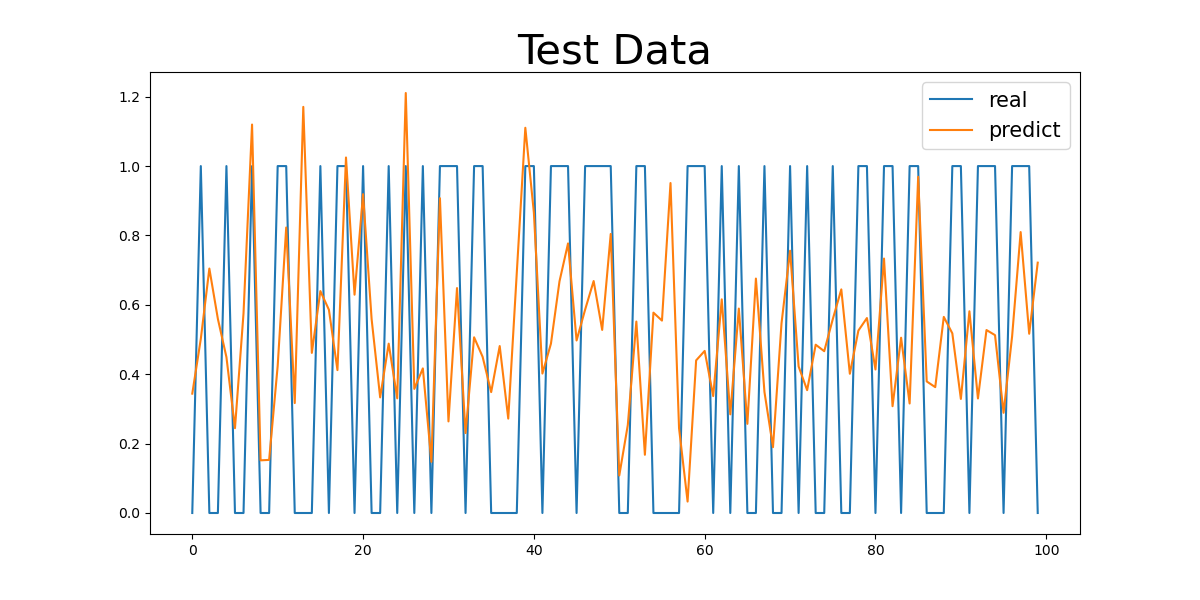
Figure 1: Basic Control Group Numeric Results
(a) |
(b) |
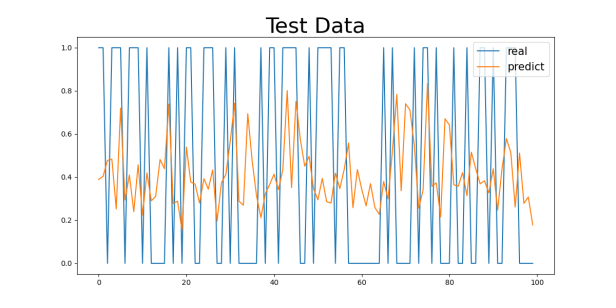
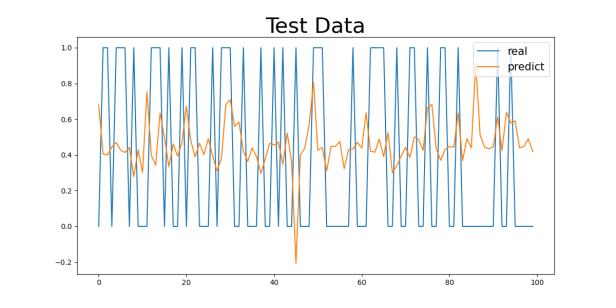
Figure 2: Basic Control Group Numeric Results: (a) Basic Control Group
(a) |
(b) |
(c) |
(d) |
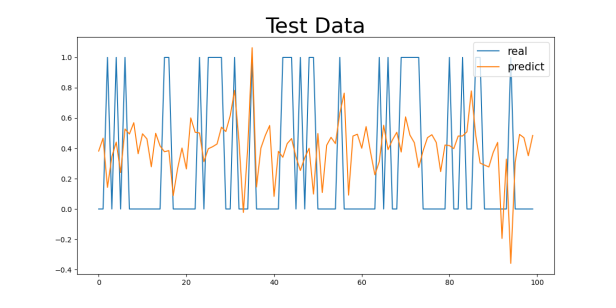
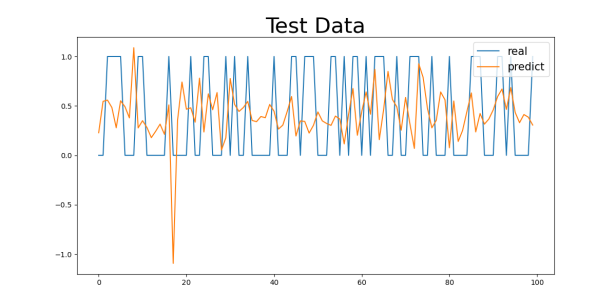
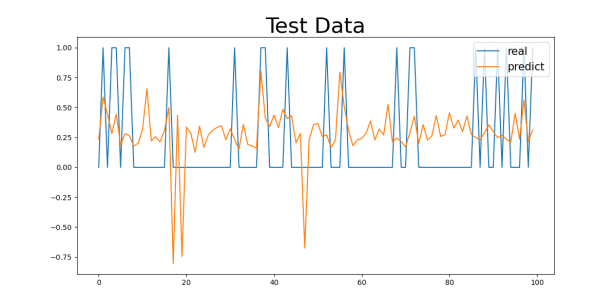
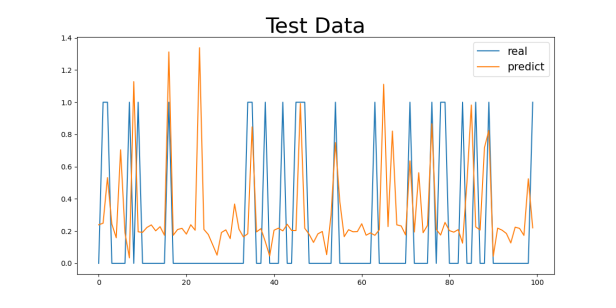
Figure 3: Gender1 Age Control Group Numeric Results: (a) 29-40, (b) 40-50, (c) 50-60, (d) 60-70
(a) |
(b) |
(c) |
(d) |
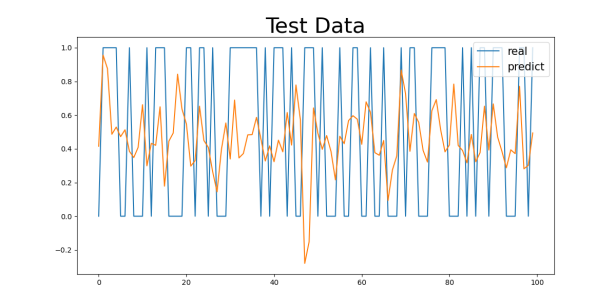
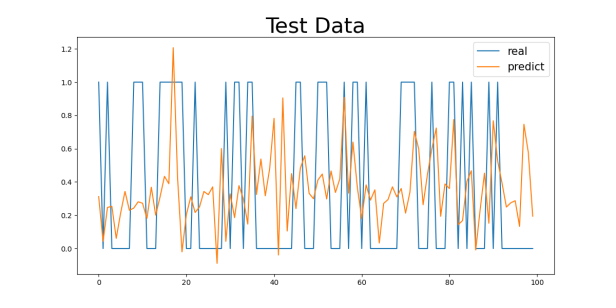
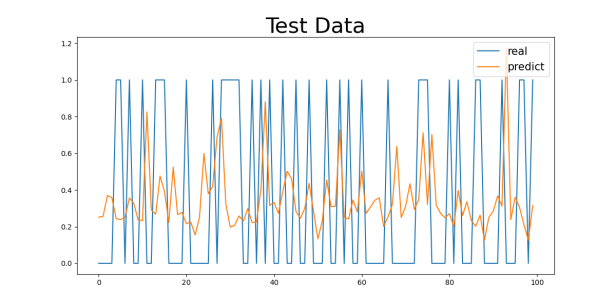
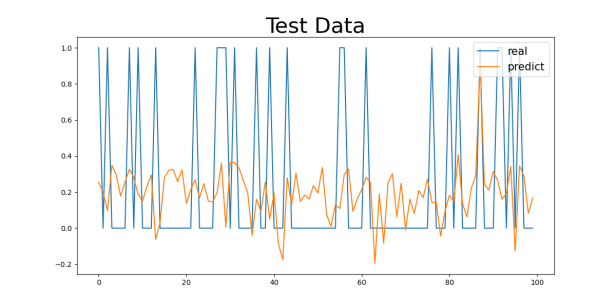
Figure 4: Gender2 Age Control Group Numeric Results: (a) 29-40, (b) 40-50, (c) 50-60, (d) 60-70
Table 3: Control Group Numeric Results
Basic Control Group | ||||||||
MAE | 0.4364 | |||||||
MSE | 0.2339 | |||||||
Gender1 Control Group | Gender2 Control Group | |||||||
MAE | 0.4041 | 0.4055 | ||||||
MSE | 0.2435 | 0.2000 | ||||||
Age | 29-40 | 40-50 | 50-60 | 60-70 | 29-40 | 40-50 | 50-60 | 60-70 |
MAE | 0.3229 | 0.4259 | 0.4653 | 0.4043 | 0.3018 | 0.4269 | 0.4780 | 0.4473 |
MSE | 0.1730 | 0.2124 | 0.2361 | 0.2017 | 0.1369 | 0.2112 | 0.2361 | 0.2285 |
3. Discussion
The cardiovascular disease dataset provided by Kaggle was analyzed in this study to assess the impact of different features on the prediction model for cardiovascular diseases. The model’s prediction performance was evaluated by comparing the training and testing results across different gender groups and age ranges.
First, as shown in the MAE and MSE values in Table 3, there are some differences in the model’s performance, especially under different gender and age group classifications. For the gender control groups (Gender1 and Gender2), the model’s MAE values are 0.4041 and 0.4055, respectively, while the MSE values are 0.2435 and 0.2000, indicating slight differences in prediction errors across gender groups, though the overall discrepancy is small. This could be related to the differences in the incidence rates of cardiovascular diseases between genders, but the model’s predictive ability does not seem to be significantly influenced by gender.
For the 29-40 age group, the model’s MAE value is the smallest, at 0.3229 (for the Gender1 group) and 0.3018 (for the Gender2 group). This age group generally consists of younger individuals with better health, leading to a lower incidence of cardiovascular diseases and less difficulty in prediction, allowing the model to capture their characteristics more effectively. As age increases, the MAE values gradually increase. For the 40-50 and 50-60 age groups, the MAE values are 0.4259 and 0.4653 (for the Gender1 group) and 0.4269 and 0.4780 (for the Gender2 group), respectively. This change suggests that as age increases, the risk of cardiovascular diseases rises, possibly accompanied by more health issues (e.g., hypertension, diabetes), making prediction more difficult and increasing errors.
For the 60-70 age group, the MAE values are the highest, at 0.4043 (for the Gender1 group) and 0.4473 (for the Gender2 group). The cardiovascular health of the elderly tends to be more complex, potentially involving multiple complications, which makes predicting the diseases more challenging. This is likely the main reason for the higher MAE values in this group.
Regarding the analysis of MSE values, the results are similar to those of the MAE. As age increases, the MSE values gradually increase, with a particularly significant rise in the 60-70 age group. For the 29-40 age group, the MSE values are relatively low (0.1730 for the Gender1 group and 0.1369 for the Gender2 group), while for the 60-70 age group, the MSE values are 0.2017 (for the Gender1 group) and 0.2285 (for the Gender2 group). The increase in MSE values indicates that as age increases, the model’s error in handling extreme or outlier cases (such as sudden cardiovascular events) increases.
4. Conclusion
4.1. Preliminary Findings
Although this study has analyzed the cardiovascular disease dataset from Kaggle and has yielded preliminary results, there are still several limitations:
4.1.1. Limited Data Source
The data source in this study is relatively narrow, relying solely on the cardiovascular disease dataset from Kaggle. It does not cover a broader range of regions or populations. This limitation may restrict the applicability and generalizability of the study’s findings to different populations.
4.1.2. Insufficient Randomness in Data Sampling
The data sampling process was not fully randomized, which could lead to bias in the sample distribution. For example, the sample size for specific age groups is significantly higher than for others, which may reduce the model’s predictive performance for groups with fewer samples, thereby affecting the overall generalizability of the model.
4.1.3. Lack of Detailed Age and Weight Groupings
In the data analysis and model evaluation, age and weight groupings were not further refined. For instance, classifying age into broad ranges such as 29-40 years and 60-70 years may obscure key characteristics within specific age groups. Additionally, insufficient sample sizes in certain subgroups could lead to statistical instability, which negatively impacts the reliability of the model’s prediction capability.
Future research should aim to introduce more diverse datasets, optimize sampling strategies to ensure a balanced data distribution, and refine the grouping of variables to further enhance the model’s applicability and prediction accuracy.
References
[1]. Zhao, H. Q. (2011). Differential diagnosis of coronary heart disease based on artificial neural networks. Chinese and Foreign Medical Research, 30(12), 191-192.
[2]. Lü, H., Du, J., Liu, Y., et al. (2017). Application of the multilayer perceptron model in predicting the risk of diabetes-induced coronary heart disease based on traditional Chinese medicine personality and constitution. Chinese Journal of Information on Traditional Chinese Medicine, 24(12), 88-91.
[3]. Sun, J. F., Geng, Y. L., Guo, Y. R., et al. (2013). Comparison of Elman neural network and ARI-MA model in predicting influenza incidence. Journal of Zhengzhou University: Medical Edition, 48(5), 584.
[4]. Zhang, C., Wu, Y. M., Wu, Y. J., et al. (2010). Application of artificial neural network technology in fiberoptic bronchoscopy diagnosis of lung cancer. Journal of Zhengzhou University: Medical Edition, 45(1), 113.
[5]. Qian, L., Shi, L. Y., Cheng, M. J. (2005). Application of artificial neural networks in predicting the onset of diabetes and impaired glucose tolerance in individuals. Chinese Journal of Chronic Disease Prevention and Control, 13(6), 277.
[6]. Qian, L., Shi, L. Y., Cheng, M. J. (2005). Application of artificial neural networks in predicting the onset of diabetes and impaired glucose tolerance in individuals. Chinese Journal of Chronic Disease Prevention and Control, 13(6), 277-280.
[7]. Zhang, Z. H., Miao, C. S., Zeng, Z. H., et al. (2012). Improvement and application of an artificial neural network method for cloud classification. Journal of Applied Meteorology, 23(3), 355-363.
[8]. Ding, L., Zhang, X. Y., Liu, L. P. (2020). Primary liver cancer syndrome diagnosis and classification prediction model based on deep neural networks. World Science and Technology - Modernization of Traditional Chinese Medicine, 22(12), 4185-4192.
[9]. Zhu, X. Y., Chen, N., Liu, L. X., et al. (2019). Current applications of artificial neural networks in lung cancer research. Chinese Journal of Lung Cancer, 22(4), 245-249.
[10]. Huang, Y. (2017). Data analysis and algorithm design of medical informatics in diabetes. Jinan University (Master’s thesis).
[11]. Song, Y., Yang, B. F. (2006). Artificial neural networks and their application in disease diagnosis. Chinese Journal of Medical Practice, 5(3), 275-277.
[12]. Tang, C. Q. (2018). Comparative analysis of machine learning and logistic regression models in predicting acute kidney injury in severely burned patients. Chinese Journal of Burns, 6, 343-348.
Cite this article
Huang,Y. (2025). Research on Prediction Models of Cardiovascular Diseases Based on Artificial Neural Networks. Applied and Computational Engineering,139,35-41.
Data availability
The datasets used and/or analyzed during the current study will be available from the authors upon reasonable request.
Disclaimer/Publisher's Note
The statements, opinions and data contained in all publications are solely those of the individual author(s) and contributor(s) and not of EWA Publishing and/or the editor(s). EWA Publishing and/or the editor(s) disclaim responsibility for any injury to people or property resulting from any ideas, methods, instructions or products referred to in the content.
About volume
Volume title: Proceedings of the 7th International Conference on Computing and Data Science
© 2024 by the author(s). Licensee EWA Publishing, Oxford, UK. This article is an open access article distributed under the terms and
conditions of the Creative Commons Attribution (CC BY) license. Authors who
publish this series agree to the following terms:
1. Authors retain copyright and grant the series right of first publication with the work simultaneously licensed under a Creative Commons
Attribution License that allows others to share the work with an acknowledgment of the work's authorship and initial publication in this
series.
2. Authors are able to enter into separate, additional contractual arrangements for the non-exclusive distribution of the series's published
version of the work (e.g., post it to an institutional repository or publish it in a book), with an acknowledgment of its initial
publication in this series.
3. Authors are permitted and encouraged to post their work online (e.g., in institutional repositories or on their website) prior to and
during the submission process, as it can lead to productive exchanges, as well as earlier and greater citation of published work (See
Open access policy for details).
References
[1]. Zhao, H. Q. (2011). Differential diagnosis of coronary heart disease based on artificial neural networks. Chinese and Foreign Medical Research, 30(12), 191-192.
[2]. Lü, H., Du, J., Liu, Y., et al. (2017). Application of the multilayer perceptron model in predicting the risk of diabetes-induced coronary heart disease based on traditional Chinese medicine personality and constitution. Chinese Journal of Information on Traditional Chinese Medicine, 24(12), 88-91.
[3]. Sun, J. F., Geng, Y. L., Guo, Y. R., et al. (2013). Comparison of Elman neural network and ARI-MA model in predicting influenza incidence. Journal of Zhengzhou University: Medical Edition, 48(5), 584.
[4]. Zhang, C., Wu, Y. M., Wu, Y. J., et al. (2010). Application of artificial neural network technology in fiberoptic bronchoscopy diagnosis of lung cancer. Journal of Zhengzhou University: Medical Edition, 45(1), 113.
[5]. Qian, L., Shi, L. Y., Cheng, M. J. (2005). Application of artificial neural networks in predicting the onset of diabetes and impaired glucose tolerance in individuals. Chinese Journal of Chronic Disease Prevention and Control, 13(6), 277.
[6]. Qian, L., Shi, L. Y., Cheng, M. J. (2005). Application of artificial neural networks in predicting the onset of diabetes and impaired glucose tolerance in individuals. Chinese Journal of Chronic Disease Prevention and Control, 13(6), 277-280.
[7]. Zhang, Z. H., Miao, C. S., Zeng, Z. H., et al. (2012). Improvement and application of an artificial neural network method for cloud classification. Journal of Applied Meteorology, 23(3), 355-363.
[8]. Ding, L., Zhang, X. Y., Liu, L. P. (2020). Primary liver cancer syndrome diagnosis and classification prediction model based on deep neural networks. World Science and Technology - Modernization of Traditional Chinese Medicine, 22(12), 4185-4192.
[9]. Zhu, X. Y., Chen, N., Liu, L. X., et al. (2019). Current applications of artificial neural networks in lung cancer research. Chinese Journal of Lung Cancer, 22(4), 245-249.
[10]. Huang, Y. (2017). Data analysis and algorithm design of medical informatics in diabetes. Jinan University (Master’s thesis).
[11]. Song, Y., Yang, B. F. (2006). Artificial neural networks and their application in disease diagnosis. Chinese Journal of Medical Practice, 5(3), 275-277.
[12]. Tang, C. Q. (2018). Comparative analysis of machine learning and logistic regression models in predicting acute kidney injury in severely burned patients. Chinese Journal of Burns, 6, 343-348.