


1. Introduction
Due to post Coronavirus Disease-2019 (COVID-19) economic recovery and the innovations of new digital payment methods such as mobile wallets and contactless transactions, credit card usage has grown rapidly in recent years. According to the Consumer Financial Protection Bureau, credit card spending strongly rebounded to $3.2 trillion in 2022, reflecting a 48% rise compared to 2020 [1]. Similarly, the Federal Reserve reports that credit payments made up 32% of all transactions in 2023, up from 18% in 2016 [2]. The growth is also reflected in rising credit balances and the number of open accounts. By mid-2023, credit card balances exceeded $1 trillion, with 70 million more open accounts compared to 2019 [3]. However, this expansion also raises concern regarding credit risk. While the delinquency rates dropped during the early pandemic, this decline was likely attributed to fiscal relief, loan forbearance, and reduced consumer spending. They began rising again in 2021 and have since surpassed pre-pandemic levels by early 2023 [4]. During the first nine months of 2024, U.S. card issuers wrote off over $46 billion in bad credit card debts, a 50% increase from 2023 [5]. Thus, a reliable assessment of credit risk remains crucial not only for financial institutions to make risk management decisions but also for the stability of the market economy as a whole.
Machine learning (ML), which allows computers to learn from historical data and solve tasks without explicit programming, has been widely used in credit card default predictions. An early comparative study by Yeh and Lien evaluates machine learning methods on Taiwanese credit card default prediction and proposes a novel “Sorting Smoothing Method” to calibrate predicted probabilities [6]. Yeh and Lien found that artificial neural networks were the most effective at estimating true default probability, while k-nearest neighbors and decision trees achieved the lowest error rates (approximately 18% on training data), indicating that nonlinear models were advantageous in this context [6]. The dataset used in this study, titled Default of Credit Card Clients, is publicly available through the University of California, Irvine (UCI) Machine Learning Repository [7]. Building on this dataset, Faraj, Mahmud, and Rashid compared traditional classifiers, neural networks, and ensemble models such as Extreme Gradient Boosting (XGBoost), and assessed models using Area Under the Receiver Operating Characteristic Curve (ROC) for class distinction and F1 score for precision-recall balance [8]. They found that ensemble methods consistently outperformed others in predicting credit card defaults, even under class imbalance [8].
While prior studies have heavily focused on predictive accuracy, algorithm comparison, or class imbalance handling, fairness concerns remain underexplored, particularly for the education level. Complex models, such as boosting and neural networks, often lack interpretability and may inadvertently amplify bias present in the training data [6,8,9]. Especially when group representation is imbalanced from disproportionate sampling, demographic sensitive attributes may implicitly or explicitly participate or even be weighted more during model training, further unintentionally perpetuate existing bias from the dataset or the classifier itself. Although education is frequently included as a relevant predictive feature, few studies assess its fairness impact. Existing fairness research on this dataset mainly focuses on gender and age [10, 11]. Failing to address such fairness issues can result in discriminatory outcomes against less privileged educational groups, potentially leading to reputational harm, regulatory penalties, and reduced consumer trust for financial institutions. Given the popularity of the Default of Credit Card Clients dataset, the strong performance of boosting algorithms like XGBoost, and the lack of bias mitigation studies involving education, this study explores the class imbalance in the dataset, defines and chooses accuracy and fairness metrics, and implements various fairness interventions to reduce disparity in across education groups.
2. Data preprocessing and baseline modeling
2.1. Exploratory analysis and feature preparation
The Default of Credit Card Clients dataset contains 30,000 anonymized client records from a Taiwanese financial institution. Each record includes 23 feature variables comprising demographic and financial attributes, alongside a binary target label indicating whether the client defaulted on their payment in the subsequent month, as detailed in Table 1. Education level, designated as the sensitive attribute, is binarized to indicate whether a client has graduate-level education. The education groups are highly imbalanced, with 35.28% of clients classified as graduate-educated and 64.72% as non-graduate. The dataset contains no missing values, so no imputation is required.
Table 1: Summary of dataset features, including names, types, and descriptions from [7]
Variable Name | Type | Description |
LIMIT_BAL | Integer | Amount of the given credit (NT dollar). |
SEX | Categorical | Gender (1 = male; 2 = female). |
EDUCATION | Categorical | Education level (1 = graduate school; 2 = university; 3 = high school; 4 = others). |
MARRIAGE | Categorical | Marital status (1 = married; 2 = single; 3 = others). |
AGE | Categorical | Age of the client (in years). |
PAY_0, PAY_2, …, PAY_6 | Integer | History of past monthly payment status (-1 = pay duly; 1 = one month delay; ... 9 = nine or more months delay). |
BILL_AMT1, …, BILL_AMT6 | Integer | Amount of bill statement for previous months (NT dollars). |
PAY_AMT1, …, PAY_AMT6 | Integer | Amount of previous payments (NT dollars). |
DEFAULT PAYMENT NEXT MONTH | Binary | Target label for default status (1 = default; 0 = no default). |
As shown in the boxplots from Figure 1, all financial features displayed right-skewed distributions. The correlation matrix in Figure 2 shows high correlation among bill statement amounts, suggesting redundancy due to similar underlying patterns. A moderate correlation among past payment statuses implies “Sequence Effects”, as someone makes consistent late payments over time. The given credit is mildly correlated with both bills and repayments.
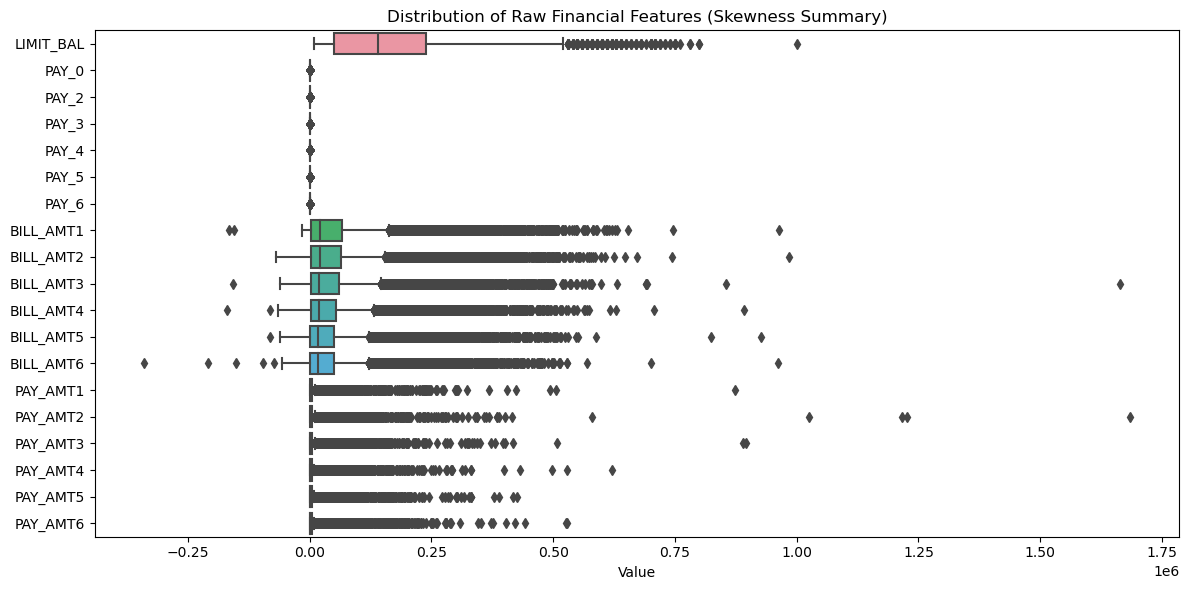
Figure 1: Boxplots of raw financial features show strong right skewness and the presence of outliers (picture credit: original)
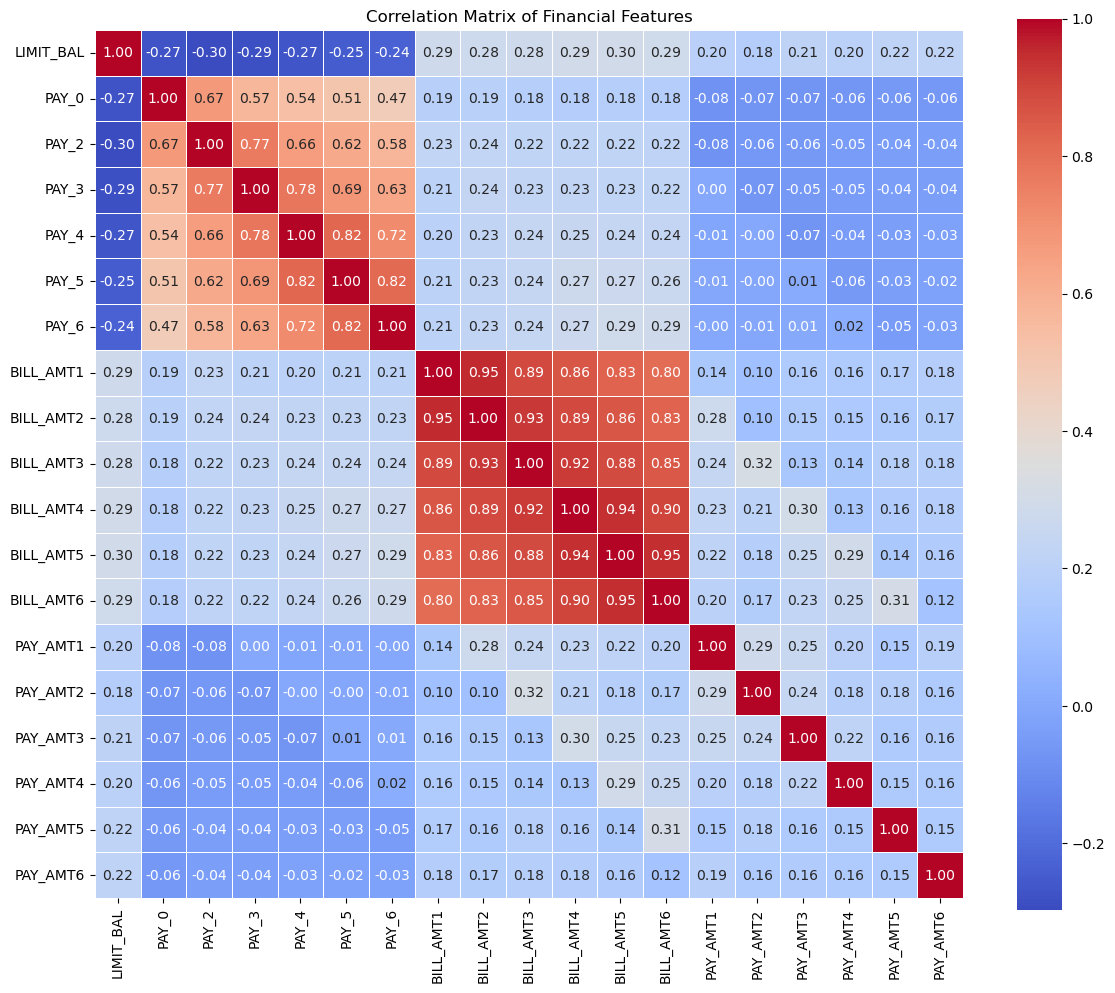
Figure 2: Pearson correlations heatmap of financial variables, suggesting redundancy among bill amounts and temporal dependency in payment status (picture credit: original)
To implement fairness through unawareness, all sensitive attributes—sex, education, marriage, and age— are protected from decision-making. Only financial features were retained. Because of strong right-skewness across all financial features, a logarithmic transformation, defined as log(1+x), was applied on each financial input to reduce distributional skew and stabilize variance. To reduce dimensionality and redundancy, bill amounts are summed to the total bill amount and previous payments are summed to the total payment amount, due to high correlations. These aggregations were then used to engineer two ratio-based features as follows.
\( Credit\begin{matrix} \\ \end{matrix}utilization=\frac{\sum Bill\begin{matrix} \\ \end{matrix}Amounts}{Credit\begin{matrix} \\ \end{matrix}LIm{i}t+ε} \) (1)
\( Payment\begin{matrix} \\ \end{matrix}ratio=\frac{\sum Payment\begin{matrix} \\ \end{matrix}Amounts}{\sum Bill\begin{matrix} \\ \end{matrix}Amounts+ε} \) (2)
where \( ε=1×1{0^{-6}} \) is a mall constant added to avoid division by zero. The final feature vector includes 19 log-transformed financial features and the two derived ratios.
2.2. Baseline model configuration
The XGBoost model is adopted for its ability to capture complex nonlinear relationships. XGBoost also iteratively minimizes a loss function using second-order Taylor expansion and incorporates regularization to prevent overfitting. Unlike traditional models (e.g., logistic regression or random forests), XGBoost is suitable for this credit default dataset since it can handle class imbalance via the “scale_pos_weight” built-in parameter, which controls the balance of positive and negative weights. A grid search was used to fine-tune its hyperparameters, producing the optimal configuration of 38 boosting rounds, shallow tree depth of 2 for overfitting reduction, “scale_pos_weight” of 3.507 between defaulters and non-defaulters, and a random state of 0 for reproducibility. This configuration serves as the fixed baseline model for evaluating the effects of various fairness interventions.
2.3. Fairness and performance metrics
Both dataset-level prevalence indicators and per-group accuracy/fairness-based metrics are used to reveal the underlying patterns. Fairness metrics that evaluate disparities in model behavior include true positive rate (TPR), true negative rate (TNR), false positive rate (FPR), false negative rate (FNR), equal opportunity (TPR parity), and more. Definitions and baseline values are summarized in Table 2.
Table 2: Definitions and baseline values for all evaluation metrics. EDUCATION=1 refers to clients with graduate education; EDUCATION=0 indicates otherwise
Metrics | Type | Description/ Formula | Baseline Model |
Dataset Prevalence | Dataset-level | Proportion of defaults in the full dataset. | 0.2212 |
Per-Group Prevalence | Dataset-level | Proportion of defaults within each sensitive group. | EDUCATION=1: 0.1923 EDUCATION=0: 0.2369 |
Overall Accuracy | Performance | Overall accuracy on the test set. | 0.7738 |
Balanced Accuracy | Performance | Mean of TPR and TNR, adjusts for class imbalance [12]. | 0.7189 |
Accuracy Parity | Fairness (Group-level) | Difference in accuracy between groups. | EDUCATION=1: 0.8003 EDUCATION=0: 0.7594 |
Demographic Parity | Fairness (Group-level) | Positive prediction rates are equal across groups [13]. | EDUCATION=1: 0.2377 EDUCATION=0: 0.3025 |
TPR Parity | Fairness (Group-level) | TPRs are equal across groups [14]. | EDUCATION=1: 0.5988 EDUCATION=0: 0.6275 |
TPR Gap | Fairness (Group-level) | Absolute difference in TPR between groups. | 0.0287 |
FPR Parity | Fairness (Group-level) | FPRs are equal across groups [14]. | EDUCATION=1: 0.1516 EDUCATION=0: 0.1980 |
Generalized Equalized Odds | Fairness (Error-focused) | Evaluates parity in both FPR and FNR [15]. | EDUCATION=1: GFPR=0.1224, GFNR = 0.0773 EDUCATION=0: GFPR=0.1498, GFNR=0.0907 |
Treatment Equality Ratio | Fairness (Error-focused) | Ratio of false positives to false negatives per group [16]. | EDUCATION=1: 1.5837 EDUCATION=0: 1.6516 |
The overall dataset shows a 22.12% default rate, meaning that most clients do not default. Among groups, 19.23% of graduate-educated clients defaulted, versus 23.69% for those without, indicating higher risk among less educated clients. Due to prevalence imbalance, standard accuracy overestimates model quality by favoring the majority class, leading to more unnecessary “no default” predictions. Balanced Accuracy, on the other hand, prevents a surge of false positives by averaging TPR and TNR. Despite relatively high accuracy (77.38% overall and 71.89% balanced) for baseline, a 4% noticeable difference confirmed some disparity across education groups. The demographic parity legitimately perceives differences as justified in the class distribution, thus not relevant to the fairness goal. For Equal Opportunity, the less educated group had a slightly higher TPR than the graduate-educated group, with a TPR gap of 2.87%. This gap suggests the model under flags the graduate-educated group while over flags the less educated, raising concerns of risky approvals for unqualified graduate-educated clients and loan rejections for qualified less educated clients. Although the gaps in Generalized Equalized Odds and Treatment Equality Ratios are numerically small, their directional patterns still reflect a fairness concern. For instance, a high FPR for the less educated implies the baseline is more conservative with graduate-educated clients, and more aggressive with less educated clients. The ratio of false positives to false negatives is not the primary fairness concern in this study, as credit default prediction is an opportunity-sensitive domain to identify defaulters equitably. Thus, the balanced accuracy and the TPR gap will be used for later fairness intervention
3. Method
3.1. Criteria and environment
To quantify whether interventions could reduce disparities between education groups while maintaining high predictive accuracy, two evaluation criteria are adopted:
(1) reducing the TPR gap between education groups to below 0.01, and
(2) maintaining minimal drop in balanced accuracy relative to the baseline.
Each intervention technique is fine-tuned over combinations of hyperparameters using grid search, and all qualified configurations achieving the fairness criterion are ranked by balanced accuracy in descending order. For reproducibility, all experiments were conducted using Python version 3.8.19 and XGBoost 2.1.4. The dataset was shuffled with a fixed random seed (0) and split into a 50:50 training and testing split, given its large size.
3.2. Intervention reproduction and fine-tuning
Fairness intervention techniques can be implemented at different stages of the machine learning pipeline, and they are commonly categorized as: (1) pre-processing, (2) in-processing, and (3) post-processing. This study reproduces one representative method for each category and fine-tunes its hyperparameters. Each intervention is implemented independently from the same baseline model and evaluated under the same experimental settings described earlier.
3.2.1. Dataset-based intervention (massaging)
Dataset-based intervention from the pre-processing stage aims to mitigate bias before model training. It is typically achieved through feature engineering, such as one-hot encoding, or directly manipulating the dataset, such as flipping labels for some records. In this study, the data-based intervention is achieved using the massaging approach proposed by Kamiran & Calders [17]. The method is rank-based as it begins by training a temporary model (ranker) to estimate the probability of default. Based on these group-wise confidence scores, instances near the decision boundary are considered for relabeling without largely harming the accuracy. Specifically, top M candidates from the disadvantaged negatives are promoted, while top M candidates from the advantaged positives are demoted, ensuring the same class distribution. A closed-form discrimination formula is defined as \( M = disc(D) \cdot |{D_{b}}| \cdot |{D_{w}}| / |D| \) . The discrimination score of the dataset, disc(D), defined as the difference in positive label prevalence between the unprivileged group, \( {D_{b}} \) (less educated), and the privileged group, \( {D_{w}} \) (educated) [17].
Beyond the default formula, this study also experiments with scaled values of M using a multiplier, \( {M_{multi}} \) . All configurations achieving a TPR gap less than 0.01 are evaluated and ranked based on balanced accuracy.
3.2.2. Model-based intervention (reweighing)
Model-based interventions from the in-processing stage can be achieved through adjusting the parameters of the model, such as sample weights for the XGBoost classifier. It aims to adjust discrimination during the training stage, without altering feature values or class labels. In this study, the reweighing technique from Kamiran and Calders is first reproduced and then fine-tuned on other parameters. Unlike massaging, reweighing retains the original dataset but modifies the influence of each instance during model training through group- and class-conditional weights. Each training instance was assigned a weight based on its group (educated or less educated) and label (default or non-default). Weights were computed such that the contribution of each group-label combination was inversely proportional to its frequency, ensuring underrepresented combinations receive more influence, thus balancing the contribution of each group-label pair to the learning process. For each of the four combinations of sensitive attribute \( z ϵ \lbrace 0, 1\rbrace \) and class label \( y ϵ \lbrace 0, 1\rbrace \) , an instance is given a weight calculated as \( Weight(z,y) = \frac{P(z) \cdot P(y)}{P(z, y)} \) , where \( P(z, y) \) is the observed joint probability of group z and label y, and \( P(z), P(y) \) are their marginal probabilities. After Reweighing, the model is further fine-tuned on parameters such as tree depth and imbalance scale.
3.2.3. Outcome-based intervention (thresholding)
Outcome-based interventions from the post-processing stage can be achieved through adjusting prediction outcomes after training, without modifying the model or input features. This study implements thresholding, a group-specific decision thresholding that is applied to the probability outputs of the model from Kamiran and Calders. Thresholding tries to equalize the TPRs across different education groups by adjusting the classification thresholds after model prediction. Given predicted probabilities \( \hat{P}(y=1 | x) \) from a trained classifier, two thresholds, \( {t_{0}} \) and \( {t_{1}} \) are defined for the less educated and educated groups. These two thresholds are iteratively adjusted to minimize the TPR gap, with the goal to satisfy the Equal Opportunity criterion \( |TP{R_{educated}}({t_{0}}) - TP{R_{less educated}}({t_{1}})| \lt ε \) , where ε = 0.01 is a small tolerance for fairness. The model will assign a positive label if the predicted probability is greater than the threshold.
4. Experiment
4.1. Dataset-based intervention (massaging)
As the massaging technique only modified the dataset, the model construction setup remains unchanged from the baseline XGBoost configuration (38 boosting rounds, tree depth of 2, class imbalance weight of 3.507). Reproducing the closed-form formula of M, 132 training labels were flipped to mitigate group-level discrimination. To investigate how different massaging intensities could impact the number of flips, additional experiments are conducted with custom multipliers of M from 1.8 to 3.2 with a step size of 0.1, which allows for fine-tuned fairness adjustments. Model performance was evaluated using the same criteria: balanced accuracy and TPR gap.
4.2. Model-based intervention (reweighing)
The reweighing technique was implemented by computing the training instance weights using the class-group joint distribution in the dataset. These weights were then passed to the XGBoost classifier during the training stage via the sample weight parameter. To optimize performance and fairness, the following model hyperparameters were tuned using grid search: Number of estimators: 30 to 50, in steps of 1; Max depth = {2, 3, 4, 5}; Class imbalance weight: 3.82 to 3.98 in steps of 0.02. The configuration that achieved a TPR gap below 0.01 while maintaining a high balanced accuracy was selected, considering a fairness-performance trade-off.
4.3. Post-processing intervention (thresholding)
To evaluate the impact of post-processing, the original classifier trained in Part 1 was used and applied group-specific thresholds on the predicted probabilities. The thresholds were tuned by performing a small grid search over possible values for each group to minimize the TPR gap on the training data while holding the model fixed. After tuning, an optimal threshold of 0.5 for the less educated group and a threshold of 0.48445 for the educated group were found.
5. Results and discussion
5.1. Massaging intervention
The default massaging intervention (M = 132 flipped labels) results in a balanced accuracy of 0.7156 and a TPR gap of 0.0230 on the test dataset. After experimenting with different \( {M_{multi}} \) , the model achieves a TPR Gap of 0.0061 with a slight reduction in balanced accuracy (0.7176).
While Kamiran & Calders propose a closed-form solution for determining the number of label modifications needed to eliminate dataset-level discrimination, it is observed that the closed-form formula does not always yield the optimal M. Since the formula is derived under a theoretical assumption where flipping exactly M promotion and demotion pairs could only result in the training dataset having zero discrimination as measured by prevalence rates, it does not guarantee fairness on the testing dataset with a TPR gap of exactly zero nor a balanced performance on unseen data. The default M was too small, as proved from the observations, to actually reduce model bias during training, and a more aggressive M leads to better fairness without overfitting or hurting performance.
5.2. Reweighing intervention
After applying the reweighing technique, it is observed that the model significantly reduced the TPR disparity across education groups. Specifically, the TPRs for the two groups became nearly equal with 0.6654 versus 0.6621, and a TPR gap was achieved with just 0.0033. This indicates a high level of fairness in terms of Equal Opportunity, which ensures defaulters are identified equally across groups.
5.3. Thresholding intervention
After tuning the thresholds on the training dataset to minimize the TPR gap, the performance on the testing dataset was evaluated, which achieved a balanced accuracy of 0.7186 and a small TPR gap of 0.0050.
6. Conclusion
This study explored three fairness intervention strategies across different stages to address disparities in a credit default prediction among education groups. Focusing on the Equal Opportunity, the XGBoost model was trained and fine-tuned to search for the best configuration of hyperparameters that minimize the TPR gap without sacrificing too much on the balanced accuracy compared to the baseline model. Eventually, all three fairness interventions, including massaging, reweighing, and thresholding, are proven to work with a tiny gap of TPR less than 0.01 and similar balanced accuracy. Thus, the fairness–accuracy tradeoff was consistently analyzed across all methods. Notably, all interventions did not hugely harm the accuracy much, which indicates fairness and utility can coexist when carefully balanced. This work serves as a practical reproduction and comparative analysis of fairness methods, as well as explores potential novel improvements that were not explicitly addressed in the original research papers. Future directions include exploring other fairness notions, applying interventions to multiple sensitive attributes at the same time, and extending to more complex or real-time decision settings.
References
[1]. Consumer Financial Protection Bureau. (2023). The consumer credit card market. U.S. Government. Retried from https://www.consumerfinance.gov/data-research/research-reports/the-consumer-credit-card-market/.
[2]. Bayeh, B., Cubides, E., & O’Brien, S. (2024). c. Federal Reserve Financial Services.
[3]. Stavins, J. (2023). Credit card spending and borrowing since the start of the COVID-19 pandemic. Federal Reserve Bank of Boston Research Paper Series Current Policy Perspectives Paper, 97187.
[4]. Barnes, K., Bopst, C., & Driscoll, J. (2025). Predicting Credit Card Delinquency Rates.
[5]. Broadbent, G. (2025). Credit card charge-offs totaled $46B through Q3 2024—Here’s what to expect in 2025. eMarketer.
[6]. Yeh, I. C., & Lien, C. H. (2009). The comparisons of data mining techniques for the predictive accuracy of probability of default of credit card clients. Expert systems with applications, 36(2), 2473-2480.
[7]. Esenogho, E., Mienye, I. D., Swart, T. G., et al. (2022). A neural network ensemble with feature engineering for improved credit card fraud detection. IEEE access, 10, 16400-16407.
[8]. Faraj, A. A., Mahmud, D. A., & Rashid, B. N. (2021). Comparison of different ensemble methods in credit card default prediction. UHD Journal of Science and Technology, 5(2), 20-25.
[9]. Bhandary, R., & Ghosh, B. K. (2025). Credit Card Default Prediction: An Empirical Analysis on Predictive Performance Using Statistical and Machine Learning Methods. Journal of Risk and Financial Management, 18(1), 23.
[10]. Li, Y., Yi, J., Chen, H., et al. (2021). Theory and application of artificial intelligence in financial industry. Data Science in Finance and Economics, 1(2), 96-116.
[11]. Pham, N., Do, M. K., Dai, T. V., Hung, P. N., & Nguyen-Duc, A. (2025). FAIREDU: A multiple regression-based method for enhancing fairness in machine learning models for educational applications. Expert Systems with Applications, 269, 126219.
[12]. Brodersen, K. H., Ong, C. S., Stephan, K. E., & Buhmann, J. M. (2010). The balanced accuracy and its posterior distribution. In 2010 20th international conference on pattern recognition, 3121-3124.
[13]. Dwork, C., Hardt, M., Pitassi, T., Reingold, O., & Zemel, R. (2012). Fairness through awareness. In Proceedings of the 3rd innovations in theoretical computer science conference, 214-226.
[14]. Hardt, M., Price, E., & Srebro, N. (2016). Equality of opportunity in supervised learning. Advances in neural information processing systems, 29.
[15]. Pleiss, G., Raghavan, M., Wu, F., Kleinberg, J., & Weinberger, K. Q. (2017). On fairness and calibration. Advances in neural information processing systems, 30.
[16]. Berk, R., Heidari, H., Jabbari, S., Kearns, M., & Roth, A. (2018). Fairness in Criminal Justice Risk Assessments: The State of the Art. Sociological Methods & Research, 50(1), 3-44.
[17]. Kamiran, F., & Calders, T. (2012). Data preprocessing techniques for classification without discrimination. Knowledge and information systems, 33(1), 1-33.
Cite this article
Hu,Z. (2025). Fairness-Aware Credit Default Prediction: Addressing Educational Bias in Machine Learning Models. Applied and Computational Engineering,154,152-160.
Data availability
The datasets used and/or analyzed during the current study will be available from the authors upon reasonable request.
Disclaimer/Publisher's Note
The statements, opinions and data contained in all publications are solely those of the individual author(s) and contributor(s) and not of EWA Publishing and/or the editor(s). EWA Publishing and/or the editor(s) disclaim responsibility for any injury to people or property resulting from any ideas, methods, instructions or products referred to in the content.
About volume
Volume title: Proceedings of CONF-SEML 2025 Symposium: Machine Learning Theory and Applications
© 2024 by the author(s). Licensee EWA Publishing, Oxford, UK. This article is an open access article distributed under the terms and
conditions of the Creative Commons Attribution (CC BY) license. Authors who
publish this series agree to the following terms:
1. Authors retain copyright and grant the series right of first publication with the work simultaneously licensed under a Creative Commons
Attribution License that allows others to share the work with an acknowledgment of the work's authorship and initial publication in this
series.
2. Authors are able to enter into separate, additional contractual arrangements for the non-exclusive distribution of the series's published
version of the work (e.g., post it to an institutional repository or publish it in a book), with an acknowledgment of its initial
publication in this series.
3. Authors are permitted and encouraged to post their work online (e.g., in institutional repositories or on their website) prior to and
during the submission process, as it can lead to productive exchanges, as well as earlier and greater citation of published work (See
Open access policy for details).
References
[1]. Consumer Financial Protection Bureau. (2023). The consumer credit card market. U.S. Government. Retried from https://www.consumerfinance.gov/data-research/research-reports/the-consumer-credit-card-market/.
[2]. Bayeh, B., Cubides, E., & O’Brien, S. (2024). c. Federal Reserve Financial Services.
[3]. Stavins, J. (2023). Credit card spending and borrowing since the start of the COVID-19 pandemic. Federal Reserve Bank of Boston Research Paper Series Current Policy Perspectives Paper, 97187.
[4]. Barnes, K., Bopst, C., & Driscoll, J. (2025). Predicting Credit Card Delinquency Rates.
[5]. Broadbent, G. (2025). Credit card charge-offs totaled $46B through Q3 2024—Here’s what to expect in 2025. eMarketer.
[6]. Yeh, I. C., & Lien, C. H. (2009). The comparisons of data mining techniques for the predictive accuracy of probability of default of credit card clients. Expert systems with applications, 36(2), 2473-2480.
[7]. Esenogho, E., Mienye, I. D., Swart, T. G., et al. (2022). A neural network ensemble with feature engineering for improved credit card fraud detection. IEEE access, 10, 16400-16407.
[8]. Faraj, A. A., Mahmud, D. A., & Rashid, B. N. (2021). Comparison of different ensemble methods in credit card default prediction. UHD Journal of Science and Technology, 5(2), 20-25.
[9]. Bhandary, R., & Ghosh, B. K. (2025). Credit Card Default Prediction: An Empirical Analysis on Predictive Performance Using Statistical and Machine Learning Methods. Journal of Risk and Financial Management, 18(1), 23.
[10]. Li, Y., Yi, J., Chen, H., et al. (2021). Theory and application of artificial intelligence in financial industry. Data Science in Finance and Economics, 1(2), 96-116.
[11]. Pham, N., Do, M. K., Dai, T. V., Hung, P. N., & Nguyen-Duc, A. (2025). FAIREDU: A multiple regression-based method for enhancing fairness in machine learning models for educational applications. Expert Systems with Applications, 269, 126219.
[12]. Brodersen, K. H., Ong, C. S., Stephan, K. E., & Buhmann, J. M. (2010). The balanced accuracy and its posterior distribution. In 2010 20th international conference on pattern recognition, 3121-3124.
[13]. Dwork, C., Hardt, M., Pitassi, T., Reingold, O., & Zemel, R. (2012). Fairness through awareness. In Proceedings of the 3rd innovations in theoretical computer science conference, 214-226.
[14]. Hardt, M., Price, E., & Srebro, N. (2016). Equality of opportunity in supervised learning. Advances in neural information processing systems, 29.
[15]. Pleiss, G., Raghavan, M., Wu, F., Kleinberg, J., & Weinberger, K. Q. (2017). On fairness and calibration. Advances in neural information processing systems, 30.
[16]. Berk, R., Heidari, H., Jabbari, S., Kearns, M., & Roth, A. (2018). Fairness in Criminal Justice Risk Assessments: The State of the Art. Sociological Methods & Research, 50(1), 3-44.
[17]. Kamiran, F., & Calders, T. (2012). Data preprocessing techniques for classification without discrimination. Knowledge and information systems, 33(1), 1-33.