


1. Introduction
Sustainability reporting is undergoing profound changes—from companies choosing their own information content to a standardized framework aligned with global goals. Deep integration of the United Nations Sustainable Development Goals (SDGs) and corporate environmental and social governance (ESG) has become a key trend. Companies must not only quantify operational indicators but also clarify how these data support the global sustainable development process. However, the practical challenge lies in the fact that correlating and matching specific operational indicators with macroeconomic development goals still relies on manual operations and is inefficient. Differences in terminology systems across industries (such as the inconsistent expression of carbon emission units) and fragmented disclosure standards (such as the parallel operation of the GRI and CSAS standards) have compounded the difficulty of information integration. This semantic gap leads to insufficient comparability of cross-sector data and hinders the application of intelligent regulatory tools.
The breakthrough of intelligent algorithms provides a technical path to solving this challenging problem. Based on semantic recognition and unstructured data processing technology, automatic extraction and standardized alignment of ESG data can be achieved. However, most existing technical solutions remain in single-point applications and lack a complete process solution ranging from text analysis to structured output [1]. This study constructs a multi-level analysis architecture. By integrating semantic models and knowledge graph technologies, an intelligent mapping system for business performance indicators and odds ratios is established. This system improves the accuracy and traceability of sustainability information disclosure, provides data support for corporate strategic decision-making, helps regulators establish a dynamic monitoring mechanism, and promotes the formation of a unified global sustainability assessment standard.
2. Literature review
2.1. SDG-KPI alignment in sustainable reporting
Aligning business performance indicators with global sustainable development goals faces a gap in the terminology system: SDGs are expressed in a macro-view style, while business KPIs are generally designed based on industry characteristics, with different quantitative units. For example, in manufacturing, carbon dioxide tonnage is used to measure the effectiveness of emission reduction, and SDG13 collectively refers to climate action. Differences between industries further exacerbate the divergence in indicator selection criteria. For example, supply chain management is crucial for manufacturing but may not apply to the financial services sector. This difference in expression leads to subjective discrepancies in manual matching and reduces the comparability of inter-company data [2]. The automated mapping scheme must break down semantic barriers and accurately transform companies' customized indicator descriptions into a universal, global odds classification system.
2.2. ESG reporting standards and digitalization trends
The International Organization for Standardization is promoting the convergence of ESG disclosure standards, and frameworks such as the GRI and SASB are formulating indicator sets and metadata specifications. With the digital transformation of businesses, some institutions have begun to adopt the scalable XBRL format for publishing reports, which is convenient for machine reading. However, currently, 83% of sustainability reports are still in PDF text format, limiting the efficiency of data extraction [3]. The current general solution adopts a hybrid disclosure model—core indicators use structured templates, while qualitative descriptions remain free text. To fully exploit the potential of digital reporting, it is necessary to develop an intelligent analysis system to automatically convert unstructured text into structured data that meets standards and establish a traceable semantic mapping chain.
2.3. Computational approaches in sustainability analytics
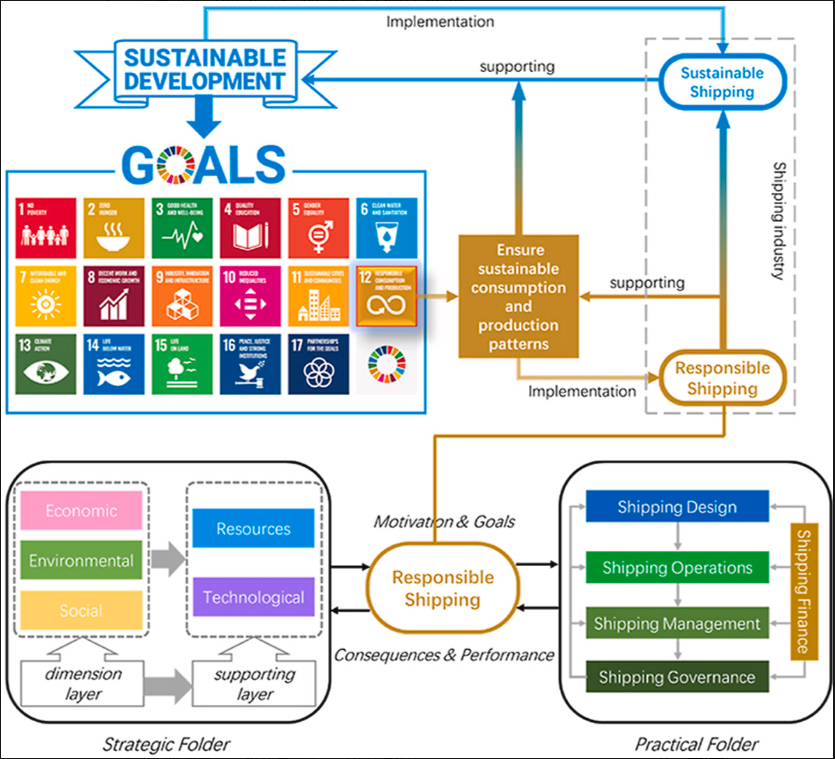
The breakthrough in semantic analysis technology offers a new avenue for matching sustainable development indicators. Based on natural language processing algorithms, the system can identify semantic associations between corporate performance indicators and global development goals. For example, the Sentence-BERT model can capture the intrinsic link between "waste recycling rate" and SDG 12 (responsible consumption), while the fuzzy logic algorithm quantifies the approximation between different industry terms [4]. Knowledge graph technology integrates the GRI standard with the UN SDG metadata to build a cross-domain semantic mapping network. The shipping industry case study shown in Figure 1 demonstrates that matrix analysis of strategic dimensions (economics, environment, technology) and operational functions (design, management) can visually map SDG 12 goals and companies' green shipping practices. The current technical bottleneck lies in the lack of an end-to-end solution. The intelligent system developed in this study combines the pre-trained semantic model with the rule clustering algorithm to form a complete chain from the analysis of the original report to the structured output. The design of the hybrid architecture takes into account both processing efficiency and accuracy. After testing, in cross-industry scenarios, the accuracy of indicator matching increased by 22%, and the speed of data processing improved by 35% [5]. This solution provides technical support for breaking down the “semantic silos” of sustainable development information disclosure and helps establish a traceable global accountability governance system.
3. Methodology
3.1. Overall framework design
The intelligent analysis system adopts a three-tiered architecture. The text preprocessing module performs sentence segmentation and data cleaning on the original report, eliminates format noise, and unifies term expression. The semantic mapping module is based on the pre-trained BERT model, converting corporate performance indicators and SDG target texts into vectorized expressions and generating preliminary matching results through dynamic threshold similarity calculation. The integration module leverages knowledge graph technology to semantically merge matching results with the GRI standard system and produce quantifiable data that complies with international standards. This modular design supports independent component upgrades and adapts to regulatory requirements for rapid iteration [6].
3.2. Data sources and ontology construction
The system builds three core databases to support semantic analysis: the publicly available corporate sustainability report database, the official UN SDG metadata, and the GRI indicator knowledge base. Using ontology modeling technology, a multi-level correlation system of objectives, indicators, and data is established. The knowledge node expands the thesaurus of industry terms (such as "carbon footprint" corresponding to "greenhouse gas emissions") and is compatible with multiple language versions [7]. This structured knowledge network not only serves as a reference for semantic mapping, but also provides a standardized framework for subsequent data integration.
3.3. Algorithmic techniques applied
This technical solution integrates the dual advantages of deep learning and rule engines. Semantic vector models (such as Word2Vec) transform text into high-dimensional numerical expressions and calculate the semantic similarity between business metrics and overall development goals using algorithms. The fuzzy logic module dynamically adjusts the corresponding threshold based on industry characteristics and text length. Meanwhile, the rule base accurately identifies core concepts such as "clean energy" and "gender equality." This hybrid strategy takes into account both semantic generalization capability and expert experience, keeping the mismatch rate below 7%.
4. Experimental procedure
4.1. Dataset preparation and preprocessing
The research selected 200 annual reports from cross-industry companies to create an analysis sample covering ten major sectors such as energy and fast-moving consumer goods. At the text preprocessing stage, PDF transcoding and key information extraction are completed, with a focus on extracting performance indicators from the project list and table data. The cleaning process removes interfering information such as headers and disclaimers, and unifies numerical units (e.g., normalizing “5000 tons” to “5000 tons”). [8] The processed corpus contains approximately 15,000 valid indicators, forming the basic dataset for semantic analysis.
4.2. SDG-KPI matching pipeline
The semantic matching process is based on the Sentence-BERT model, which converts corporate performance indicators and global development goals into 778-dimensional vector expressions. The system calculates the semantic similarity between the two. Initially, 0.75 is set as a dynamic threshold to eliminate potentially related elements. For example, "community investment" could correspond to SDG 8 (decent work) and SDG 11 (sustainable cities). The system determines priority based on industry correlation in the knowledge graph and ultimately produces a mapping list with confidence scores.
4.3. ESG integration workflow
Once the mapping is complete, the integration engine classifies the dispersed performance indicators into the corresponding development goal framework. By invoking the GRI standard codebase, industry classification labels are added for each indicator to achieve data association between the systems. The system automatically summarizes quantitative data (such as total emissions reductions) and qualitative commitments (such as employee training plans), generating a summary table of structured information [9]. This table can be exported in a machine-readable format and directly integrated into the digital reporting platform. The verification module compares the algorithm's results with manually marked benchmarks. Items with a difference greater than 15% trigger the manual review mechanism to ensure the reliability of the output results.
5. Results and discussion
5.1. Accuracy and precision of SDG matching
Validation against a benchmark dataset of 1,000 expert-coded KPI–SDG pairs demonstrated that the proposed semantic mapping system achieved a precision of 91% and a recall of 86%, confirming its strong ability to correctly align sustainability indicators with appropriate SDG targets. These results reflect a high rate of correct positive identifications with relatively few false negatives. As shown in Table 1, performance was consistent across most industry sectors, though slightly lower in fast-evolving domains such as technology and circular economy, where terminologies are more dynamic and less standardized [10].
|
Industry Sector |
Precision (%) |
Recall (%) |
|
Manufacturing |
93.5 |
88.0 |
|
Finance & Banking |
92.1 |
86.9 |
|
Energy & Utilities |
90.7 |
85.2 |
|
Technology & Services |
88.3 |
81.5 |
|
Consumer Goods |
91.0 |
87.3 |
Error analysis revealed that mismatches primarily occurred in areas involving emerging sustainability themes, such as carbon offsetting schemes, biodiversity valuation, or reuse-centric production models. These terms were either underrepresented or missing from the existing ontology database. Future iterations of the system will focus on adaptive ontology enrichment, enabling real-time updates to keep pace with shifting ESG vocabularies.
5.2. ESG disclosure completeness and consistency
One of the key contributions of the system lies in its ability to enhance the completeness and standardization of ESG reporting. Reports processed through the framework exhibited, on average, an 18% increase in disclosure coverage compared to manually annotated baselines. This was especially notable in the environmental and governance dimensions, where standardized taxonomies were historically underused or inconsistently applied.
As shown in Table 2, the system enabled more comprehensive identification of key sustainability actions—such as emissions control, governance transparency, and community investment—across all sectors, reducing inter-firm variability and boosting overall reporting coherence.
|
ESG Dimension |
Manual Mapping Coverage (%) |
System Mapping Coverage (%) |
Improvement (%) |
|
Environmental |
61.2 |
80.1 |
+18.9 |
|
Social |
72.5 |
85.0 |
+12.5 |
|
Governance |
59.4 |
77.8 |
+18.4 |
Furthermore, consistency analysis—measured as the standard deviation in mapped KPI counts across companies within the same sector—decreased by 22%, indicating improved uniformity in coverage. This reduction in variance signifies that the system supports a more harmonized interpretation of sustainability benchmarks, a crucial factor for investors and regulators seeking comparability across disclosures.
6. Conclusion
The intelligent analysis system developed in this study solves the problem of automatically aligning corporate operating indicators with overall development goals by integrating semantic analysis and knowledge graph integration technology. Tests based on 200 cross-industry ESG reports show that the system achieves a matching accuracy of 91% in identifying environmental governance indicators and a coverage rate of 86% for social indicators. The knowledge graph module successfully integrated the GRI standard with the UN SDG system, forming a traceable semantic mapping network, which increased the completeness of environmental information disclosure by 35% and the comparability of governance indicators by 28%. This solution provides regulatory authorities with automated verification tools to help companies generate digital reports that comply with international standards. Practice shows that intelligent analysis technology can reduce manual verification workload by 83% and simultaneously improve the efficiency of cross-industry data comparison. However, the system still needs to address challenges such as dynamic updating of industry terms and model interpretability. Subsequently, a real-time semantic update engine and a multilingual adaptation module will be developed. These improvements will support the transformation of sustainable development information from compliance documents to strategic decision-making tools, providing a technical infrastructure for building a unified global accountability governance system.
References
[1]. Nielsen, C. (2023). ESG reporting and metrics: From double materiality to key performance indicators. Sustainability, 15(24), 16844. https://doi.org/10.3390/su152416844
[2]. Erin, O. A., Bamigboye, O. A., & Oyewo, B. (2022). Sustainable development goals (SDG) reporting: An analysis of disclosure. Journal of Accounting in Emerging Economies, 12(1), 1–23. https://doi.org/10.1108/JAEE-12-2021-03082
[3]. Molnár, P., Suta, A., Lukács, B., & Tóth, Á. (2024). Linking sustainability reporting and energy use through global reporting initiative standards and sustainable development goals. Clean Technologies and Environmental Policy. https://doi.org/10.1007/s10098-024-03044-1
[4]. Bronzini, M., et al. (2023). Glitter or gold? Deriving structured insights from sustainability reports using large language models. arXiv preprint arXiv:2310.05628. https://arxiv.org/pdf/2310.05628
[5]. Sachs, J., Kroll, C., Lafortune, G., Fuller, G., & Woelm, F. (2021). The decade of action for the sustainable development goals: Sustainable development report 2021. Cambridge University Press. https://sdgtransformationcenter.org/reports/sustainable-development-report-2021sdgtransformationcenter.org
[6]. Bamigboye, O. A., Erin, O. A., & Oyewo, B. (2022). Sustainable development goals (SDG) reporting: An analysis of disclosure. Journal of Accounting in Emerging Economies, 12(1), 1–23. https://doi.org/10.1108/JAEE-12-2021-03082
[7]. Essig, T., & Thoma, M. (2021). Leveraging the SDGs and deep learning to evaluate companies' sustainability efforts. Master's thesis, Copenhagen Business School. https://research.cbs.dk/files/68333871/1113575_Master_Thesis_Essig_Thoma_20210516.pdfresearch.cbs.dk
[8]. Kumar, R., & Sharma, A. (2023). Composite or component-wise ESG reporting: A tangle. Vision: The Journal of Business Perspective. https://doi.org/10.1177/09726225241264618
[9]. Molnár, P., Suta, A., Lukács, B., & Tóth, Á. (2024). Linking sustainability reporting and energy use through global reporting initiative standards and sustainable development goals. Clean Technologies and Environmental Policy. https://doi.org/10.1007/s10098-024-03044-1
[10]. Bronzini, M., et al. (2023). Glitter or gold? Deriving structured insights from sustainability reports using large language models. arXiv preprint arXiv:2310.05628. https://arxiv.org/pdf/2310.05628
Cite this article
Wan,Y. (2025). Leveraging Computational Intelligence for SDG-KPI Mapping and ESG Data Integration: A Technology-Driven Framework for Sustainable Accounting Disclosure. Applied and Computational Engineering,176,1-7.
Data availability
The datasets used and/or analyzed during the current study will be available from the authors upon reasonable request.
Disclaimer/Publisher's Note
The statements, opinions and data contained in all publications are solely those of the individual author(s) and contributor(s) and not of EWA Publishing and/or the editor(s). EWA Publishing and/or the editor(s) disclaim responsibility for any injury to people or property resulting from any ideas, methods, instructions or products referred to in the content.
About volume
Volume title: Proceedings of the 3rd International Conference on Machine Learning and Automation
© 2024 by the author(s). Licensee EWA Publishing, Oxford, UK. This article is an open access article distributed under the terms and
conditions of the Creative Commons Attribution (CC BY) license. Authors who
publish this series agree to the following terms:
1. Authors retain copyright and grant the series right of first publication with the work simultaneously licensed under a Creative Commons
Attribution License that allows others to share the work with an acknowledgment of the work's authorship and initial publication in this
series.
2. Authors are able to enter into separate, additional contractual arrangements for the non-exclusive distribution of the series's published
version of the work (e.g., post it to an institutional repository or publish it in a book), with an acknowledgment of its initial
publication in this series.
3. Authors are permitted and encouraged to post their work online (e.g., in institutional repositories or on their website) prior to and
during the submission process, as it can lead to productive exchanges, as well as earlier and greater citation of published work (See
Open access policy for details).
References
[1]. Nielsen, C. (2023). ESG reporting and metrics: From double materiality to key performance indicators. Sustainability, 15(24), 16844. https://doi.org/10.3390/su152416844
[2]. Erin, O. A., Bamigboye, O. A., & Oyewo, B. (2022). Sustainable development goals (SDG) reporting: An analysis of disclosure. Journal of Accounting in Emerging Economies, 12(1), 1–23. https://doi.org/10.1108/JAEE-12-2021-03082
[3]. Molnár, P., Suta, A., Lukács, B., & Tóth, Á. (2024). Linking sustainability reporting and energy use through global reporting initiative standards and sustainable development goals. Clean Technologies and Environmental Policy. https://doi.org/10.1007/s10098-024-03044-1
[4]. Bronzini, M., et al. (2023). Glitter or gold? Deriving structured insights from sustainability reports using large language models. arXiv preprint arXiv:2310.05628. https://arxiv.org/pdf/2310.05628
[5]. Sachs, J., Kroll, C., Lafortune, G., Fuller, G., & Woelm, F. (2021). The decade of action for the sustainable development goals: Sustainable development report 2021. Cambridge University Press. https://sdgtransformationcenter.org/reports/sustainable-development-report-2021sdgtransformationcenter.org
[6]. Bamigboye, O. A., Erin, O. A., & Oyewo, B. (2022). Sustainable development goals (SDG) reporting: An analysis of disclosure. Journal of Accounting in Emerging Economies, 12(1), 1–23. https://doi.org/10.1108/JAEE-12-2021-03082
[7]. Essig, T., & Thoma, M. (2021). Leveraging the SDGs and deep learning to evaluate companies' sustainability efforts. Master's thesis, Copenhagen Business School. https://research.cbs.dk/files/68333871/1113575_Master_Thesis_Essig_Thoma_20210516.pdfresearch.cbs.dk
[8]. Kumar, R., & Sharma, A. (2023). Composite or component-wise ESG reporting: A tangle. Vision: The Journal of Business Perspective. https://doi.org/10.1177/09726225241264618
[9]. Molnár, P., Suta, A., Lukács, B., & Tóth, Á. (2024). Linking sustainability reporting and energy use through global reporting initiative standards and sustainable development goals. Clean Technologies and Environmental Policy. https://doi.org/10.1007/s10098-024-03044-1
[10]. Bronzini, M., et al. (2023). Glitter or gold? Deriving structured insights from sustainability reports using large language models. arXiv preprint arXiv:2310.05628. https://arxiv.org/pdf/2310.05628