


1. Introduction
Stroke is a disease, resulting multiple symptoms including paralysis, difficulty speaking, and cognitive impairments. It could be caused by a sudden brain damage and the temporary blood supply disorder of the brain [1,2]. The exact number of people affected by stroke varies by region, but it is estimated that, each year, nearly 15 million patients suffering from it [3,4]. Besides, approximately 5 million people will die from it, and about 5 million people will be disabled. The incidence of stroke is increasing globally, in part due to an aging population and an increase in risk factors such as high blood pressure, obesity, and diabetes. However, many strokes are likely to be prevented by living health life such as regular exercise, healthy eating, and avoiding smoking. Therefore, early recognition and treatment of stroke symptoms can significantly improve outcomes for patients. Among the different methods of prediction, machine learning has emerged as a promising tool in stroke prediction, providing a powerful means of analyzing large volumes of data and identifying complex patterns.
Recently, there are many researches focusing in the application of machine learning to stroke prediction, with a growing body of evidence demonstrating its potential to improve both the accuracy and speed of diagnosis [5,6]. This has led to increased interest in machine learning as a potential tool for stroke prevention, with researchers exploring the use of various types of data, including medical imaging, electronic health records, and wearable devices, to develop predictive models that can identify individuals with high stroke probability [7]. One of the key advantages of machine learning is its ability to integrate multiple sources of data. Unlike traditional methods of stroke prediction, which rely on a limited set of risk factors such as age, blood pressure, and cholesterol levels, machine learning algorithms can analyze a wide range of data sources. By analyzing these complex datasets, machine learning algorithms can identify subtle patterns and relationships, providing a more accurate and nuanced assessment of stroke risk [8]. Another key advantage of machine learning in stroke prediction is the capacity of handling large volumes of data rapidly and efficiently. When achieving more digital health data, including electronic health records and remote monitoring devices, the amount of data available for analysis is growing exponentially. Machine learning algorithms can rapidly sift through these vast datasets, identifying key predictors of stroke risk and providing clinicians with real-time information that can inform decision-making. Machine learning algorithms can also continuously learn and improve over time, adapting to new data and refining their predictive models [9]. This is particularly important in stroke prediction, where new risk factors and biomarkers are constantly being discovered. Machine learning algorithms can incorporate these new data sources and update their models accordingly, providing clinicians with the most up-to-date and accurate information on stroke risk.
2. Method
2.1. Dataset
The dataset used in this project is a stroke dataset, which contains information on 5110 patients from a healthcare center in India [10]. Out of the 5110 patients, 249 were identified as having a stroke, which corresponds to a stroke incidence rate of 4.9%. The dataset has 12 columns that provide details about the patients, such as heart disease, age, body mass index, gender, residence type, work type, glucose level, hypertension, marital status, smoking status, and whether they had a stroke. To understand the data, the distributions of numerical features could be examined like age, body mass index and glucose level, by using histograms and kernel density plots. The age distribution, as demonstrated in Figure 1, could be found that the age distribution was positively skewed with a peak between 50 and 60 years. Figure 2 shows the glucose and body mass index distribution. The glucose level distribution was approximately normal with a peak around 80-100, while the body mass index distribution was right-skewed with a peak between 25 and 30.
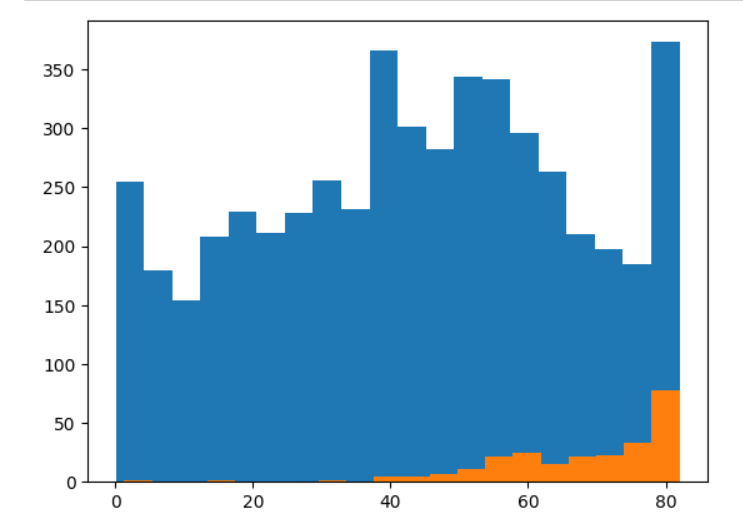
Figure 1. Age distribution of stroke.
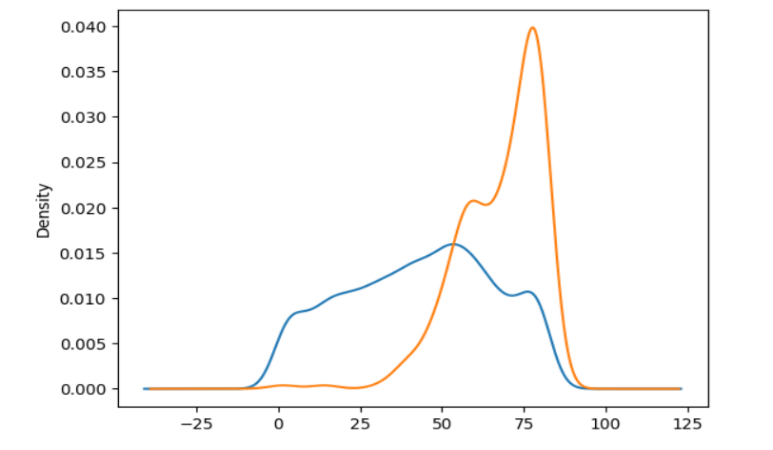
Figure 2. Glucose level and body mass index distribution of stroke.
Moreover, this work explored the correlation between the numerical features by creating a heatmap. It could be observed that a weak positive correlation between age and stroke occurrence, whereas the correlation between other numerical features and stroke was negligible.
To address the significant imbalance in the distribution of the positive and negative classes, the RandomOverSampler module from the imblearn library was used to perform oversampling on the dataset. The fit_resample() function was applied to generate synthetic samples for the minority class, resulting in a balanced dataset. Dataset was then randomly spited as training and testing sets, and testing data covers 30% of all data.
2.2. Models
2.2.1. Logistic regression. Data is trained and predicted by using a logistic regression model. Logistic regression model is a probability-based classification model. A classification boundary (hyperplane) is obtained by fitting the characteristics and labels of sample data to perform classification prediction on new data.
2.2.2. Decision tree. The decision tree is used to train and predict the data. Decision tree is a classification model based on tree structure. By dividing the sample data into different subsets and making decisions recursively on each subset, a classification result is finally obtained.
2.2.3. KNN. KNN algorithm is used to train and predict data. It is a classification model grounded from distance measurement. For new data, K nearest neighbors are selected according to the distance between them and each sample in the training set, and classification prediction is made according to the labels of neighbors.
2.2.4. Random forest. It is used to train and predict data. It composes many decision trees and is an integrated learning algorithm. It merges multiple trees by randomly selecting features and samples, and integrates them by means of voting or taking average values to obtain final classification results.
2.2.5. SVM. It is used to train and predict the data. The SVM is a classification model based on interval maximization. By finding an optimal classification hyperplane, the interval between different categories is maximized, and the new data is classified and predicted.
2.2.6. Naive Bayes. Use naive Bayes algorithm to train and predict data. It is based on Bayes theorem for classification. It learns the features and labels of sample data, obtains the prior probability of categories and conditional probability of each feature, and classifies and predicts new data.
2.3. Evaluation metrices
The evaluation metrics were calculated using the test set, which comprised 30% of the original dataset. There are four matrices including accuracy, indicating the percentage of the correctly predicted samples; precision, measureing the percentage of true positive among entire positive predictions generated from the model; recall calculates the percentage of true positive results among all actual positive cases; F1-score, defining as the harmonic mean of precision and recall, and is a useful metric when the dataset is imbalanced.
3. Result
3.1. Correlation analysis
The authors visualized the data into several tables for correlation analysis. Firstly, the number of observations is calculated and the percentage of stroke cases for different age ranges, and the resulting distribution is demonstrated in Table 1.
Table 1. Percentage of stroke cases in different age ranges.
age_range | count | sum | percent_stroke | |
0 | (0, 18] | 184 | 0 | 0.000000 |
1 | (18, 35] | 908 | 1 | 0.110132 |
2 | (35, 50] | 1430 | 12 | 0.839161 |
3 | (50, 65] | 1521 | 89 | 5.853237 |
4 | (65, 80] | 1227 | 176 | 14.346895 |
5 | (80, 100] | 840 | 177 | 21.071429 |
The age ranges could be adjusted by changing the age_bins variable as needed. The Table 1 shows the distribution of stroke patients in different age ranges. It could be observed that age is a risk factor for stroke.
This work also used a heat map to show the correlation between each pair of variables in the data set, with the intensity between them represented by color:
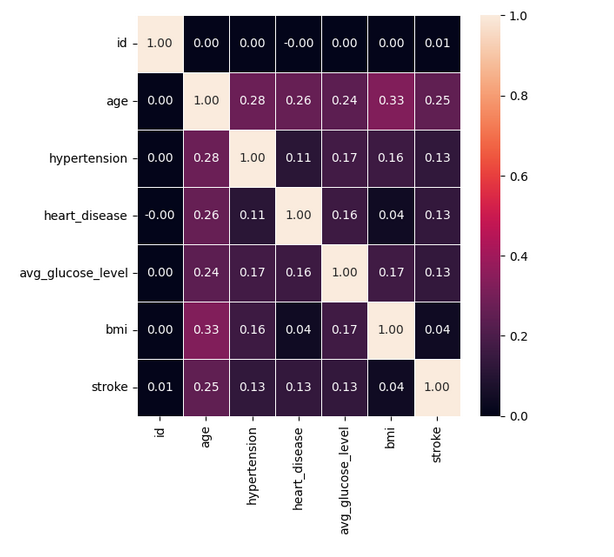
Figure 3. Feature correlations.
The correlation coefficient is larger than -1 and smaller than 1. As for the value, -1 and 1 represents complete negative and positive correlation, 0 means there is no correlation. If a value is close to 1, it means the correlation between two features is very high. From Figure 3, it could be observed that there is a strong correlation between age and hypertension, as well as a clear correlation between average blood pressure and hypertension. In addition, it could be saw that a weak correlation between stroke and all characteristics except gender.
3.2. Comparison of model results
According to these results shown in Table 2, the SVM model performs best at 99.97% accuracy. The Random Forest model also performs very well, with an accuracy of 98.94%. Other models performed relatively poorly, among which GaussianNB model performed the worst, with an accuracy of only 62.60%. In addition, Precision, Recall and F1-score are also one of the indexes leveraged to measure the model performance, which can be considered together with the accuracy. However, according to the above results, the performance of each index is basically consistent with the accuracy.
Table 2. Performacnes of different models.
Accuracy | Precision | Recall | F1-score | |
Logistic regression | 78% | 78% | 78% | 78% |
Decision tree | 98% | 98% | 98% | 98% |
KNN | 92% | 93% | 92% | 92% |
Random forest | 99% | 99% | 99% | 99% |
SVM | 100% | 100% | 100% | 100% |
Naive Bayes | 63% | 78% | 63% | 57% |
4. Discussion
4.1. Reasons for differences in model performance
There are several possible reasons why the results vary from model to model. Firstly, different feature selection: Different models may choose different features as inputs, so it is possible to get different results even when using the same data set. Secondly, differences in the models themselves: Different models have different algorithms and parameters, which may have different impacts on the degree of fitting and prediction effect of the data set. For example, the learning style and model structure of decision tree model and neural network model are very different. Thirdly, different data set quality and sample quantity: Different models are on the same data set. If the data quality and sample quantity are different, the performance of the model may be affected. For example, when there are missing values or outliers in the dataset, the results of the algorithm may be affected.
Therefore, in model selection and comparison, the above factors should be taken into account, and the appropriate model should be selected based on specific problems and data sets.
4.2. Deficiency of model
Deep learning has the characteristics of wide applicability, automatic feature extraction, high performance and strong scalability. Shortcomings of the machine learning model used in this experiment are as follows. Firstly, feature Engineering requires manual design: Machine learning models often require manual design of features, which requires domain knowledge and expertise, and poorly designed models can result in poor performance. Secondly, weak ability to process large-scale data: the complexity of machine learning model is relatively low, so it has relatively weak ability to process large-scale data. Moreover, when the dimension of feature space is high, the model is prone to overfitting. Thirdly, poor modelling of nonlinear relationships: Machine learning models often use linear models, which are not good at modelling nonlinear relationships.
5. Conclusion
In conclusion, this work successfully built several machine learning models to predict the occurrence of stroke in patients by using demographic, health, and lifestyle information. This study highlights the effectiveness of machine learning algorithms in predicting stroke and provides useful insights for early stroke diagnosis and prevention. Among the six models, the Support Vector Machine classifier’s accuracy is 99.97%, the Decision Tree classifier’s accuracy is 97.53%, the K-Nearest Neighbor classifier’s accuracy is 92.5%, the Logistic Regression classifier’s accuracy is 78.06%, the Random Forest classifier’s accuracy is 98.94%, and the Naive Bayes classifier’s accuracy is 62.60%. Obviously, the Support Vector Machine classifier was the best performing model with the highest accuracy. The results suggest that the demographic, health, and lifestyle information of patients can be used to predict the stroke with high accuracy, and this information can be used to prevent or mitigate the risk of stroke in patients. The model is valuable in the medical industry for quickly and efficiently screening potential stroke patients from population. This refines the gap in the combination of domestic medical industry and artificial intelligence. The model has problems such as weak ability to handle large-scale data and poor modelling of nonlinear relationships that needs improvements.
References
[1]. Belagaje, S. R. (2017). Stroke rehabilitation. Continuum: Lifelong Learning in Neurology, 23(1), 238-253.
[2]. Lo, E. H., Dalkara, T., & Moskowitz, M. A. (2003). Mechanisms, challenges and opportunities in stroke. Nature reviews neuroscience, 4(5), 399-414.
[3]. Kim, J., Thayabaranathan, T., Donnan, G. A., Howard, G., Howard, V. J., et al. (2020). Global stroke statistics 2019. International Journal of Stroke, 15(8), 819-838.
[4]. Virani, S. S., Alonso, A., Aparicio, H. J., Benjamin, E. J., Bittencourt, M. S., et al. (2021). Heart disease and stroke statistics—2021 update: a report from the American Heart Association. Circulation, 143(8), e254-e743.
[5]. Stinear, C. M., Smith, M. C., & Byblow, W. D. (2019). Prediction tools for stroke rehabilitation. Stroke, 50(11), 3314-3322.
[6]. Singh, M. S., & Choudhary, P. (2017). Stroke prediction using artificial intelligence. In 2017 8th Annual Industrial Automation and Electromechanical Engineering Conference (IEMECON), 158-161.
[7]. Emon, M. U., Keya, M. S., Meghla, T. I., Rahman, M. M., Al Mamun, M. S., & Kaiser, M. S. (2020). Performance analysis of machine learning approaches in stroke prediction. In 2020 4th International Conference on Electronics, Communication and Aerospace Technology (ICECA), 1464-1469.
[8]. Jordan, M. I., & Mitchell, T. M. (2015). Machine learning: Trends, perspectives, and prospects. Science, 349(6245), 255-260.
[9]. Bell, J. (2022). What is machine learning?. Machine Learning and the City: Applications in Architecture and Urban Design, 207-216.
[10]. Fedesoriano. (2021) Stroke Prediction Dataset, URL: https://www.kaggle.com/datasets/fedesoriano/stroke-prediction-dataset
Cite this article
Li,Y.;Wang,Z.;Wu,T.;Zhou,T. (2023). Comparison of Six Machine Learning Algorithms for Stroke Risk Estimation. Applied and Computational Engineering,8,556-561.
Data availability
The datasets used and/or analyzed during the current study will be available from the authors upon reasonable request.
Disclaimer/Publisher's Note
The statements, opinions and data contained in all publications are solely those of the individual author(s) and contributor(s) and not of EWA Publishing and/or the editor(s). EWA Publishing and/or the editor(s) disclaim responsibility for any injury to people or property resulting from any ideas, methods, instructions or products referred to in the content.
About volume
Volume title: Proceedings of the 2023 International Conference on Software Engineering and Machine Learning
© 2024 by the author(s). Licensee EWA Publishing, Oxford, UK. This article is an open access article distributed under the terms and
conditions of the Creative Commons Attribution (CC BY) license. Authors who
publish this series agree to the following terms:
1. Authors retain copyright and grant the series right of first publication with the work simultaneously licensed under a Creative Commons
Attribution License that allows others to share the work with an acknowledgment of the work's authorship and initial publication in this
series.
2. Authors are able to enter into separate, additional contractual arrangements for the non-exclusive distribution of the series's published
version of the work (e.g., post it to an institutional repository or publish it in a book), with an acknowledgment of its initial
publication in this series.
3. Authors are permitted and encouraged to post their work online (e.g., in institutional repositories or on their website) prior to and
during the submission process, as it can lead to productive exchanges, as well as earlier and greater citation of published work (See
Open access policy for details).
References
[1]. Belagaje, S. R. (2017). Stroke rehabilitation. Continuum: Lifelong Learning in Neurology, 23(1), 238-253.
[2]. Lo, E. H., Dalkara, T., & Moskowitz, M. A. (2003). Mechanisms, challenges and opportunities in stroke. Nature reviews neuroscience, 4(5), 399-414.
[3]. Kim, J., Thayabaranathan, T., Donnan, G. A., Howard, G., Howard, V. J., et al. (2020). Global stroke statistics 2019. International Journal of Stroke, 15(8), 819-838.
[4]. Virani, S. S., Alonso, A., Aparicio, H. J., Benjamin, E. J., Bittencourt, M. S., et al. (2021). Heart disease and stroke statistics—2021 update: a report from the American Heart Association. Circulation, 143(8), e254-e743.
[5]. Stinear, C. M., Smith, M. C., & Byblow, W. D. (2019). Prediction tools for stroke rehabilitation. Stroke, 50(11), 3314-3322.
[6]. Singh, M. S., & Choudhary, P. (2017). Stroke prediction using artificial intelligence. In 2017 8th Annual Industrial Automation and Electromechanical Engineering Conference (IEMECON), 158-161.
[7]. Emon, M. U., Keya, M. S., Meghla, T. I., Rahman, M. M., Al Mamun, M. S., & Kaiser, M. S. (2020). Performance analysis of machine learning approaches in stroke prediction. In 2020 4th International Conference on Electronics, Communication and Aerospace Technology (ICECA), 1464-1469.
[8]. Jordan, M. I., & Mitchell, T. M. (2015). Machine learning: Trends, perspectives, and prospects. Science, 349(6245), 255-260.
[9]. Bell, J. (2022). What is machine learning?. Machine Learning and the City: Applications in Architecture and Urban Design, 207-216.
[10]. Fedesoriano. (2021) Stroke Prediction Dataset, URL: https://www.kaggle.com/datasets/fedesoriano/stroke-prediction-dataset