


1. Introduction
With the continuous maturation of deep learning technology, it has been widely applied in the field of autonomous driving. For instance, many teams such as Ying [1], Saikat [2], and Gyu [3] have utilized the convolutional neural network model within it in recognition and detection tasks. To ensure the safety of autonomous driving, the reliability of convolutional neural network models has become a prerequisite for guaranteeing driving safety. In particular, the traffic sign recognition system is the key to enabling self-driving cars to abide by traffic rules and ensuring the safety of drivers and pedestrians [4]. However, most of the current research directions are focused on optimizing models to enhance judgment accuracy. Research on malicious attacks, such as adversarial samples, has relatively less impact on model judgment accuracy. Therefore, to ensure the safety of autonomous driving, it is particularly important to find a robust model. In terms of recognition accuracy, Junhua [5] proposed that VGG-19 outperformed other models in the field of autonomous driving and had the highest accuracy among the models he trained. However, Khalloufi [6] et al. found that MobileNetV2 performed the best after comparing three models: ResNet, VGG, and MobileNetV2. The training accuracy reached 0.9796, and it was found that due to the limited environment of autonomous driving, VGG-19 was difficult to fully optimize in terms of computational load, while the efficient architecture of MobileNetV2 could ensure the effective extraction of features. Based on the above research, both VGG19 and MobileNetV2 have good accuracy in the field of autonomous driving recognition, such as traffic sign recognition, but they are both vulnerable to adversarial attacks [7].
Therefore, this study will compare the accuracy of VGG19 and MobileNetV2 after being subjected to adversarial attacks from the perspective of model robustness. To address the above issues, this study takes the German traffic sign recognition dataset as the research carrier, selects the FGSM algorithm, calculates the gradient of the model loss function with respect to the input samples, adds perturbations along the direction of the gradient sign, conducts adversarial attacks, and then compares the classification results of the two models under adversarial attacks to analyze the differences in robustness. This article is introduced in the order of the dataset, experimental methods, experimental results and summary. Among them, the dataset is enhanced and standardized to improve sample quality and ensure the validity of experimental data. In the experimental methods, the adversarial attack algorithm and two models are introduced respectively. The experimental results are visually presented through table comparison and confidence level change curves to show the differences in robustness. Eventually, a conclusion is drawn, providing a reference for the model selection of the autonomous driving traffic sign recognition system.
2. Dataset
The dataset used in this study is the German Traffic Sign Recognition Benchmark (GTSRB), which is derived from the Kaggle platform. This platform is a globally renowned data science community platform. Provide a wide range of diverse and high-quality datasets for data scientists, machine learning engineers and students for machine learning and data analysis. GTSRB is a benchmark dataset for traffic sign recognition in Germany, containing images of various traffic signs in different environments in Germany. Each dataset has been carefully organized and labeled with accurate and reliable tags. It provides a sufficient number of sample classes for each traffic sign to offer a representative distribution. Considering that this study needs to simulate real traffic scenarios, only the GTSRB dataset is selected for the research.
Meanwhile, the models selected in this study are VGG19 and MobileNetV2. Based on the input requirements of MobileNetV2 and VGG-19 models, this study adopts an enhanced and standardized data preprocessing process and designs targeted operations for the characteristics of the GTSRB dataset, such as different image sizes and large illumination variations. In terms of enhancement, since signs in real traffic scenarios may have situations such as tilt, offset, and scale variation, only the dynamic enhancement strategy based on Image Data Generator is adopted for the training set to avoid the impact of data distortion in the validation set on the accuracy evaluation. The Image Data Generator method generates deformed samples randomly, making the input data different in each iteration during the training process, forcing the model to learn more essential features rather than relying on specific background or location information. Then, all the images were uniformly scaled to 224×224 for the standardization of the dataset.
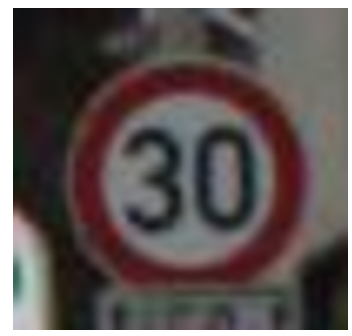
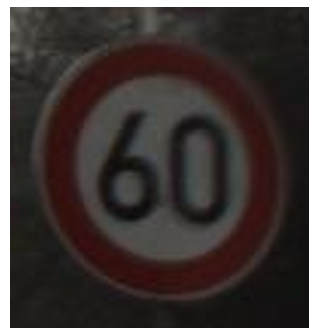
The dataset of this study contains approximately 3,616 images, divided into two categories: the rate-limiting 30 label and the rate-limiting 60 label. Among them, there are 2,213 images in the rate-limiting 30 label category and 1,403 images in the rate-limiting 60 label category. Representative images are shown in Figure 1 and Figure 2. Finally, the division ratio of the training set to the test set is 8:2.
3. Method
3.1. Adversarial attack
The adversarial attack algorithm selected in this paper is FGSM, which was proposed by Goodfellow [8] in 2014. He poses a significant threat to the robustness of deep learning models in image classification [9]. This is an algorithm based on gradient generation of adversarial samples. The attack utilizes the gradient of the input samples by the model loss function. Adding tiny perturbations along the direction of the gradient sign causes the model to make incorrect predictions about the perturbed samples. It usually achieves a very good attack effect, and its principal formula is shown in Formula 1. Here, θ is the model parameter, representing the trainable parameters of the machine learning model to be attacked, including the weights, biases, etc., in the model. Moreover, during the attack process, the model parameter θ remains fixed. Afterward, the y here refers to the true category label corresponding to the original sample x, such as the category label marked with a speed limit of 30 in this study, which is mainly used to calculate the model's loss. The model loss function is used to measure the "error size" between the model's prediction result of the input sample x and the true label y, and it is the core basis for calculating the gradient. Different loss functions are selected for different tasks. In this study, cross-entropy loss is used to measure the difference between the probability distribution of category prediction and the true label distribution. Represent the direction and rate at which the model loss function J changes with the input sample x, and find out from which pixel and to what extent the input sample x is modified to maximize the model's loss value. Among them, the "direction" of the gradient determines the direction of perturbation addition, while the "magnitude" of the gradient reflects the sensitivity of the input sample x to the model loss. The role of the sign function is to take the sign of the gradient and map the gradient value to {-1, 0, 1}. The perturbation intensity ε is a key parameter in the FGSM algorithm, used to control the "amplitude" of the perturbation added to the original sample x. Its value affects the attack effect and the concealment of adversarial samples. If ε is too small, the added perturbations are not sufficient to change the model's prediction results, and the attack will fail. If ε is too large, the perturbations will be too obvious, resulting in significant differences between the adversarial samples and the original samples, which can be distinguished by the naked eye.
3.2. MobileNetV2
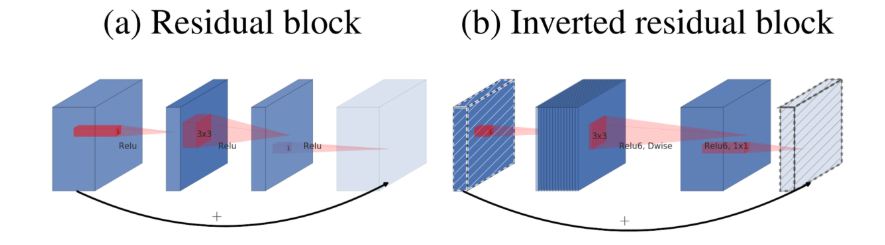
MobileNetV2 [10], a lightweight neural network architecture proposed by the Google team for mobile devices, significantly reduces the number of parameters and computational load while ensuring high model performance. It is suitable for resource-constrained scenarios such as mobile devices and embedded systems, and performs exceptionally well in computer vision tasks such as traffic sign recognition [6]. MobileNetV2 is based on depthwise separable convolution as its fundamental component and combines two innovative features: linear bottleneck layer and inverted residual structure, to achieve a balance between accuracy and resource usage. At the same time, it reduces memory overhead during inference through memory optimization design. The basic component of depthwise separable convolution is the foundation of architectural efficiency. To reduce the computational load, the standard convolution is split into two steps, namely depthwise convolution and point convolution. Deep convolution applies a separate 3×3 convolution kernel to each input channel, only completing feature filtering within the channel without involving information exchange between channels. The computational load is only related to the number of input channels, the size of the feature map, and the size of the convolution kernel. Point convolution is achieved by combining the output channels of depthwise convolution through 1×1 convolution kernels to construct new feature mappings and realize information fusion between channels. One of the two major innovations, the inverted residual structure, reconfigures the positions of residual connections, taking into account both gradient propagation and memory efficiency. This module gradually increases the number of channels from 16 to 320. During the process, the image size is ultimately compressed to 7×7 through downsampling with a step size of = 2, achieving multi-scale feature extraction. Unlike the residual connections of traditional ResNet, the residual connections of MobileNetV2 directly connect to the low-dimensional bottleneck layer, with the middle layer being the high-dimensional extension layer, forming an inverted structure of "narrow-width-narrow", as shown in Figure 3 [7].
3.3. VGG-19
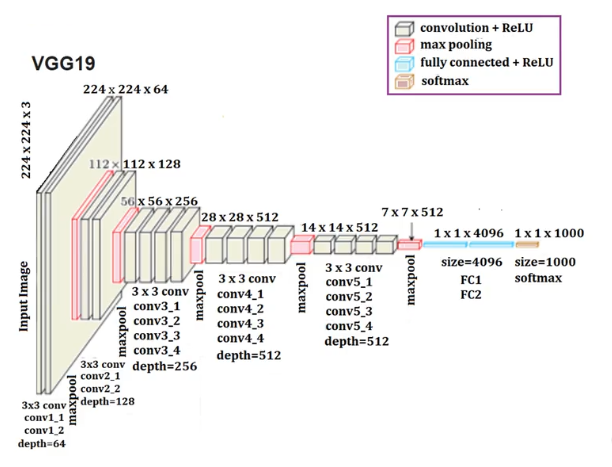
Simonyan [11] et al. proposed that the core architecture of VGG19 is depth-first and small convolutional kernel stacking, with a total of 19 weight layers, specifically 16 convolutional layers and 3 fully connected layers, as shown in Figure 4. Among them, the convolutional layer adopts 3×3 small convolutional kernels, and the last two groups of convolutional layers use 512 channels to enhance the ability of deep feature extraction. Subsequently, in the pooling layer, VGG19 sets up a total of 5 max-pooling layers, all of which adopt a 2×2 pooling window and a step size of 2, and are used after each group of convolutional layers ends. To halve the resolution of the feature map, it is gradually reduced from the initial 224 to 7, while retaining the key features and reducing the computational load. The fully connected layer is fixed according to the number of channels of the three fully connected layers. The first two layers each have 4096 channels, and the third layer has 1000 channels, which can adapt to the 1000-class classification task of the ImageNet dataset. Finally, the category probability is output through the softmax layer. At the same time, VGG19 also abandons the large convolutional kernels commonly used in previous models in its structural design. Instead, it achieves the receptive field of large convolutional kernels by stacking multiple sets of 3×3 convolutional layers. For instance, three 3×3 small convolutional layers are stacked to form a 7×7 receptive field. This design not only introduces more ReLU nonlinear activations to enhance the discriminability of the function, but also significantly reduces the number of parameters. Therefore, compared with a single large convolutional kernel, this architecture not only reduces the number of parameters but also enhances the feature discrimination through multiple nonlinear transformations.
According to this method and experimental Settings, 30 traffic speed limit signs were selected respectively, and adversarial attacks with different disturbance intensities were carried out on the two models. The ε value was set in the range of 0.02-0.1, and the changes in the confidence of the two models in recognizing speed limit signs were compared to study their robustness.
4. Result
4.1. Experimental configuration
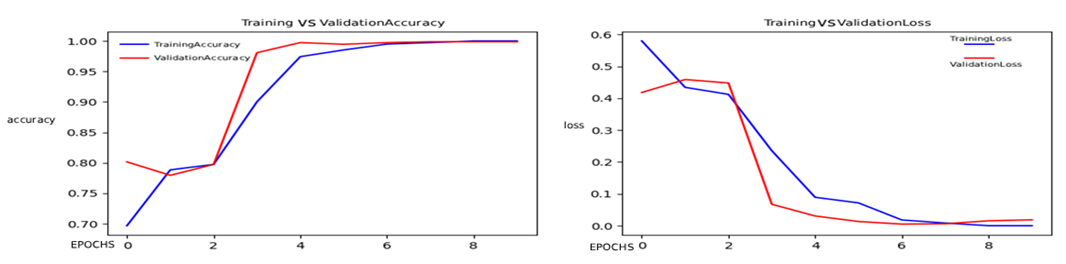
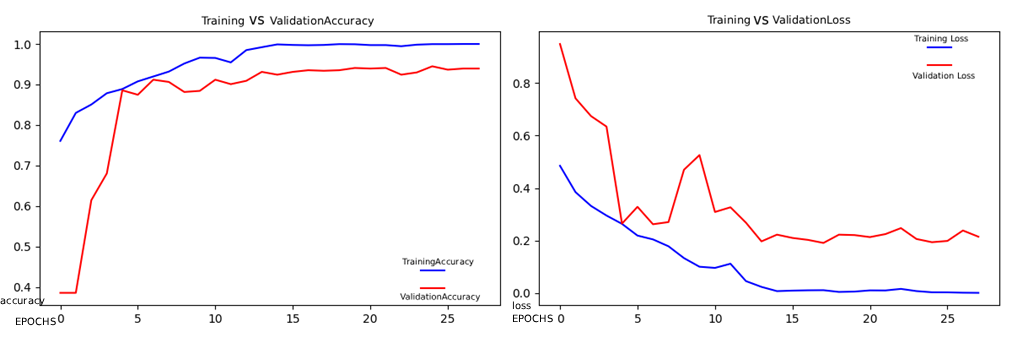
This study completed the experiment on Visual Studio Code. The version environment was 1.94.2. The programming language selected was Python, and the version used was 3.6.13. The dependent libraries included TensorFlow, NumPy, etc. Among them, the version used by TensorFlow was 2.3.0. Under this environment configuration, VGGNet19 and MobileNetV2 are trained. Among them, VGGNet19 has a higher model capacity due to its large number of parameters. To prevent overfitting on a smaller dataset, the total training round EPOCHS of VGGNet19 are set to 10. For the MobileNetV2 with fewer lightweight parameters, the EPOCHS are set to 30. To avoid the oscillation of the initial parameters, the medium and low learning rates adapted by the Adam optimizer are adopted, and their initial learning rates are set to 1e-4. Their training accuracy and loss variations are shown in Figures 5 and 6. As can be seen from the image, with the increase of EPOCHS, their final accuracy all reached over 95%, and the loss all dropped to 0.1. Then, they were asked to recognize the speed limit signs at 30 and 60. It was found that VGGNet19 had a confidence level of 94.2% and 90.9% respectively, while MobileNetV2 had a confidence level of 88.4% and 86.4 respectively. Both successfully recognized the traffic signs.
4.2. Comparative analysis
Select the markers with speed limits of 30 and 60, and set ε to a value within the range of 0.02 to 0.1 to generate adversarial samples for comparison of the recognition confidence of the two types of markers. The differences in recognition confidence of MobileNetV2 and VGGNet19 are shown in Table 1 and Table 2.
|
0 |
0.02 |
0.04 |
0.06 |
0.08 |
0.1 |
|
|
MobileNetV2 |
88.4% |
0% |
0% |
0% |
0% |
0% |
|
VGGNet19 |
94.2% |
91.8% |
89.6% |
87.5% |
85.8% |
84.8% |
|
0 |
0.02 |
0.04 |
0.06 |
0.08 |
0.1 |
|
|
MobileNetV2 |
86.4% |
0% |
0% |
0% |
0% |
0% |
|
VGGNet19 |
90.9% |
83.1% |
75.8% |
69.4% |
64.2% |
60.3% |
From the above data, it can be seen that when ε was 0, although both models recognized the traffic signs, VGGNet19 demonstrated higher accuracy than MobileNetV2. Later, when the ε value was set to 0.02, MobileNetV2 mistakenly recognized the speed limit sign of 30 as 60 and the confidence level had dropped to 0%. Similarly, the speed limit sign of 60 was recognized as 30 and the confidence level was also reduced to 0%. In contrast, VGGNet19 can still accurately identify speed limit signs at 30 and 60, and it still has a relatively high confidence level. Moreover, as ε gradually increases to 0.1, VGGNet19 can still maintain correct identification of signs. However, MobileNetV2 has always wrongly identified traffic signs and its confidence level has always been 0%.
4.3. Visual analysis
The data in the table can be visualized as the following line graphs, as shown in Figures 7 and 8
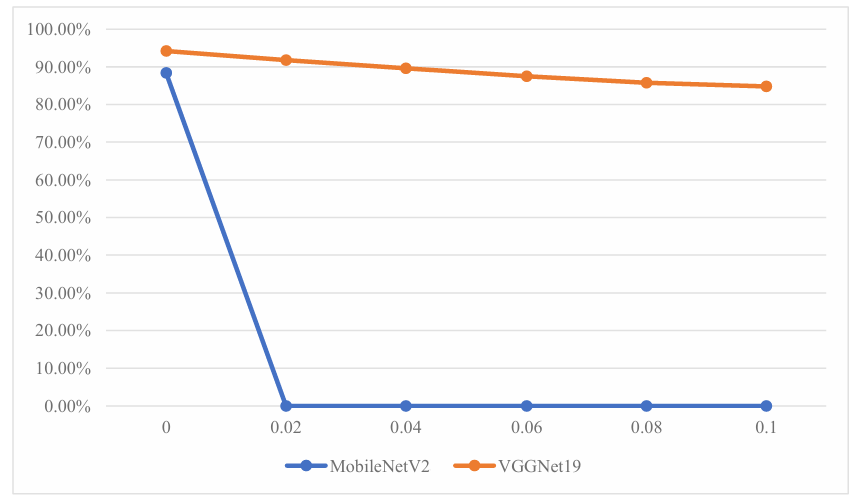
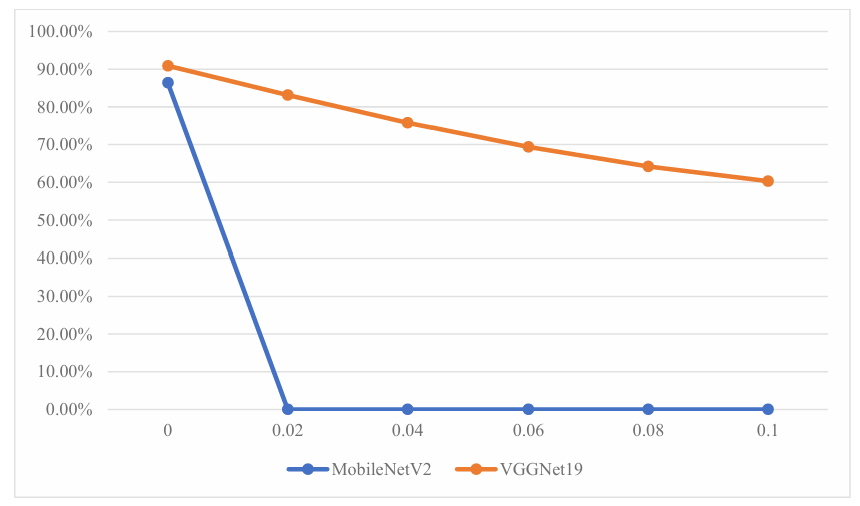
As can be seen from the two line graphs above, for the recognition of 60 and 30 speed limit signs, the decline in the confidence level of MobileNetV2 is significantly greater than that of VGGNet19 as the ε value increases. Moreover, when the ε value is greater than 0.02, the confidence level of MobileNetV2 remains at 0%. In contrast, for VGGNet19, as ε increases, the recognition confidence will decrease. Moreover, there is a slight difference in the extent of the confidence decline of VGG19 under the two types of speed limit marks. When recognizing the speed limit mark of 30, the confidence decline of VGG19 is gentler. When ε increases from 0 to 0.1, the confidence only drops from 94.2% to 84.8%. However, when recognizing the 60 speed limit mark, the confidence level of VGG19 drops more significantly. When ε increases from 0 to 0.1, the confidence level drops from 90.9% to 60.3%, with a total decrease of 30.6%.
4.4. Discussion
From the above data analysis, it can be known that under FGSM adversarial attacks, the robustness of the VGG19 model is stronger than that of MobileNetV2. This might be due to the depth-first and small convolutional kernel stacking architecture adopted by VGG19, which enhances the discriminability of features and makes the features learned by the model more essential. MobileNetV2 is a lightweight model. Although it balances accuracy and efficiency through an inverted residual structure, depth-separable convolution splits the filtering within the channel and the fusion between channels, resulting in a reduction in the dimension of feature interaction. Moreover, its parameter scale is much smaller than that of VGG19, and it has a smaller fault-tolerant space for disturbances, making it prone to losing key feature information. Moreover, the fully connected layer of VGG19 can highly integrate the features extracted by the convolutional layer, while the bottleneck layer of MobileNetV2 is mainly a linear activation. Although it avoids the loss of low-dimensional spatial information, its feature abstraction ability is weaker than that of VGG19, resulting in the features it learns being more dependent on local pixel distribution. Slight disturbances from adversarial attacks can cause minor changes in the feature distribution, leading to incorrect classification decisions.
5. Conclusion
Based on the above content, this study compared the robustness of VGGNet19 and MobileNetV2 against FGSM adversarial attacks under the GTSRB dataset, with speed limits of 30 and 60 as the research objects. The experimental results show that VGGNet19 has stronger robustness. This conclusion is conducive to future researchers choosing models with stronger robustness for more efficient optimization, enhancing the accuracy of the models while also ensuring that they are not easily attacked. Finally, this study only used the dataset of speed limit signs and did not cover all traffic signs in real scenarios. The coverage was not extensive enough to simulate the real recognition scenarios of autonomous driving. Moreover, it only adopted the FGSM adversarial attack algorithm and failed to verify the robustness under other adversarial attacks such as PGD. In the future, the coverage of the dataset can be expanded, more traffic signs can be added to train the model, and multiple adversarial attack algorithms can be adopted to improve the experiment. At the same time, seek defense strategies to enhance the anti-attack capability of MobileNetV2 while retaining its efficiency advantage. Finally, this paper fills the research gap in the robustness comparison between VGG19 and MobileNetV2 in the field of traffic sign recognition, providing a basis for the selection of high-reliability recognition models for autonomous driving systems and laying the foundation for the subsequent robustness optimization of traffic sign recognition models. It has significant practical significance for ensuring the safety of autonomous driving.
References
[1]. Yan Ying, Zhou Mo, Feng Chengcheng, Lv Lu & Ding Hongliang. (2025). Three-Dimensional CNN-Based Model for Fine-Grained Pedestrian Crossing Behavior Recognition in Automated Vehicles.Journal of Transportation Engineering, Part A: Systems, 151(2),
[2]. Monowar Hossain Saikat, Sonjoy Paul Avi, Kazi Toriqul Islam, Tanjida Tahmina, Md Shahriar Abdullah & Touhid Imam.(2024). Real-Time Vehicle and Lane Detection using Modified OverFeat CNN: A Comprehensive Study on Robustness and Performance in Autonomous Driving.Journal of Computer Science and Technology Studies, 6(2), 30-36.
[3]. Song Jin Gyu & Lee Joon Woong. (2023). CNN-Based Object Detection and Distance Prediction for Autonomous Driving Using Stereo Images.International Journal of Automotive Technology, 24(3), 773-786.
[4]. Yang Y. (2022). Research on data poisoning attack for driverless traffic sign recognition Doctorial Dissertation of Guilin university of electronic science and technology.
[5]. Qi Junhua. (2024). Efficiency study of VGG networks in autonomous driving tasks .(eds.) Univ. of Science and Technology Beijing (China)
[6]. Fatima Ezzahra Khalloufi, Najat Rafalia & Jaafar Abouchabaka. (2023). Comparative Analysis of Transfer Learning-Based CNN Approaches for Recognition of Traffic Signs in Autonomous Vehicles.E3S Web of Conferences, 412, 01096-01096.
[7]. Nowroozi, E., Ghelichkhani, S., Haider, I., & Dehghantanha, A. (2023). Unscrambling the rectification of adversarial attacks transferability across computer networks.
[8]. Goodfellow, I. J., Shlens, J., & Szegedy, C. (2014). Explaining and harnessing adversarial examples. #i{Computer Science}.
[9]. Waghela, H., Sen, J., & Rakshit, S. (2024). Robust image classification: defensive strategies against fgsm and pgd adversarial attacks.
[10]. Sandler, M., Howard, A., Zhu, M., Zhmoginov, A., & Chen, L. C. (2018). Mobilenetv2: inverted residuals and linear bottlenecks. #i{IEEE}.
[11]. Simonyan, K., & Zisserman, A. (2014). Very deep convolutional networks for large-scale image recognition. #i{Computer Science}.
Cite this article
Ding,Y. (2025). Attack Against CNN Model for Traffic Sign Recognition. Applied and Computational Engineering,211,7-15.
Data availability
The datasets used and/or analyzed during the current study will be available from the authors upon reasonable request.
Disclaimer/Publisher's Note
The statements, opinions and data contained in all publications are solely those of the individual author(s) and contributor(s) and not of EWA Publishing and/or the editor(s). EWA Publishing and/or the editor(s) disclaim responsibility for any injury to people or property resulting from any ideas, methods, instructions or products referred to in the content.
About volume
Volume title: Proceedings of CONF-SPML 2026 Symposium: The 2nd Neural Computing and Applications Workshop 2025
© 2024 by the author(s). Licensee EWA Publishing, Oxford, UK. This article is an open access article distributed under the terms and
conditions of the Creative Commons Attribution (CC BY) license. Authors who
publish this series agree to the following terms:
1. Authors retain copyright and grant the series right of first publication with the work simultaneously licensed under a Creative Commons
Attribution License that allows others to share the work with an acknowledgment of the work's authorship and initial publication in this
series.
2. Authors are able to enter into separate, additional contractual arrangements for the non-exclusive distribution of the series's published
version of the work (e.g., post it to an institutional repository or publish it in a book), with an acknowledgment of its initial
publication in this series.
3. Authors are permitted and encouraged to post their work online (e.g., in institutional repositories or on their website) prior to and
during the submission process, as it can lead to productive exchanges, as well as earlier and greater citation of published work (See
Open access policy for details).
References
[1]. Yan Ying, Zhou Mo, Feng Chengcheng, Lv Lu & Ding Hongliang. (2025). Three-Dimensional CNN-Based Model for Fine-Grained Pedestrian Crossing Behavior Recognition in Automated Vehicles.Journal of Transportation Engineering, Part A: Systems, 151(2),
[2]. Monowar Hossain Saikat, Sonjoy Paul Avi, Kazi Toriqul Islam, Tanjida Tahmina, Md Shahriar Abdullah & Touhid Imam.(2024). Real-Time Vehicle and Lane Detection using Modified OverFeat CNN: A Comprehensive Study on Robustness and Performance in Autonomous Driving.Journal of Computer Science and Technology Studies, 6(2), 30-36.
[3]. Song Jin Gyu & Lee Joon Woong. (2023). CNN-Based Object Detection and Distance Prediction for Autonomous Driving Using Stereo Images.International Journal of Automotive Technology, 24(3), 773-786.
[4]. Yang Y. (2022). Research on data poisoning attack for driverless traffic sign recognition Doctorial Dissertation of Guilin university of electronic science and technology.
[5]. Qi Junhua. (2024). Efficiency study of VGG networks in autonomous driving tasks .(eds.) Univ. of Science and Technology Beijing (China)
[6]. Fatima Ezzahra Khalloufi, Najat Rafalia & Jaafar Abouchabaka. (2023). Comparative Analysis of Transfer Learning-Based CNN Approaches for Recognition of Traffic Signs in Autonomous Vehicles.E3S Web of Conferences, 412, 01096-01096.
[7]. Nowroozi, E., Ghelichkhani, S., Haider, I., & Dehghantanha, A. (2023). Unscrambling the rectification of adversarial attacks transferability across computer networks.
[8]. Goodfellow, I. J., Shlens, J., & Szegedy, C. (2014). Explaining and harnessing adversarial examples. #i{Computer Science}.
[9]. Waghela, H., Sen, J., & Rakshit, S. (2024). Robust image classification: defensive strategies against fgsm and pgd adversarial attacks.
[10]. Sandler, M., Howard, A., Zhu, M., Zhmoginov, A., & Chen, L. C. (2018). Mobilenetv2: inverted residuals and linear bottlenecks. #i{IEEE}.
[11]. Simonyan, K., & Zisserman, A. (2014). Very deep convolutional networks for large-scale image recognition. #i{Computer Science}.