


1. Introduction
The stock market is a crucial component of the investment market, as it provides companies and investors with the potential to reap significant financial gains or incur substantial losses. Its unpredictable and dynamic nature renders it an intriguing and challenging area of study for scholars Therefore, stock price prediction becomes increasingly important for those seeking to make benefits and for scholars. However, due to its inherent high risk, price volatility, and numerous factors that influence stock prices, it is unfathomable. All the factors like a company’s performance, countries’ policies, market/people sentiment, economic conditions, the relationship between supplies and demands, and industry trends can cause normal means not to predict the stock price well. Specifically, China and Australia used to have a significant trade relationship in the field of energy, along with coal being one of the major commodities exchanged between these two countries before 2020. Nonetheless, because of China's trade restrictions on Australia in 2020, stock prices were highly volatile. As such, it is imperative to develop effective methods for stock price prediction to enable companies and governments to plan for the future and make informed investment decisions.
In recent years, the use of artificial intelligence and machine learning algorithms are powerful tools to predict stock prices, compared with conditional models. In the previous research on stock price prediction, they usually focused on the broad, long, inclusive trend lines of the stock price. disregarding the non-linear properties of stock price, sentiment analysis, or stock price prediction under specific periods / economic conditions. For example, one article used the Autoregressive integrated moving average (ARIMA) model to predict some companies’ stock prices in a short-term period [1]. Even if the result was good on a short-term basis and it can guide investors in the stock market to make profitable investment decisions, this model cannot perform well over a long-time period. In another article, it used the Least Absolute Shrinkage and Selection Operator (LASSO) linear regression model to predict stock price. This article proved that LASSO linear regression outperformed the ridge linear regression model and Bayesian regularized artificial model [2]. But, as its linear property, it still cannot predict the stock price well since the dependent variable (i.e., stock price) and independent variables (i.e., predictors) do not usually have a linear relationship. Also, the linear regression model cannot consider some other factors except the fundamental numbers. Besides these two articles, one article compared the performance or stock price prediction between Artificial neural network (ANN) and Random Forest (RF) [3]. This paper used ANN and RF at the same time to observe which one has a better prediction. The result shows us that ANN gives better predictions of stock prices as compared to RF. Meanwhile, it still cannot consider financial news articles along with financial parameters. Additionally, one article applied the model of Recurrent Neural Network (RNN) based on Long Short-term Memory (LSTM) on stock price prediction [4]. The result turned out to be best compared with the previous models, it shows that the LSTM model has better performance. But it still cannot include investors' sentiment into the model, even though it was able to capture the long memory by the LSTM model to make the prediction long enough.
Drawing on a comparative analysis of previous research on stock price prediction, this paper proposes an advanced method based on the LSTM model, which was the best model compared with ANN, RNN, RF, LASSO linear regression, and ARIMA, which is Bidirectional Long Short-Term Memory (BiLSTM). This research focuses on the stock price prediction of some Australian energy companies' stock prices after the relaxation of trade restrictions from China. This paper will focus on how to solve the problems of vanishing/exploding gradients, being over-sensitive to date, capturing long-term trends, overfitting, and news sentiment.
2. Method
2.1. Dataset description and preprocessing
This paper aims to accurately forecast stock prices within a specific timeframe, ranging from June 1st, 2020 to June 1st, 2021 where a lot of Australian energy companies were affected by the trade restriction from China. This paper’s data was collected from yahoo finance, which included three Australian energy companies: BHP Group (BHP), Whitehaven Coal (WHC), Rio Tinto (RIO), and put them into three different CSV files. After that, the preprocessing procedure was carried out in this study. This model used the MinMaxScaler, which scaled each feature to a specified range using the minimum and maximum values of each feature in the dataset. Therefore, the data frame contained the stock price and sentiment data. The MinMaxScaler was created with a specified range of (0, 1), and the fit_transform() method was called on the subset of columns that needed to be scaled. The scaled data was then assigned back to the original data frame and split into training dataset and testing dataset. The dataset was made to predicate the stock price which is a regression problem since the stock price is a continuous variable.
2.2. LSTM model
LSTM model is a type of RNN that is firstly designed to handle the problem of vanishing or exploding gradients in traditional RNNs [5-7], the distinctive attributes of LSTM model are the addition of memory cells and three gates that allow the network to selectively remember or forget information over time. The memory cells are units that store information, and the gates are layers that control the flow of information into and out of the cells. The LSTM architecture consists of three main components: the input gate, the forget gate, and the output gate. The input gate determines which information should be stored in the memory cells, the forget gate determines which information should be discarded from the memory cells, and the output gate determines which information should be outputted from the memory cells. The gate values are then used to update the state of the memory cell, which is then passed onto the next time step of the LSTM model. Specifically, this paper used two bidirectional LSTM layers that process the input sequence in both forward and backward directions, which allows the model to capture not only the past context but also the future context of each input token. Therefore, in this model, there are two sets of gates operating independently on the input sequence, and their outputs are concatenated together to produce the final output of the BiLSTM model. The use of this model improved the performance of stock price prediction models in certain special situations.
2.3. Implementation details
2.3.1. Bidirectional LSTM layers. This model had two bidirectional LSTM layers, each of them having a dropout layer added to prevent overfitting issues, and a dense output layer with L2 regularization to further improve performance at last.
2.3.2. Dropout layers. Dropout is a form of feature engineering that randomly drops out a fraction of the nodes in a layer during training. The model also includes two dropout layers to make it fit better with a dropout rate of 0.2, which represents the fraction of the input units to drop in the dropout layer. In this case, 20% of the input units were randomly set to 0 at each update during training.
2.3.3. Regularization. L2 regularization is applied to the weights of the model to further prevent overfitting with the strength of 0.01. L2 regularization adds a penalty term to the loss function that encourages smaller weights.
2.3.4. Sentiment analysis. This model included sentiment analysis by using the Vader Sentiment Intensity Analyzer from the NLTK library. The sentiment score for each day is added as an additional feature to the input data.
2.3.5. Hyperparameters. This work used several hyperparameters to control the learning process in order to make the final prediction more precise. The use of lookback allowed the model to use the stock prices from the previous certain number of days to predict the price for the next day. This model also contained some other basic hyperparameters, such as epochs, which changed the number of iterations the model was trained for, batch size, which altered the amount of data points used in each batch during training, units in LSTM model, which modified the count of neurons in the hidden layer of the model, and learning rate, which was used as the rate of the Adam optimizer during training.
2.3.6. Compile the model. This model used the Adam optimizer which is widely used in many studies with a learning rate of 0.00001 [8-10], and employed the mean squared error (MSE) as the loss function.
2.3.7. Root mean square error (RMSE). It was used as the evaluation metric for the model's performance. It measured the difference between the predicted and actual values of the stock prices.
3. Result and discussion
After adjusting hyperparameters and applying the model, this work obtained three stock price prediction graphs and three RMSE values which can be used to evaluate the accuracy. From the Table 1, the RMSE values for these three companies were 1.4883, 1.8752, and 0.0748 respectively. From all three figures (Figure 1, Figure 2 and Figure 3), the overall prediction trend lines are exceptionally excellent. Both volatility and consolidation of stock trends were preserved, and the overall going of the price was presented. However, the details are not that accurate since those points' stock prices suddenly changed a lot because of the special situations. The model successfully predicted the increasing trend or decreasing trend of those cases but failed to predict exactly how much would the stock price increase or decrease. So, this paper will still work on how to predict the precise value of stock price even if there is an emergency. To achieve that, more features about people's sentiments, background information, government policies, economic factors, companies' performance, investors' confidence, and manipulation from the market are necessary. Therefore, this study would like to improve the accuracy of this prediction by training a model for people sentiment analysis and putting the result as a new feature to the predicting model, applying more recondite models/techniques, tuning hyperparameters more, and ensembling the LSTM model with other models such as Convolutional Neural Networks (CNN) to extract features from the historical stock data, Support Vector Machines (SVMs) to classify stock price into different categories which allows more feature being used in the model, Random Forests to predict the output of the LSTM model, Generative Adversarial Networks (GANs) to generate synthetic stock data, and Autoencoders to reconstruct stock data.
Table 1. RMSE of three stocks.
BHP | RIO | WHC | |
RMSE | 1.4883 | 1.8752 | 0.0748 |
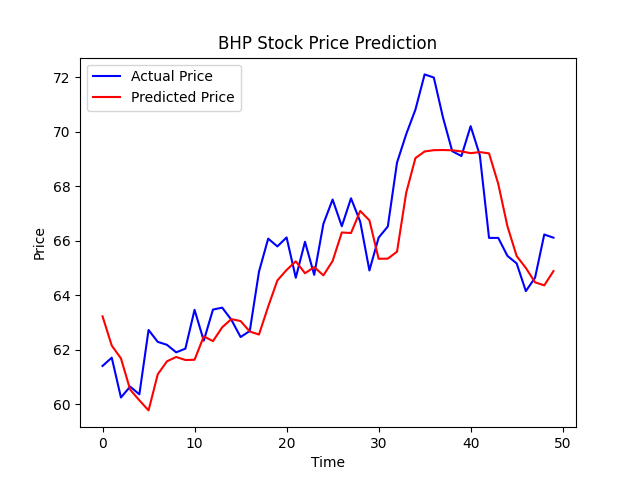
Figure 1. BHP stock price prediction.
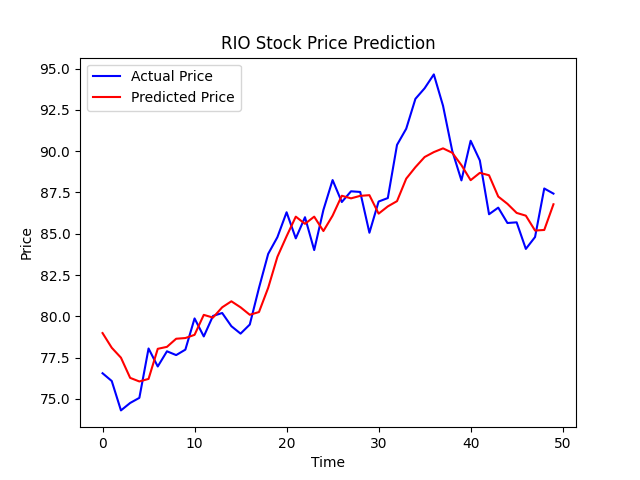
Figure 2. RIO stock price prediction.
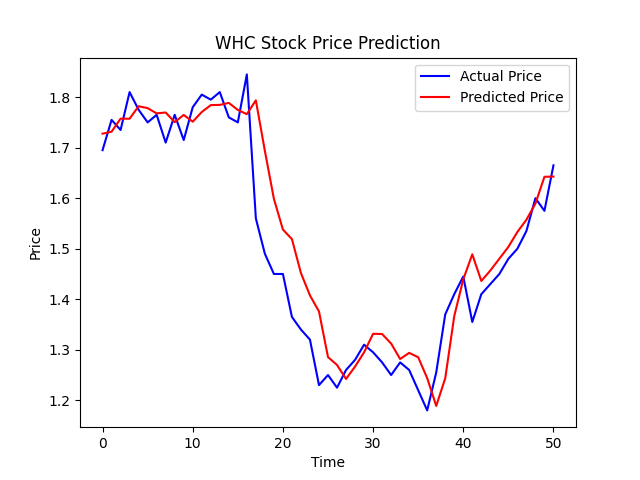
Figure 3. WHC stock price prediction.
4. Conclusion
This study proposed an enhanced BiLSTM model that utilizes LSTM and bidirectional layers to predict the stock prices of three Australian energy companies during China's energy trade restriction period. The proposed model was evaluated through extensive experimentation, including the assessment of RMSE values and the analysis of stock prediction graphs. The experimental results revealed that the proposed model, incorporating new features and techniques, was effective and reliable in predicting stock prices during volatile situations. Future research will focus on enhancing the model's accuracy by incorporating additional financial indicators, such as earnings reports, company histories, and previous performances under similar circumstances. Furthermore, the study intends to integrate cutting-edge techniques and advanced features from related domains to improve the model's accuracy and robustness.
References
[1]. Ariyo A A Adewumi A O Ayo C K 2014 Stock price prediction using the ARIMA model 2014 UKSim-AMSS 16th international conference on computer modelling and simulation IEEE 106-112
[2]. Roy S S Mittal D Basu A et al. 2015 Stock market forecasting using LASSO linear regression model Afro-European Conference for Industrial Advancement: Proceedings of the First International Afro-European Conference for Industrial Advancement AECIA Springer International Publishing 371-381
[3]. Vijh M 2020 et al. Stock closing price prediction using machine learning techniques Procedia computer science 167 599-606
[4]. Moghar A and Mhamed H 2020 Stock market prediction using LSTM recurrent neural network Procedia Computer Science 170 1168-1173
[5]. Yu Y Si X Hu C et al. 2019 A review of recurrent neural networks: LSTM cells and network architectures Neural computation 31(7): 1235-1270
[6]. Staudemeyer R C Morris E R 2019 Understanding LSTM--a tutorial into long short-term memory recurrent neural networks arXiv preprint arXiv:1909.09586
[7]. Smagulova K James AP 2019 A survey on LSTM memristive neural network architectures and applications The European Physical Journal Special Topics 228(10): 2313-2324
[8]. Dubey S R Singh S K Chaudhuri B B 2023 AdaNorm: Adaptive Gradient Norm Correction based Optimizer for CNNs Proceedings of the IEEE/CVF Winter Conference on Applications of Computer Vision 5284-5293
[9]. Yu Q Wang J Jin Z et al. 2022 Pose-guided matching based on deep learning for assessing quality of action on rehabilitation training Biomedical Signal Processing and Control 72: 103323
[10]. Dubey S R Singh S K Chaudhuri B B 2023 AdaNorm: Adaptive Gradient Norm Correction based Optimizer for CNNs Proceedings of the IEEE/CVF Winter Conference on Applications of Computer Vision 5284-5293
Cite this article
Lin,X. (2023). Stock price prediction on Australian companies under China’s trade restriction based on the LSTM model. Applied and Computational Engineering,16,1-6.
Data availability
The datasets used and/or analyzed during the current study will be available from the authors upon reasonable request.
Disclaimer/Publisher's Note
The statements, opinions and data contained in all publications are solely those of the individual author(s) and contributor(s) and not of EWA Publishing and/or the editor(s). EWA Publishing and/or the editor(s) disclaim responsibility for any injury to people or property resulting from any ideas, methods, instructions or products referred to in the content.
About volume
Volume title: Proceedings of the 5th International Conference on Computing and Data Science
© 2024 by the author(s). Licensee EWA Publishing, Oxford, UK. This article is an open access article distributed under the terms and
conditions of the Creative Commons Attribution (CC BY) license. Authors who
publish this series agree to the following terms:
1. Authors retain copyright and grant the series right of first publication with the work simultaneously licensed under a Creative Commons
Attribution License that allows others to share the work with an acknowledgment of the work's authorship and initial publication in this
series.
2. Authors are able to enter into separate, additional contractual arrangements for the non-exclusive distribution of the series's published
version of the work (e.g., post it to an institutional repository or publish it in a book), with an acknowledgment of its initial
publication in this series.
3. Authors are permitted and encouraged to post their work online (e.g., in institutional repositories or on their website) prior to and
during the submission process, as it can lead to productive exchanges, as well as earlier and greater citation of published work (See
Open access policy for details).
References
[1]. Ariyo A A Adewumi A O Ayo C K 2014 Stock price prediction using the ARIMA model 2014 UKSim-AMSS 16th international conference on computer modelling and simulation IEEE 106-112
[2]. Roy S S Mittal D Basu A et al. 2015 Stock market forecasting using LASSO linear regression model Afro-European Conference for Industrial Advancement: Proceedings of the First International Afro-European Conference for Industrial Advancement AECIA Springer International Publishing 371-381
[3]. Vijh M 2020 et al. Stock closing price prediction using machine learning techniques Procedia computer science 167 599-606
[4]. Moghar A and Mhamed H 2020 Stock market prediction using LSTM recurrent neural network Procedia Computer Science 170 1168-1173
[5]. Yu Y Si X Hu C et al. 2019 A review of recurrent neural networks: LSTM cells and network architectures Neural computation 31(7): 1235-1270
[6]. Staudemeyer R C Morris E R 2019 Understanding LSTM--a tutorial into long short-term memory recurrent neural networks arXiv preprint arXiv:1909.09586
[7]. Smagulova K James AP 2019 A survey on LSTM memristive neural network architectures and applications The European Physical Journal Special Topics 228(10): 2313-2324
[8]. Dubey S R Singh S K Chaudhuri B B 2023 AdaNorm: Adaptive Gradient Norm Correction based Optimizer for CNNs Proceedings of the IEEE/CVF Winter Conference on Applications of Computer Vision 5284-5293
[9]. Yu Q Wang J Jin Z et al. 2022 Pose-guided matching based on deep learning for assessing quality of action on rehabilitation training Biomedical Signal Processing and Control 72: 103323
[10]. Dubey S R Singh S K Chaudhuri B B 2023 AdaNorm: Adaptive Gradient Norm Correction based Optimizer for CNNs Proceedings of the IEEE/CVF Winter Conference on Applications of Computer Vision 5284-5293