


1. Introduction
In modern urban areas, many super high-rise buildings have emerged, and there are a large number of high and low buildings around them. From the perspective of scale, the surrounding buildings are smaller than super high-rise buildings. In addition, the scales of the surrounding buildings themselves vary greatly (from tens of meters to one or two hundred meters). The complex multi-scale urban underlying surface composed of these surrounding buildings and super high-rise buildings will significantly change the wind environment of buildings, generating complex, various scales of eddies, thus affecting the wind resistance safety of super high-rise buildings. The influence of multi-scale buildings on the wind load of super high-rise buildings is a multi-scale effect. In recent years, with the development of cities, this multi-scale effect is becoming more and more complex and significant, and related research is needed urgently.
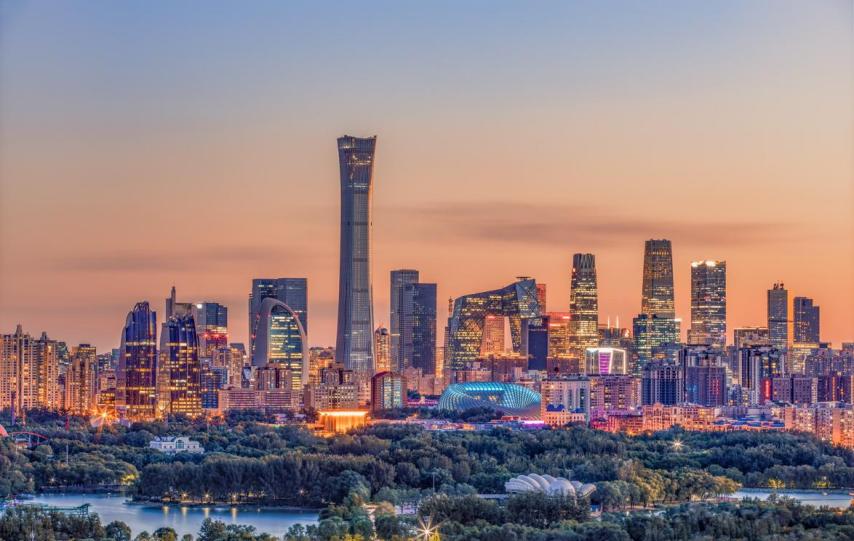
Figure 1. Beijing CBD area(Photo by Kai Wang: https://www.cpanet.org.cn/detail_news_124720.html).
Taking Beijing CBD shown in Figure 1 as an example, the CITIC Tower completed in October 2018 is 528 meters high and is in a complicated building complex. Around the CITIC Tower, there are a large number of buildings about 200 meters high, as well as many low-rise residential buildings. The multi-scale building clusters can significantly affect the wind loads of CITIC Tower, which poses a certain threat to its wind resistance safety. The multi-scale effect of wind load on the super high-rise building formed in recent years is a new safety risk. In reality, there are many glass walls shedding accidents in super high-rise buildings under high wind conditions. Therefore, it is urgent to study the influence of the multi-scale effect on wind resistance safety for super high-rise buildings in cities.
There have been a large number of studies on wind loads on urban buildings based on wind tunnel tests and numerical simulation methods. Cheng [1] used the wind tunnel test to study the wind load effect of a single high-rise building on the target low-rise buildings. Aiming at the layout of high-rise buildings located at the edge of group buildings, the influence of multiple parameters such as different wind directions, spacing and height of disturbing buildings on the interference effect of target low-rise buildings at different positions of the building group were studied in depth. The results show that the interference effect of the wind load of the target building on the surrounding buildings is mainly reflected in the shielding degree of the surrounding buildings to the windward wind flow and the strength of the feedback airflow of the rear buildings. Elshaer et al. [2] performed numerical simulations to study the impact of urban development on the wind load of high-rise buildings. The influence of different height ratios of the central high-rise building to the surrounding building on the wind load of the central building was studied in a general example. In the actual case, the influence of buildings in three historical stages of development in a certain area of Toronto on the urban wind field is studied. Combining these two examples, it was found that as the urban becomes denser, the average wind pressure will decrease, and the wind velocity will increase. The increasing pressure fluctuation of wind on the outer wall of the skeleton would produce a great safety risk with the accumulation of damage. Qin et al. [3] explored the wind load characteristics of twin towers and single towers. The results show that when the spacing is within a certain relative distance, the vortex shedding of the twin towers decreases so that the cross-wind oscillation of the twin towers is significantly smaller than that of the single tower. Moreover, it is proved that the use of structural links between twin towers can reduce wind loads.
There have been a considerable number of studies on the mutual influence of wind loads on buildings with the same or different scales. There are also many studies on the influence of other factors (such as balcony structure [4]) on wind loads of buildings. However, the understanding of the influence of multi-scale surrounding buildings on the wind load of super high-rise buildings is still insufficient, and there are a few relevant studies. Multi-scale buildings mean that the scale of surrounding buildings affecting the wind load of super high-rise buildings varies greatly. Take the CITIC Tower in Beijing CBD as an example, its height reaches 528 meters, while there are many high-rise buildings of more than 200 meters around. At the same time, in the surrounding area, between the buildings, there are dozens of meters of residential buildings and other low buildings, the scale is much smaller than the high-rise buildings of more than 200 meters. This means that there is a multi-scale effect on the buildings, and thus the multi-scale surrounding buildings cannot be generally regarded as a group of the same buildings. Different from the traditional "one-to-one" wind load impact study, such as the wind load impact of the interaction between super high-rise buildings [3] and the wind load impact of high-rise buildings on low buildings [1], this study explores the wind load impact of multi-scale buildings on super high-rise buildings, which is the "many-to-one" wind load impact.
In this paper, the simplified geometric models as general cases are first considered. The wind field of the simplified model of the building group with different layouts is numerically simulated to obtain the influence law and physical mechanism of the surrounding multi-scale building group on the wind load of the super high-rise building. Then, the numerical simulations are validated by the wind tunnel experiment. Finally, taking the "CITIC Tower" super high-rise building as the research object, the real calculation model of surrounding buildings with different scales is constructed, and the numerical simulation is done to study the influence of the buildings with different scales around the CITIC Tower on the wind load of the super high-rise building. The organization of the paper is as follows: the second section introduces the research methods; section three analyzes the impact of multi-scale surrounding buildings on the wind load of super high-rise buildings for the simplified models; the fourth section investigates the influence of multi-scale peripheral building on the wind load of CITIC Tower. Finally, a conclusion is made.
2. Research methods
2.1. Governing equations of computational fluid dynamics
This study mainly uses Reynolds Average Navier-Stokes (RANS) simulation method (Hybrid LES/RANS as well). The governing equations are as follows:
1) Continuity equation:
\( \frac{∂\bar{{u_{i}}}}{∂{x_{i}}}=0 \) (1)
\( \bar{{u_{i}}} (i=x,y,z) \) represents the time-averaged velocity component in \( x \) , \( y \) and \( z \) directions. (1) is the deformation of the continuity equation and the density is omitted, because this study discusses incompressible fluid with constant density.
2) Momentum equation:
\( \bar{{u_{j}}}\frac{∂\bar{{u_{i}}}}{∂{x_{j}}}=-\frac{1}{ρ}\frac{∂\bar{p}}{∂{x_{i}}}+\frac{∂}{∂{x_{j}}}(ν\frac{∂\bar{{u_{i}}}}{∂{x_{j}}}-\bar{u_{i}^{ \prime }u_{j}^{ \prime }}) \) (2)
The Reynolds stress \( -\bar{u_{i}^{ \prime }u_{j}^{ \prime }} \) appears in the equation and the standard \( k \) - \( ε \) model is applied here:
\( -\bar{u_{i}^{ \prime }u_{j}^{ \prime }}={ν_{t}}(\frac{∂\bar{{u_{i}}}}{∂{x_{j}}}+\frac{∂\bar{{u_{j}}}}{∂{x_{i}}})-\frac{2}{3}k{δ_{ij}} \) (3)
\( {δ_{ij}} \) is the Kronecker function, when \( i=j \) , \( {δ_{ij}}=1 \) ; In other cases, \( {δ_{ij}}=0 \) . In order to solve the Reynolds stress, it is necessary to know the turbulent viscosity coefficient \( {ν_{t}}={C_{μ}}\frac{{k^{2}}}{ε} \) . The \( k \) (turbulent kinetic energy) and \( ε \) (turbulent dissipation rate) transport equations in the standard \( k \) - \( ε \) model:
\( \frac{Dk}{Dt}={P_{k}}-ε+\frac{∂}{∂{x_{j}}}[(ν+\frac{{ν_{t}}}{{σ_{k}}})\frac{∂k}{∂{x_{j}}}] \) (4)
\( \frac{Dε}{Dt}=\frac{ε}{k}({C_{ε1}}{P_{k}}-{C_{ε2}}ε)+\frac{∂}{∂{x_{j}}}[(ν+\frac{{ν_{t}}}{{σ_{ε}}})]\frac{∂ε}{∂{x_{j}}} \) (5)
Turbulent kinetic energy generation term:
\( {{P_{k}}=2ν_{t}}{S_{ij}}{S_{ij}} \) (6)
Among them:
\( {S_{ij}}=\frac{1}{2}(\frac{∂{U_{i}}}{∂{x_{j}}}+\frac{∂{U_{j}}}{∂{x_{i}}}) \) (7)
The constants used in above equations are listed in Table 1.
Table 1. Table of constants used in this model. | ||||
\( {C_{μ}} \) | \( {σ_{k}} \) | \( {σ_{ε}} \) | \( {C_{ε1}} \) | \( {C_{ε2}} \) |
0.09 | 1.0 | 1.3 | 1.44 | 1.92 |
2.2. Computational domain and boundary conditions
2.2.1. Computing domain. As for the general case study, there are three kinds of buildings. The tallest and widest super high-rise building has a height H of 182.88 m (600 ft) and the width W is 30.48 m (100 ft). The scale of the three buildings is very different to create a multi-scale building group. The computing domain size is much larger than the building scale, which is a 6H×8H×4H cuboid. A schematic of the computational domain is illustrated in Figure 2.
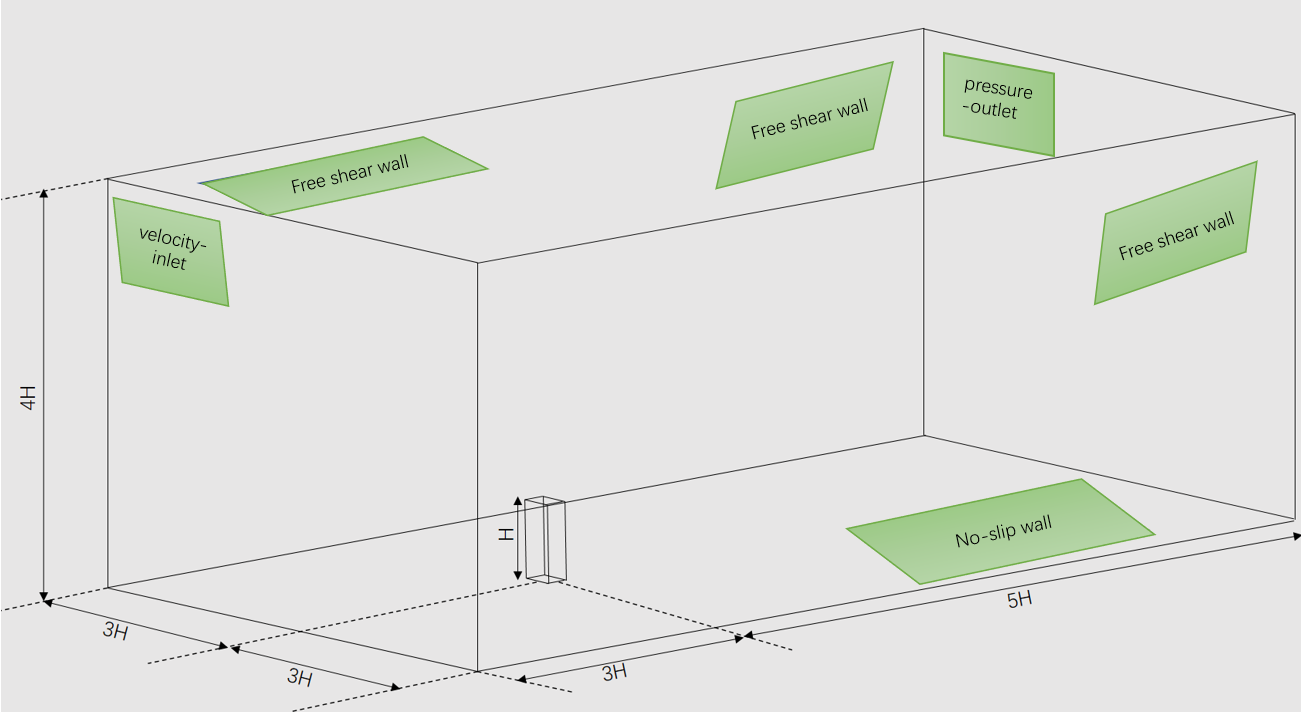
Figure 2. Diagram of computational domain and boundary conditions.
2.2.2. Boundary conditions. To set the boundary conditions in the Ansys FLUENT: the inlet velocity was used to simulate the urban wind field through the logarithmic law equation in the user-defined file. The outlet is set as the pressure outlet boundary condition; The walls of the building are set as non-slip velocity boundary conditions; The remaining walls are set as free-slip velocity boundaries.
In order to simulate the urban wind speed under the atmospheric boundary layer condition, there are usually two methods, namely exponential law and logarithmic law [5]. Both of them are widely used, and the logarithmic method is adopted in this study:
\( u(z)=\frac{{u_{τ}}}{k}Ln(\frac{z+{z_{0}}}{{z_{0}}}) \) (8)
where \( k \) is Karman constant and is taken as 0.4. \( u(z) \) represents the wind speed at the height of \( z \) . \( {z_{0}} \) represents the roughness height, which is 0.03 meters. A wind speed of 3m/s at an altitude of 30m is applicable in many situations, so it is so defined. The value of the friction velocity \( {u_{τ}} \) of the atmospheric boundary layer is obtained by the logarithmic law equation.
2.3. Study cases
2.3.1. General cases. The general cases have four building combinations, as shown in Figure 3. The buildings of each building combination are cuboids. There are three types of buildings: Super high-rise building with the height H =182.88 meters (600 feet) and the width W = 30.48 meters (100 feet); The height of the high-rise buildings is H/2 and the width is W/2; The height of the low buildings is H/2 and the width is W/2. In order to clearly show the distance between buildings, Figure 4 shows the schematic sketch of case d from top view. All other examples are based on Example d by deleting the buildings and keeping the building distance data consistent.
|
|
a) Single super high-rise building | b) Super high-rise buildings and surrounding 16 low buildings |
|
|
c) Super high-rise buildings and surrounding 8 high-rise buildings | d) Super high-rise buildings with surrounding 8 high-rise buildings and 16 low buildings |
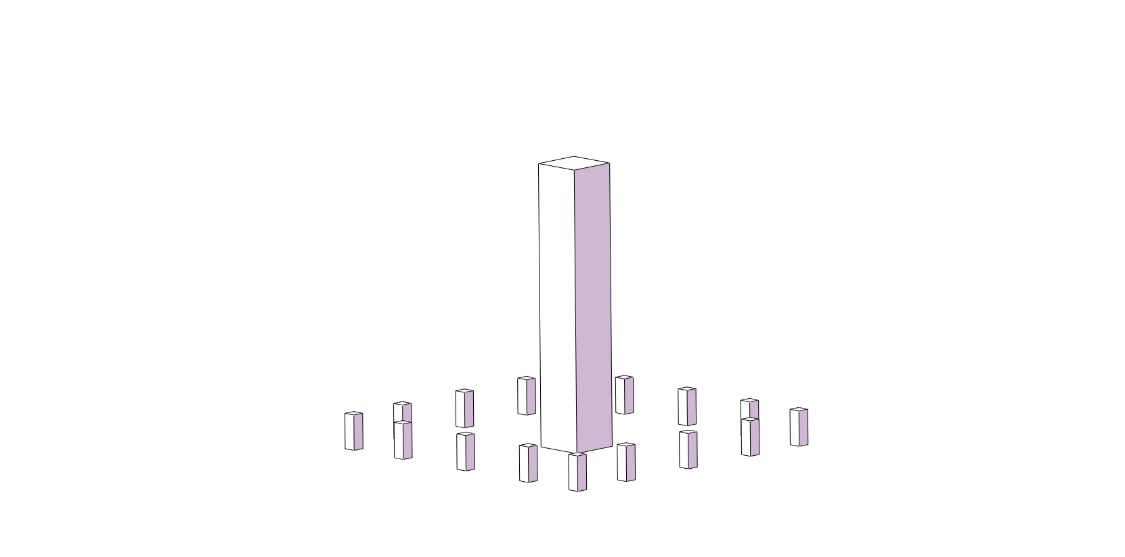
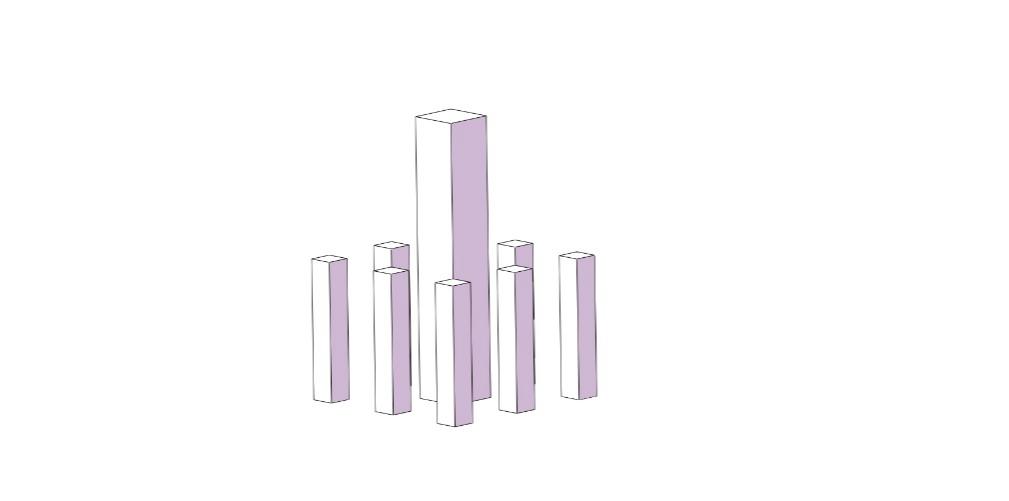
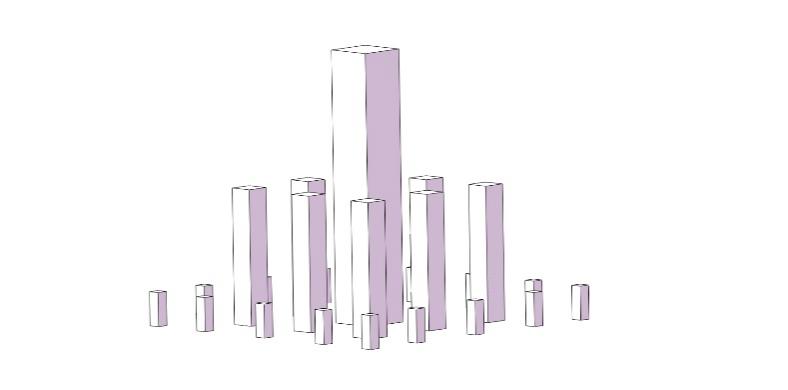
Figure 3. Geometric models of simplified cases.
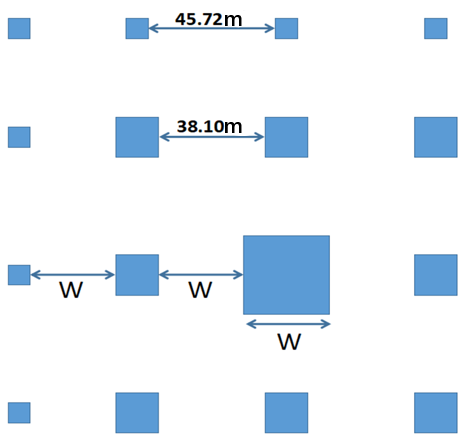
Figure 4. Schematic sketch of Case d from top view.
2.3.2. Real case: Beijing CBD area. Beijing CBD is a prosperous area with complex buildings, with a large number of 200-meter buildings and a large number of low buildings. At the same time, the "CITIC Tower" in the construction area as the highest building in Beijing is a typical super high-rise building, as the research object is perfectly suitable. Taking Beijing CBD area as an example, geometric modelling was carried out according to the real terrain. A 1.3km×1.3km square building group with CITIC Tower as the centre was built. After exploring the multi-scale effect rule of the general case, the real case of Beijing CBD area was used for numerical simulation, and the multi-scale effect was used to explain the wind load in China.
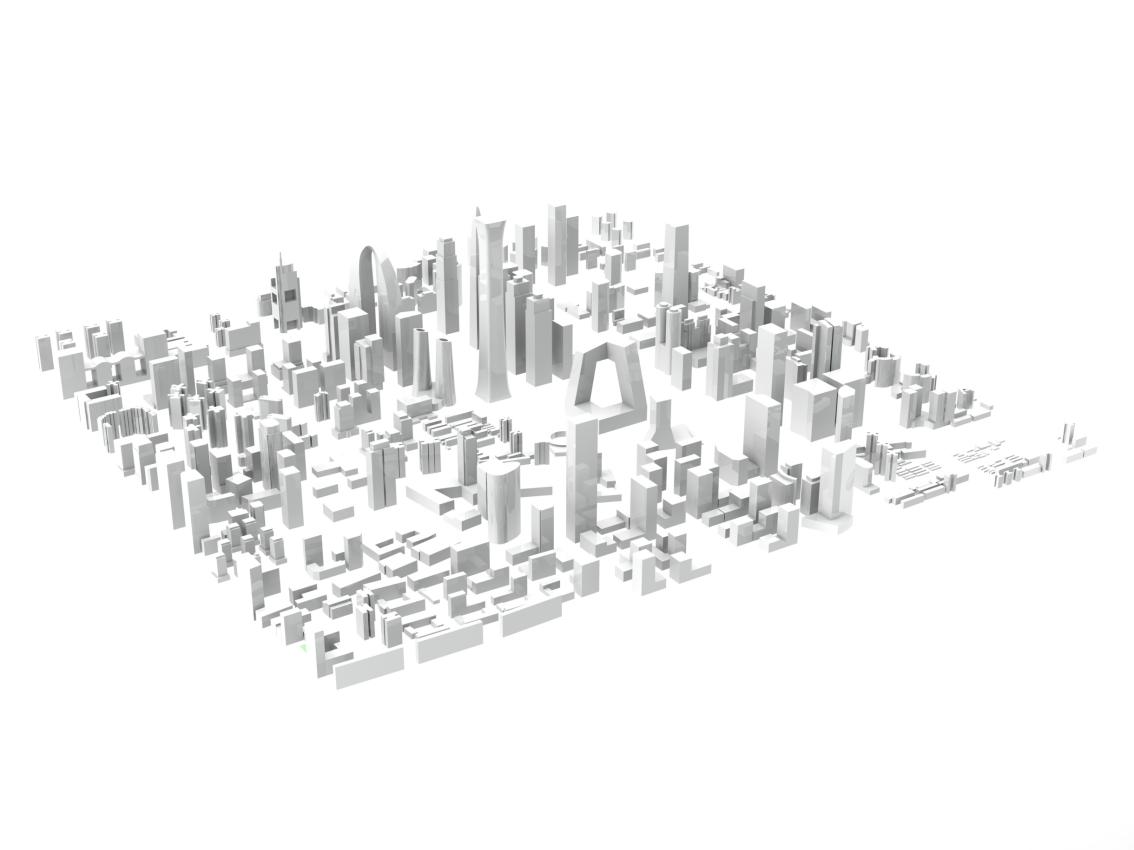
Figure 5. Geometric modelling of Beijing CBD real example.
2.4. Grid independence study
The grid uses unstructured grids, taking the case d as an example, three kinds of grids with different resolutions are selected for grid independence study. For the coarse mesh, the basic length of a single grid in the calculation domain is 20 meters, and the number of grids is 410198. In the medium mesh, the basic length of a single grid in the calculation domain is 10 meters, and the number of grids is 2374130. In the find mesh, the basic length of a single grid in the computational domain is reduced to 7 meters, and the number of grids is 6085579. The weighted average pressure on the windward side, the weighted average pressure on the leeward side, the maximum pressure on the windward side, and the minimum pressure on the leeward side of the super high-rise building are summarized in Table 2. It can be seen from Table 2 that there is a certain gap between the results of coarse and fine meshes. But the difference between the results of medium and fine mesh is very small and can be almost ignored. Therefore, for the sake of accuracy, all the general cases in this study are calculated by fine mesh.
Table 2. Grid independence study. | |||
Fine Mesh | Medium Mesh | Coarse Mesh | |
Number of grids | 6085579 | 2374130 | 410198 |
iteration times | 400 | 400 | 400 |
Windward weighted average pressure /Pa | 3.9566413 | 4.0211267 | 4.0158905 |
Weighted average pressure on leeward side /Pa | -2.8850913 | -2.8635588 | -3.1413775 |
Maximum windward pressure /Pa | 8.6947975 | 8.5288258 | 7.9987855 |
Minimum pressure on leeward side /Pa | -3.3021979 | -3.3728423 | -3.6117897 |
2.5. Wind tunnel test
2.5.1. Geometric models. The geometrical models were built using a 3D printer by the material ABS, as shown in Figure 6.
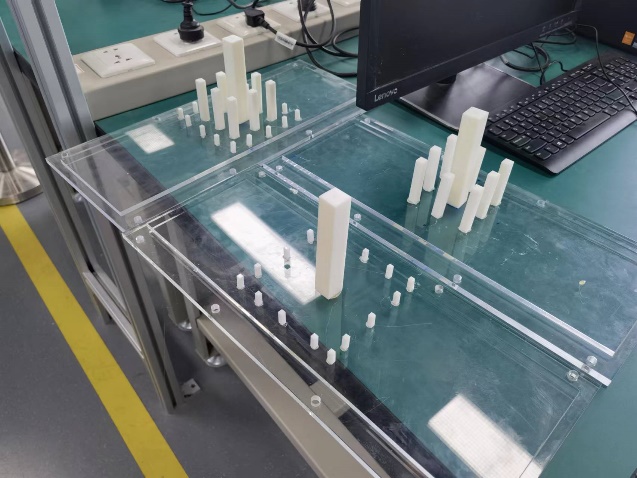
Figure 6. Geometric models for wind tunnel test.
2.5.2. Pressure measurement. The wind tunnel used is an Armfield small scale wind tunnel. When measuring the wind pressure at a certain height, the wind tunnel’s wind speed is adjusted to the calculated wind speed corresponding to the height to simulate the real wind field environment, according to the logarithmic method shown in equation (6). The relevant wind pressure values are recorded.
3. The influence of multi-scale surrounding building clusters on wind loads of super high-rise buildings
Numerical simulations of the atmospheric wind environment of a multi-scale building clusters are carried out. Sect. 3.1 introduces the distribution of time-averaged pressure on the windward/leeward side of the super high-rise buildings. Sect. 3.2 discusses the mean and extreme values of time-averaged pressure on the windward/leeward side of the super high-rise buildings. Sect. 3.3 introduces the value of fluctuating wind pressure on the windward/leeward side of the super high-rise buildings. Sect. 3.4 gives the time-averaged flow field of the building clusters.
3.1. Time-averaged pressure distribution on windward/leeward side of super high-rise buildings
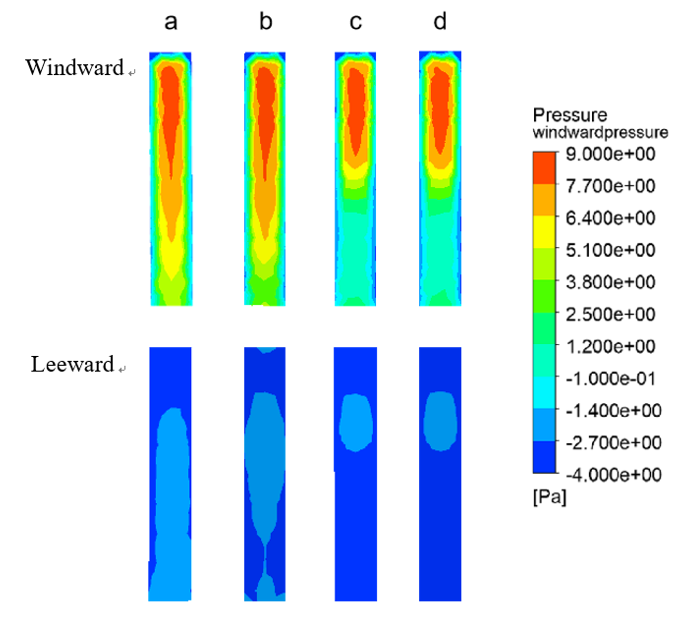
Figure 7. Time-averaged pressure distribution on windward/leeward side of super high-rise buildings in four cases.
Due to building obstruction, backflow is formed behind the building when the wind blows through the building. A negative pressure zone appears on the leeward side, while a positive pressure zone appears on the windward side.[6] Therefore, the windward and leeward sides form a large pressure difference. This is also an important part of the wind load of the building. Figure 7 shows the time-averaged pressure distribution on the windward/leeward side of a high-rise buildings for different cases.
Comparing the presence of only a cluster of low-rise buildings around a super high-rise building (Case b) with a single super high-rise building (Case a), it is found that the presence of low-rise buildings in the vicinity has little effect. Only the wind pressure at the bottom of the super high-rise building (below the height of the low-rise buildings) decreases on the windward side while the negative pressure increases on the lower half of the leeward side. When there are high-rise buildings around the super high-rise building (Case c), a significant change in the wind pressure coefficient distribution can be seen. The wind pressure below the middle and upper part of the windward side of the super high-rise building decreases significantly, while the negative pressure at the leeward side of the super high-rise building increases significantly. The presence of both high-rise and low-rise buildings around the super high-rise building (Case d) is not much different from the presence of only high-rise buildings around the building.
In summary, it can be seen that the surrounding high-rise buildings have a great influence on the target super high-rise building, while the influence of low-rise buildings is only limited to the bottom area. If there are both high-rise buildings and low-rise buildings around, the influence of low-rise buildings on the wind pressure of super high-rise buildings is small.
3.2. Mean and extreme values of time-averaged pressure on windward/leeward side of super high-rise buildings
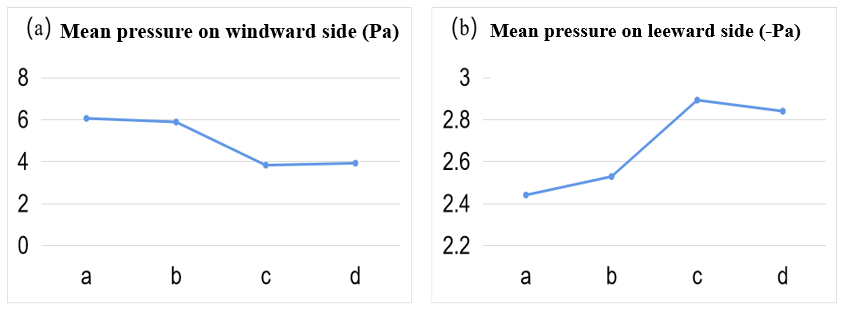
Figure 8. Mean value of time-averaged pressure on windward/leeward side of super high-rise buildings.
As shown in Figure 8(a), the mean windward pressure of Case a is slightly higher than that of Case b. This indicates that the obstructive effect of the low-rise buildings reduces the windward pressure of the super high-rise buildings, but the effect is not significant. The mean pressure at the windward side of the super high-rise building in Case c is the smallest. This indicates that the windward pressure of the super high-rise building is significantly reduced due to the obstruction of the high-rise buildings. The mean pressure at the windward side of Case d is slightly higher than that of Case c. This indicates that the windward side pressure is slightly higher than that of the surrounding high-rise buildings when there is a multi-scale building cluster around the high-rise. The obstruction effect of high-rise buildings and low-rise buildings does not superimpose.
Figure 8(b) shows the mean value of the time-averaged pressure at the leeward side of the super high-rise building. It is the smallest in Case a. The mean negative pressure of the super high-rise building in Case b shows a small increase. It can be concluded that the low-rise building group contributes to the increase of the negative pressure at the leeward side of the super high-rise building, but the effect is limited. In Case c, the mean negative pressure at the leeward side of the super high-rise building increases sharply and reaches the maximum. It can be concluded that the effect of high-rise buildings on increasing the negative pressure on the back side of super high-rise buildings is larger. This also indicates that the high-rise buildings have a significant effect on the wind field at the leeward side of the super high-rise building (see Sect. 3.4). The mean negative pressure at the leeward side of Case d is slightly lower than that of Case c. This indicates that due to the presence of low-rise building clusters in the surrounding building stock, the presence of multi-scale building clusters in the surrounding area has a smaller mean pressure on the leeward side of the super high-rise building than in the case where only high-rise building clusters are present in the surrounding area.
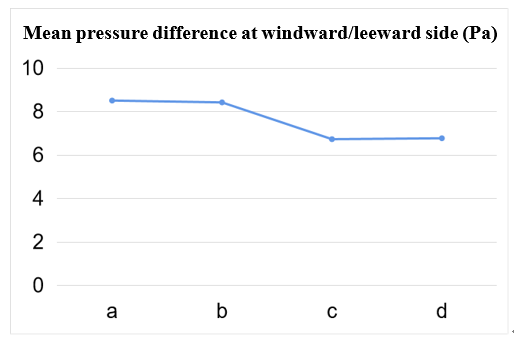
Figure 9. Mean pressure difference at windward/leeward side of super high-rise building.
Based on the mean pressure at the windward side and the mean pressure at the leeward side mentioned before, the mean pressure difference between the windward and leeward sides can be calculated by Eq. (9):
\( ∆P={P_{windward}}-{P_{leeward}} \) (9)
The calculation results are shown in Figure 9. The mean differential pressure of Case a is the largest. The pressure difference of Case b is slightly smaller than that of Case a. The pressure difference of Case c is the lowest, much smaller than that of Case a and Case b. The pressure difference of Case d is slightly higher than that of Case c.
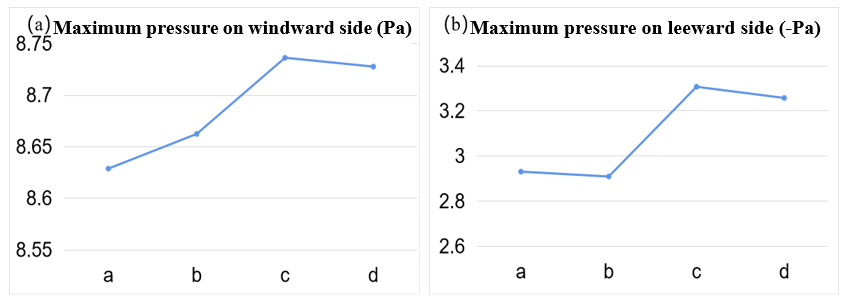
Figure 10. Extreme values of time-averaged pressure on windward/leeward side of super high-rise building.
To further compare quantitatively the effects of different surrounding scales on the wind pressure of the target super high-rise building, the extreme values of wind pressure on the windward and leeward sides of the target super high-rise building in the four cases are shown in Fig. 10.
From Figure 10(a), we can see that the maximum pressure on the windward side in Case a is the smallest. In Case b, the maximum pressure on the windward side of the super high-rise building becomes larger. In Case c, the maximum pressure on the windward side of the super high-rise building increases sharply and reaches the maximum of the four cases. This further indicates that the surrounding high-rise buildings have a significant impact on the wind pressure of the target super high-rise building. The maximum pressure at the windward side in Case d is slightly reduced. This indicates that the influence of the low perimeter building mass is small in this case. It also shows that the maximum windward pressure of the super high-rise building is smaller in the presence of a multi-scale cluster of buildings than in the case of a cluster of high-rise buildings only.
Figure 10(b) shows the maximum negative pressure at the leeward side. The maximum negative pressure at the leeward side in Case b is the smallest and slightly smaller than that in Case a. This indicates that the surrounding low-rise buildings only have little influence on the leeward side of the target super high-rise building. The maximum negative pressure at the leeward side of the super high-rise building in Case c increases significantly and reaches the maximum. This indicates that the surrounding high-rise buildings significantly change the building wind field (see Sect. 3.4), and it has a great influence on the wind pressure at both the windward and leeward sides of the target super high-rise building. The maximum negative pressure at the leeward side in Case d is slightly smaller than that in Case c. It can be obtained that the maximum negative pressure at the leeward side of the super high-rise building is smaller when there is a multi-scale building cluster in the surrounding area than when there is only a high-rise building cluster in the surrounding area.
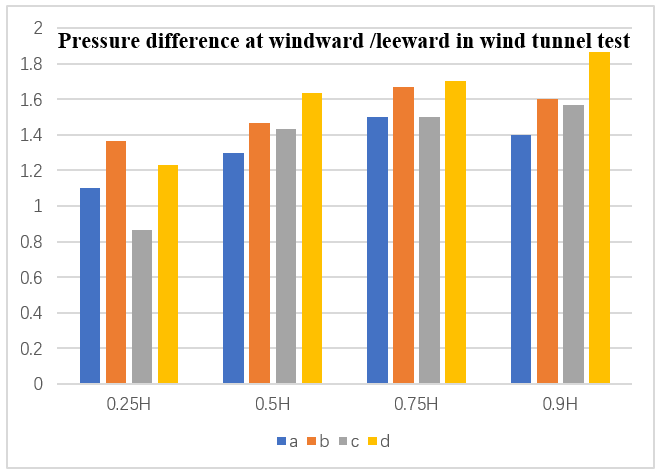
Figure 11. Mean pressure difference at windward/leeward side of super high-rise building from the wind tunnel test.
In order to validate our numerical simulations, the mean pressure difference at windward/leeward side of super high-rise building from the wind tunnel test is also calculated for the general cases, as shown in Figure 11. Overall, the higher the height, the higher the pressure difference. The Case c has the smallest pressure difference compared with other cases. Although there are experimental errors, the data of the wind tunnel test are sufficient to verify the validity of the numerical simulation results.
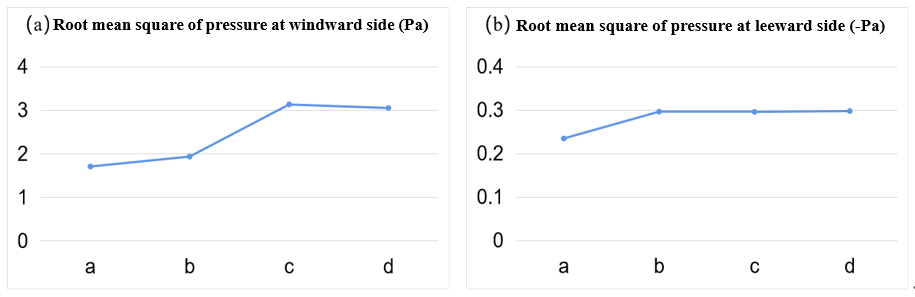
Figure 12. Root mean square of the mean pressure at the windward/leeward side of a super high-rise building.
3.3. Wind pressure fluctuating values at windward/leeward side of super high-rise buildings
The impact of wind on buildings is inconsistent. The wind pressure keeps changing with the turbulent change of wind speed and wind direction. The mean value of wind action is usually regarded as the stable wind pressure, which actually fluctuates above and below the stable wind pressure. The mean wind pressure makes the building produce side shift, while the fluctuating wind pressure makes the building vibrate left and right near the side shift. Wind vibration is the dynamic expression of wind pressure fluctuation on the structure. Under the wind pressure fluctuations, the structure will not only occur downwind wind vibration, but also accompanied by crosswind wind vibration. Therefore, fluctuating wind load is also a key concern in the field of wind engineering. Figure 12 shows the root mean square wind pressure values of the windward and leeward sides of the target super high-rise building in different peripheral scale building clusters.
As shown in Figure 12(a), the lowest value of root mean square pressure is on the windward side in Case a. The R.M.S. of pressure on the windward side in Case b increases slightly. This indicates that the presence of low-rise buildings enhances part of the pressure fluctuation, but the intensity of the fluctuation is weak. In Case c, the R.M.S. of pressure at the windward side of the super high-rise building increases significantly, about 1.83 times that of a single building. This indicates that the presence of the surrounding high-rise buildings greatly increases the turbulent fluctuation and causes a significant increase in the fluctuating wind load on the windward side. As mentioned before, the increase of fluctuating wind load will influence the wind vibration of the building façade, which in turn will cause the safety problem of the building façade. In Case d, the windward fluctuating wind load is basically unchanged. The change of fluctuating wind load on the windward facade again shows that the surrounding high-rise buildings have a significant effect on the wind load of super high-rise buildings.
As shown in Figure 12(b), the R.M.S of pressure at the leeward side of Case a has the lowest value. The fluctuating wind pressure on the leeward side of Case b increases slightly. It is worth noting that, unlike the windward side, the fluctuating wind pressure at the back of the super high-rise building is basically unchanged when there is only a cluster of high-rise buildings and a cluster of high-rise and low-rise buildings in the surrounding area. This is because there is a large recirculating flow at the back of the super high-rise building, and the turbulent fluctuation in the return part is weak. Comparing Figure 12(a) and (b), it can be found that the value of fluctuating wind pressure at the leeward side is much smaller than the value of fluctuating wind pressure at the windward side, which is about one-tenth of it.
3.4. Mean pressure time histories and frequency spectra analysis
The wind pressure values at each moment in the long-time wind field were calculated by Hybrid RANS/LES method, and the mean pressure time distribution was obtained. Since the characteristics of the pressure at the windward/leeward side have the greatest influence on the wind safety of super high-rise buildings, the Fourier transform of the mean pressure time histories at the windward side and the leeward side of the Case a and Case c are processed.
|
|
a) The time distribution of the mean pressure at windward side in Case a | b) Windward side spectrum at windward side in Case a |
|
|
c) Time distribution of the mean pressure at windward side in Case c | d) Windward side spectrum at windward side in Case c |
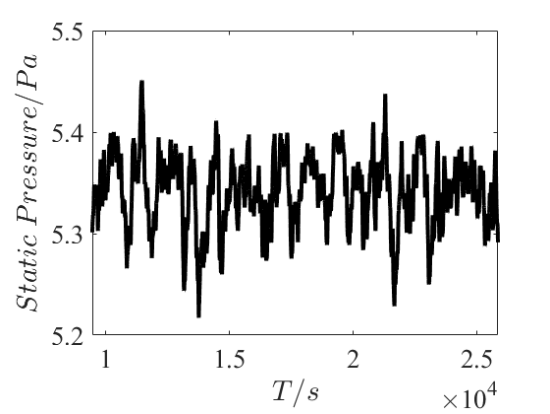
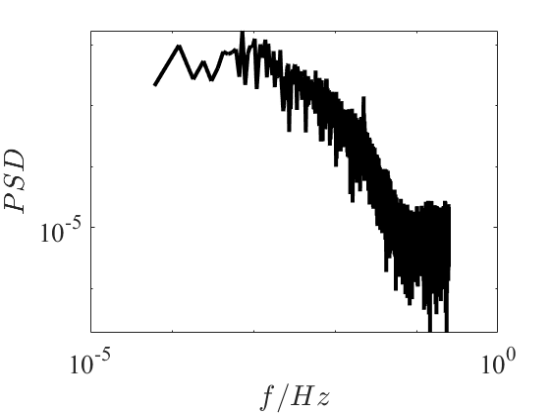
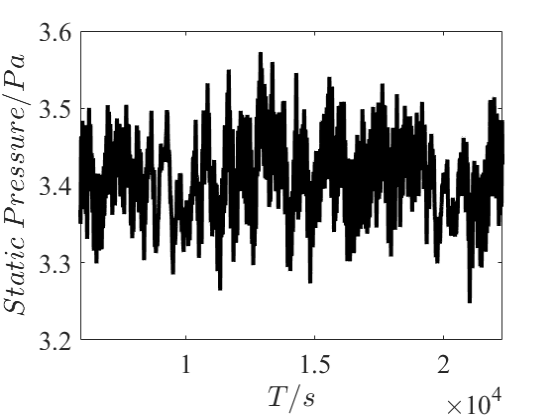
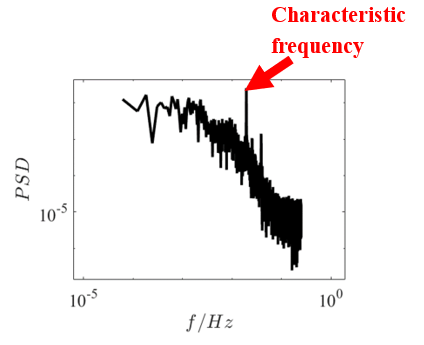
Figure 13. Mean pressure distribution and spectrum at windward side.
In the spectra, we cannot identify a characteristic frequency from Case a, but we can identify a characteristic frequency from the spectra of the windward side obtained from Case c, as shown in Figure 13(b) and (d). The energy of the characteristic frequency is greater than other frequencies. When there are high-rise buildings around the super high-rise buildings, and when the natural frequency of the target super high-rise building resembles the characteristic frequency, if the wind periodically hit the windward side of the super high-rise buildings with this frequency, the damage to the buildings is very serious because the building will vibrate severely. This vibration is induced by the vortex that shows a periodic pattern, caused by surrounding buildings, without which the flow is more inclined to be a laminar.[7]
3.5. Time-averaged flow field around building clusters
In order to gain insight into the influence of multi-scale building clusters around super high-rise buildings, this subsection discusses in detail the time-averaged flow field distribution of different surrounding building clusters.
Since the height of the low-rise cluster is 22.86 m and the height of the high-rise cluster is 91.44 m, we choose cross-sections with heights of 18 m and 80 m to better present the influence of the surrounding low-rise cluster and high-rise cluster on the time-averaged flow field. The time-averaged velocity field on the longitudinal profile passing through the symmetry axis of the super high-rise building, the time-averaged velocity field on the transverse profile of 18 m height and the time-averaged velocity field on the transverse profile of 80 m height are given in the left, middle and right columns of the images in Figure 14, respectively.
(Each row belongs to one case, from top to bottom, there are four cases: a, b, c and d, respectively. The left, middle and right columns indicate the time-averaged velocity field on the longitudinal section of the symmetry axis of the super high-rise building, the transverse section of 18m height and the transverse section of 80m height, respectively.)
Figures 14 (a-c) show the time-averaged velocity field of the Case a. It can be seen that the wind speed increases from bottom to top when the wind blows from the front to the windward side of a super high-rise building. In particular, there is a significant acceleration above the building due to the blocking effect of the building. This phenomenon shows the reason for the high pressure above the front of the super high-rise building and the low pressure below.[8] Meanwhile, the formation of a significant return vortex at the back of the super high-rise building indicates the reason for the negative pressure.
Figures 14 (d-f) show the time-averaged velocity field of the Case b. It can be seen that when the wind blows from the front to the super high-rise building, the wind below the low-rise building blows to the super high-rise building at a significantly lower wind speed due to the shading of low-rise buildings. This phenomenon explains the reason for the reduced frontal pressure at the bottom of the super high-rise building. From Figure 14 (e), it can be seen that a different vortex is formed between the bottom area of the leeward side of the super high-rise building and the low-rise building facing the leeward side than in the time-averaged velocity field of the a-calculus. The intensity of the vortex at this height is greater due to the obstructing effect of the low-rise building. This phenomenon explains the reason for the greater negative pressure at the bottom of the back side.[9]
Figure 14. Time-averaged flow field of building clusters.
Figures 14 (g-i) show the time-averaged velocity field for the Case c. It can be seen that when the wind blows from the front to the super high-rise building, the wind below the high-rise building blows to the super high-rise building at a significantly reduced wind speed due to the shading of the low-rise building and the high-rise building. This phenomenon explains the reduced frontal pressure below the upper central part of the super high-rise building. From Figure 14 (i), it can be seen that a vortex is formed between the back side of the super high-rise building and the leeward side facing the high-rise building which is different from that shown in the time-averaged velocity field of Case a and Case b. The intensity of the vortex at this height is greater due to the obstruction of the high-rise building. This explains the reason for the greater negative pressure generated below the upper middle of the backside.
Figures 14 (j-l) shows the time-averaged velocity field for the Case d. It can be seen that it is approximately the same as the velocity field of Case c. Therefore, it can be obtained that when there are both high-rise buildings and low-rise buildings around the super high-rise building, the effect of low-rise buildings is difficult to be seen in the time-averaged velocity field. This explains why the mean, fluctuating and extreme wind pressures in Case c and Case d in Sect. 3.2 are not very different.
4. The influence of multi-scale building clusters around CITIC Tower on wind loads of it
Beijing Central Business District (Beijing CBD) is a prosperous area which includes commercial and residential buildings. These buildings consist of a large number of 200-meter tall buildings (such as the China Media Group, the Concordia Plaza South Tower and the Samsung Tower) and many surrounding low buildings. At the same time, the CITIC Tower in the area is the highest building in Beijing, with a height of 528 meters. Its width gradually tightened from 78m×78m at the bottom to 54m×54m, and then gradually enlarged to 59 m×59 m at the top. It is named CITIC Tower because it resembles the ancient wine vessel “Zun”, which is a typical super high-rise building. Table 3 summarizes the height data of some representative buildings in Beijing CBD area. Therefore, this chapter chooses Beijing CBD as a real example to investigate the influence of multi-scale surrounding buildings on wind load of super high-rise buildings.
Table 3. Height Information of Some Representative Buildings in Beijing CBD Area. | |||||
CITIC Tower | the Concordia Plaza South Tower | the Concordia Plaza North Tower | the China Media Group | Zhongxiu Building | the Samsung Tower |
528 meters | 238 meters | 238 meters | 234 meters | 231 meters | 260 meters |
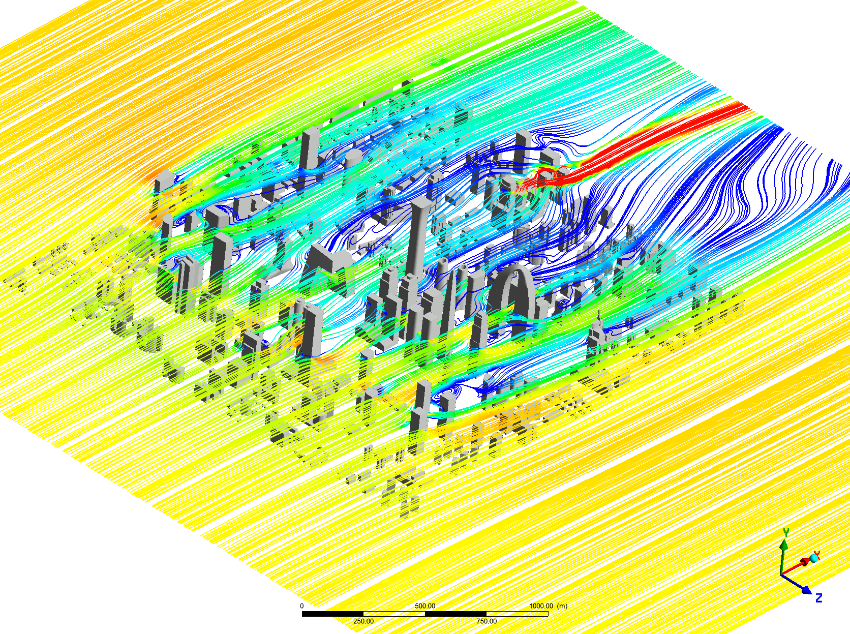
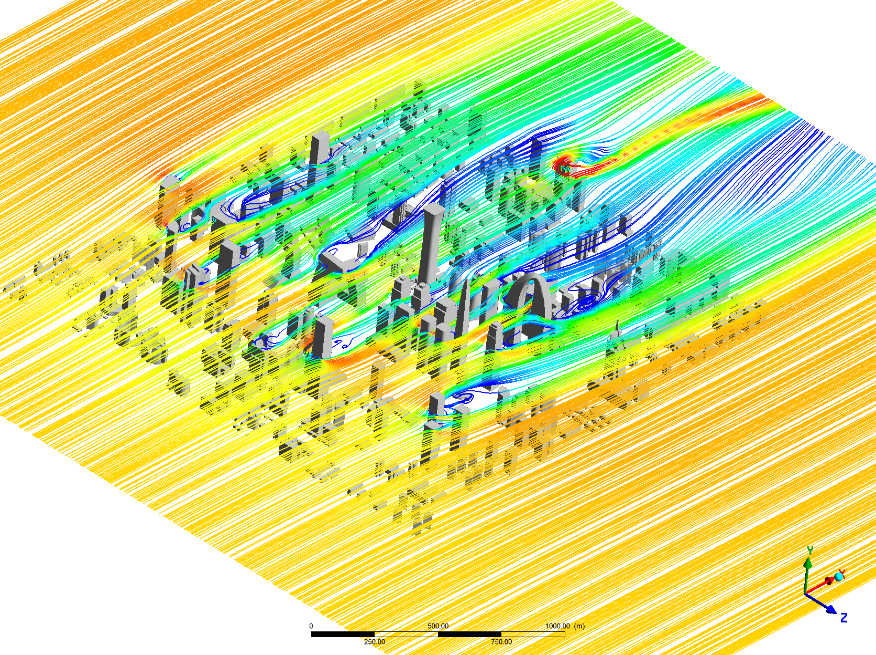
Figure 15 shows the mean velocity field and flow streamlines of the longitudinal section passing through a single axis of symmetry of the CITIC Tower. The wind speed from the front to the CITIC Tower increases from the bottom to the top, especially over the CITIC Tower’s head due to the blocking effect of the building, and the wind produces a recirculation flow on the leeside of the CITIC Tower’s head. Figure 16 shows the average velocity field and flow streamlines passing through the symmetry axis of CITIC Tower in Beijing CBD area. It can be seen that due to the interference of high-rise buildings in the upper reaches of CITIC Tower, there is a large backflow near the ground in the upper reaches of CITIC Tower, and there is backflow below the middle of the windward side of CITIC Tower, which affects the wind load. Moreover, the backflow area at the bottom of the lee side of CITIC Tower is significantly smaller. In addition, a large backflow vortex is also generated in the lower reaches of CITIC Tower.
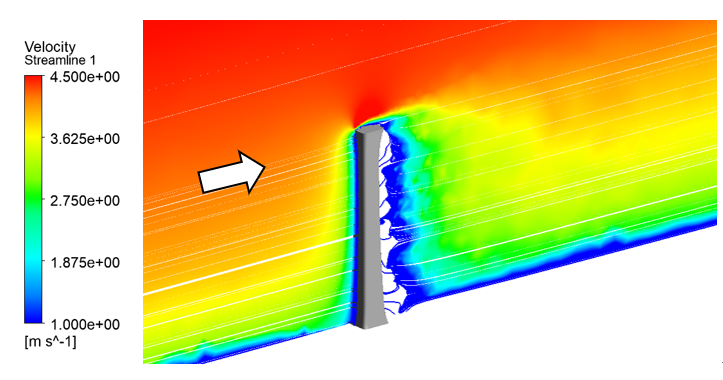
Figure 15. Time mean velocity field over a single longitudinal profile of CITIC Tower.
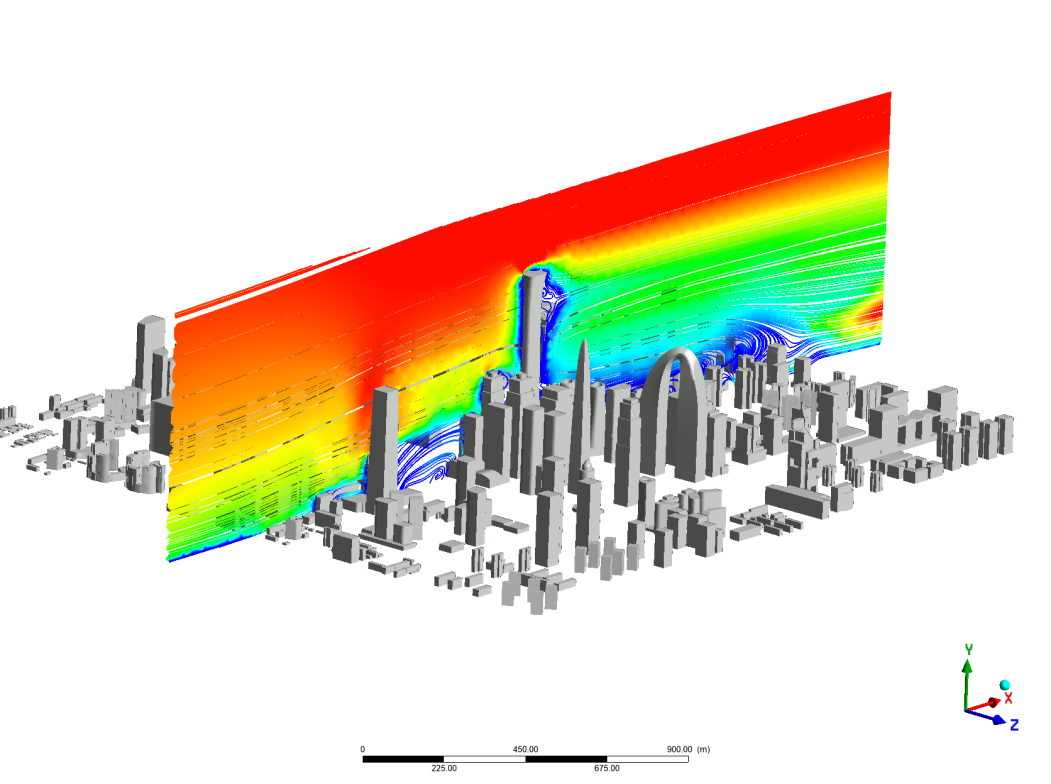
Figure 16. Time mean velocity field of Beijing CBD passing through the longitudinal profile of CITIC Tower.
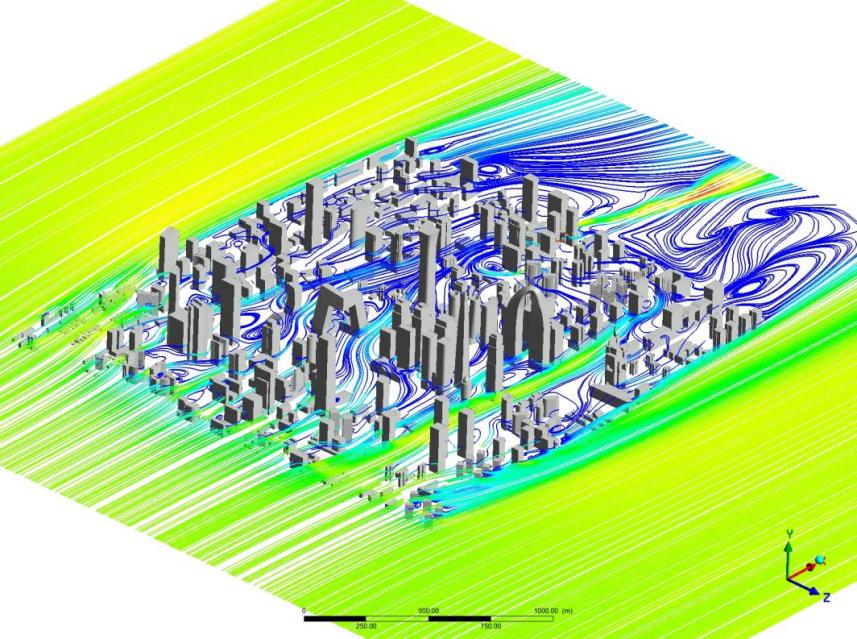
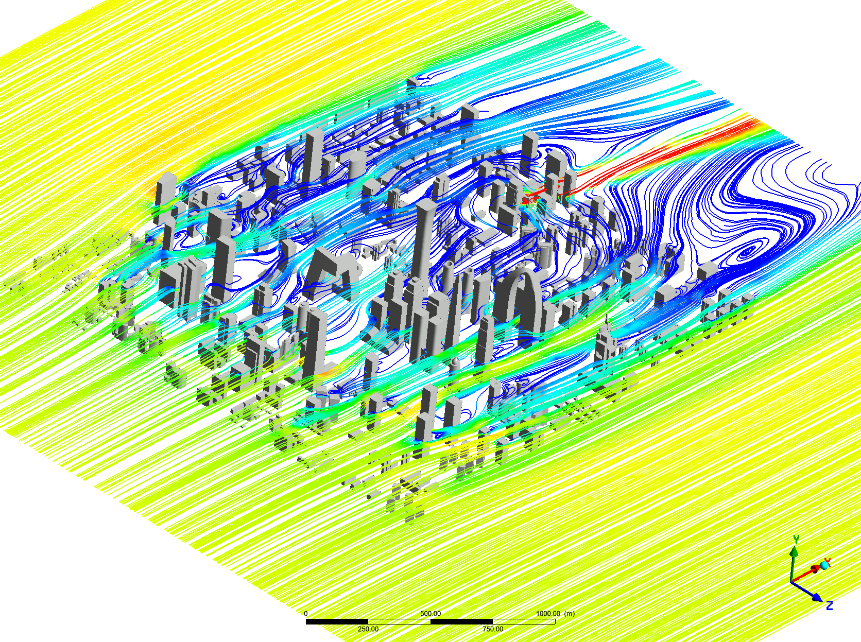
Figure 17 shows the flow charts at different elevations in the Beijing CBD area. There are backflow vortices of different sizes on the back side of each building. Due to the complex flow interference, the flow field inside the building complex is relatively disordered. By comparing Figures 17(a-d), it can be seen that low buildings contribute greatly to creating complex vortices in the near-earth area. Notably, the narrow area of the complex with high wind speed is a main road for traffic, which is the "flow channeling effect" [10]. As the height increases, the overall wind speed increases, and the complexity of backflow gradually decreases. This is because the ground effect and the influence of buildings is lower than the cross-section height decrease, and the number of buildings passing through the streamline on the cross-section decreases. At the height of 200 m (Figure 17d), low buildings have little impact, and the overall wind speed increases further. As the overall number of high-rise buildings is small, the flow field at this height is relatively simple.
a) At the height of 50 meters
b) At the height of 100 meters
c) At the height of 150 meters
d) At the height of 200 meters
Figure 17. Tower Time mean velocity field at different heights in Beijing CBD area.
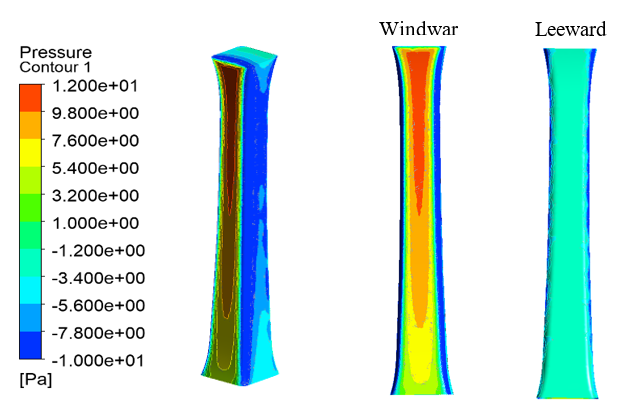
Figure 18. Pressure distribution for a single CITIC Tower.
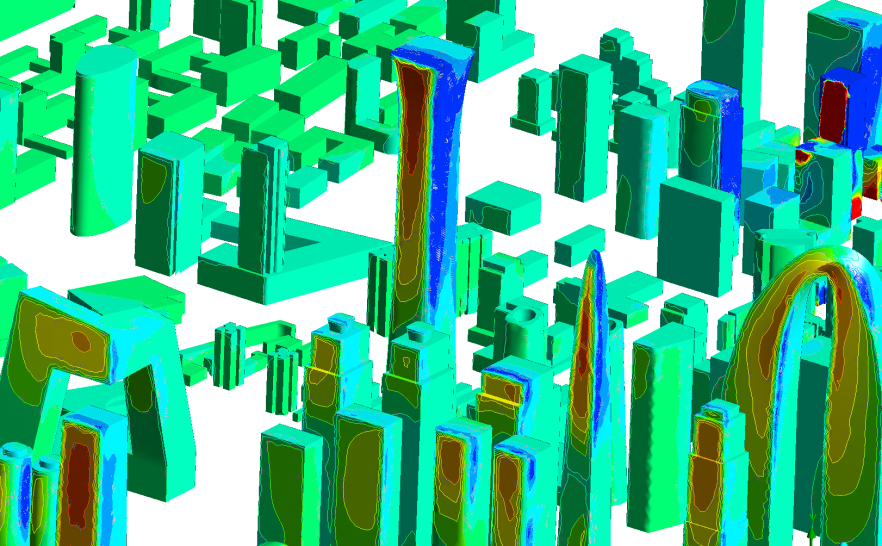
Figure 19. Surface pressure distribution of buildings around CITIC Tower in Beijing CBD area.
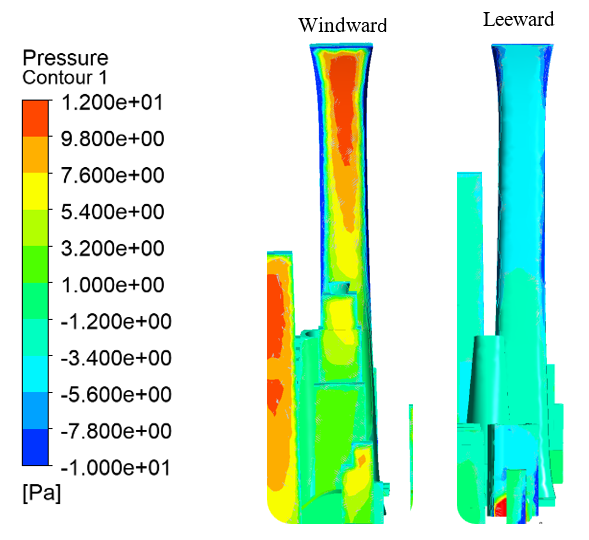
Figure 20. Pressure distribution on the windward and leeward sides of CITIC Tower in Beijing CBD area.
Figure 18 shows the pressure distribution on the surface of a single building. It can be seen that the pressure distribution on the windward side increases from bottom to top, with greater pressure in the middle to top region (shown in red). The pressure distribution on the leeward side was uniform, and the range was all in the range of [-3.4 Pa, -1.2 Pa]. Figure 20 shows the surface pressure distribution of buildings around CITIC Tower in the real Beijing CBD. It can be seen that the pressure near the top of the windward side of the upstream high-rise buildings is relatively large, while the pressure on the windward side of the downstream high-rise buildings does not change much because they are blocked. By comparing Figure 20 and Figure 18, it can be found that there is a significant difference between them. Due to the existence of high-rise buildings in the upstream of CITIC Tower, the pressure in the middle and upper part of the windward side decreases. There is a slight increase in pressure below the middle of the lee side. This also shows that the surrounding high-rise buildings can have an important impact on the windward wind load of target super high-rise buildings.
5. Conclusion
The safety of super high-rise buildings is a common concern of people. This paper takes the wind load of super high-rise buildings as the research object, aiming to explore the influence of surrounding multi-scale buildings, which can provide important guidance for wind safety design of super high-rise buildings and future planning of urban buildings. In this paper, the wind fields of simplified models with different layouts are first considered. It is found that the surrounding high-rise buildings can significantly affect the pressure distribution on the windward side of super high-rise buildings, such as fluctuating wind pressure, extreme wind pressure and average wind pressure. Especially when there are only high-rise buildings around, the root mean square of pressure on the windward side of super high-rise buildings increases significantly, about 1.83 times that of a single building, and characteristic frequency emerges, which may cause wind vibration and harm the safety of super high-rise buildings. In addition, it is found that the surrounding low buildings contribute greatly to the formation of complex vortices in the near-earth region, which will increase the negative pressure at the bottom of the back of the super high-rise building. Finally, this paper carries out numerical simulation of wind field of buildings around CITIC Tower in real Beijing CBD, and finds that due to the strong interference effect between different buildings, the actual flow field of buildings is very complicated, especially in the area near the ground. There are significant differences between the facing and lee sides of the ideal single side of China. Therefore, in the future wind resistance design of super high-rise buildings, we need to consider the influence of surrounding buildings, especially high-rise buildings.
References
[1]. Cheng, W. (2018). Study on wind load interference effect of single high-rise building and low building group (Doctoral dissertation). Beijing Jiaotong University.
[2]. Elshaer, A., Gairola, A., Adamek, K., & Bitsuamlak, G. (2017). Variations in wind load on tall buildings due to urban development. Sustainable Cities and Society, 34, 264-277.
[3]. Qin, W., Shi, J., Yang, X., Xie, J., & Zuo, S. (2022). Characteristics of wind loads on Twin-Tower structure in comparison with single tower. Engineering Structures, 251, Part A, 112780.
[4]. Zheng, X., Montazeri, H., & Blocken, B. (2020). CFD simulations of wind flow and mean surface pressure for buildings with balconies: Comparison of RANS and LES. Building and Environment, 173, 106747.
[5]. Li, T., bo, S., Lin, L., Wu, N., & Kuang, J. (2009). Meteorological characteristics of the urban atmospheric boundary layer in Guangzhou[A]; Proceedings of the 26th Annual Meeting of the Chinese Meteorological Society on Climate Resources Application.
[6]. Blocken, B., & Carmeliet, J. (2004). Pedestrian wind environment around buildings: Literature review and practical examples. Journal of Thermal Envelope and Building Science, 28(2), 107-159.
[7]. Kawai, H. (1992). Vortex induced vibration of tall buildings. Journal of Wind Engineering and Industrial Aerodynamics, 41(1–3), 117-128.
[8]. Xiao, Z., Wu, B., Wang, M., Hu, Q., & Yang, W. (2020). Investigation of the Influence of Blocking Effect on the Aerodynamic and Hydrodynamic Characteristics of a Powered Aircraft Model. IOP Conference Series: Materials Science and Engineering, 751.
[9]. Asghari Mooneghi, M., & Kargarmoakhar, R. (2016). Aerodynamic Mitigation and Shape Optimization of Buildings: Review. Journal of Building Engineering, 6, 225-235.
[10]. Bitsuamlak, G. T., Stathopoulos, T., & Beddoes, I. (2004). Numerical evaluation of wind flow over complex terrain: review. Journal of Aerospace Engineering, 17(4), 135-145.
Cite this article
Li,Z.;Sun,Z. (2023). How the surrounding multi-scale building clusters affect the wind loads of the super high-rise building. Applied and Computational Engineering,26,1-19.
Data availability
The datasets used and/or analyzed during the current study will be available from the authors upon reasonable request.
Disclaimer/Publisher's Note
The statements, opinions and data contained in all publications are solely those of the individual author(s) and contributor(s) and not of EWA Publishing and/or the editor(s). EWA Publishing and/or the editor(s) disclaim responsibility for any injury to people or property resulting from any ideas, methods, instructions or products referred to in the content.
About volume
Volume title: Proceedings of the 2023 International Conference on Functional Materials and Civil Engineering
© 2024 by the author(s). Licensee EWA Publishing, Oxford, UK. This article is an open access article distributed under the terms and
conditions of the Creative Commons Attribution (CC BY) license. Authors who
publish this series agree to the following terms:
1. Authors retain copyright and grant the series right of first publication with the work simultaneously licensed under a Creative Commons
Attribution License that allows others to share the work with an acknowledgment of the work's authorship and initial publication in this
series.
2. Authors are able to enter into separate, additional contractual arrangements for the non-exclusive distribution of the series's published
version of the work (e.g., post it to an institutional repository or publish it in a book), with an acknowledgment of its initial
publication in this series.
3. Authors are permitted and encouraged to post their work online (e.g., in institutional repositories or on their website) prior to and
during the submission process, as it can lead to productive exchanges, as well as earlier and greater citation of published work (See
Open access policy for details).
References
[1]. Cheng, W. (2018). Study on wind load interference effect of single high-rise building and low building group (Doctoral dissertation). Beijing Jiaotong University.
[2]. Elshaer, A., Gairola, A., Adamek, K., & Bitsuamlak, G. (2017). Variations in wind load on tall buildings due to urban development. Sustainable Cities and Society, 34, 264-277.
[3]. Qin, W., Shi, J., Yang, X., Xie, J., & Zuo, S. (2022). Characteristics of wind loads on Twin-Tower structure in comparison with single tower. Engineering Structures, 251, Part A, 112780.
[4]. Zheng, X., Montazeri, H., & Blocken, B. (2020). CFD simulations of wind flow and mean surface pressure for buildings with balconies: Comparison of RANS and LES. Building and Environment, 173, 106747.
[5]. Li, T., bo, S., Lin, L., Wu, N., & Kuang, J. (2009). Meteorological characteristics of the urban atmospheric boundary layer in Guangzhou[A]; Proceedings of the 26th Annual Meeting of the Chinese Meteorological Society on Climate Resources Application.
[6]. Blocken, B., & Carmeliet, J. (2004). Pedestrian wind environment around buildings: Literature review and practical examples. Journal of Thermal Envelope and Building Science, 28(2), 107-159.
[7]. Kawai, H. (1992). Vortex induced vibration of tall buildings. Journal of Wind Engineering and Industrial Aerodynamics, 41(1–3), 117-128.
[8]. Xiao, Z., Wu, B., Wang, M., Hu, Q., & Yang, W. (2020). Investigation of the Influence of Blocking Effect on the Aerodynamic and Hydrodynamic Characteristics of a Powered Aircraft Model. IOP Conference Series: Materials Science and Engineering, 751.
[9]. Asghari Mooneghi, M., & Kargarmoakhar, R. (2016). Aerodynamic Mitigation and Shape Optimization of Buildings: Review. Journal of Building Engineering, 6, 225-235.
[10]. Bitsuamlak, G. T., Stathopoulos, T., & Beddoes, I. (2004). Numerical evaluation of wind flow over complex terrain: review. Journal of Aerospace Engineering, 17(4), 135-145.