


1. Introduction
Mushrooms that may be eaten are a valuable source of nutrients and have long been used in traditional medicine. Yet, because they frequently resemble one another in appearance, it can be difficult to tell which mushrooms are edible and which are deadly. It may be exceedingly challenging for most individuals to distinguish between forms that are so similar. Automated categorization of edible mushrooms based on image analysis has grown in popularity in recent years with the advent of computer vision and machine learning technology.
Numerous studies have been conducted to develop effective image classification methods for edible mushrooms, including feature extraction, deep learning, and ensemble methods [1]. However, the performance of these methods varies significantly depending on the dataset and the specific classification problem. Therefore, it is essential to evaluate and compare the performance of different image classification methods for edible mushroom recognition. In some previous studies, machine learning methods such as Decision Tree and Support Vector Machine were used [2-3]. This study proposes to investigate the performance of several state-of-the-art image classification methods for recognizing edible mushrooms, including GoogLeNet, ResNet, and SENet [4]. Comparing the accuracy, loss function, and precision of these methods using the same datasets of edible and poisonous mushrooms, and analyzing the strengths and limitations of each method. The experiments provide insights into the effectiveness of different image classification methods for edible mushroom recognition, which could be useful for developing practical mushroom identification systems in the future.
2. Related works
In previous studies, many technicians have tried to use different techniques to distinguish the edibility of mushrooms, but the results were not particularly good. Some relatively good results have been obtained for the identification of mushrooms by text analysis, for example, using the growth environment of mushrooms, the length of their rhizomes, the shape of their caps, etc. [5], but these s-identification methods lack a certain generalisation capability. However, these methods lack generalisation capability and can only identify mushrooms in a specific region. As we can see from the annual news reports, many adventurers and travellers still suffer from food poisoning after eating poisonous mushrooms in the wild. For example, it is difficult for a layman to distinguish the difference in shape of the mushroom's cap. Considering that the consumption of mushrooms is a matter of life and death, there is a need to consider better techniques for identifying mushrooms as poisonous or not.
Wibowo [6] proposed three methods to classify mushrooms using Decision Tree (C4.5), NaiveBayes and Support Vector Machine (SVM, which has an accuracy of 100% in its introduction, but considering that he only used Agaricus and Lepiota family mushroom data, its generalisation ability is very weak.
Zahan used three other different models, InceptionV3, VGG16 and ResNet50, and his data consisted of 8190 different mushroom images with an accuracy of 88.4%. He divided the 8190 images into a training set and a test set in a ratio of 8:2 for training the model [7]. This study used contrast enhancement to pre-process the images, and then extracted features and trained them using the three different CNN networks mentioned above. However, it can be seen from the results that all the models received a boost after using contrast enhancement, which indicates that contrast enhancement may be a good image pre-processing method for edible mushroom recognition.
Chitayael [8] proposed the use of K-Nearest Neighbor and decision tree methods. His dataset was a documentation of the characteristics of the different mushrooms with 8124 data totals found from the kaggle website, which contained a variety of mushroom features such as gill colour, stem shape, stalk root, stalk surface-upper ring, stalk surface-lower ring, stalk colour-upper ring, etc [9]. For data pre-processing, he used the correlation matrix and heat map technique, as it is not textual information, so this technique allows for the selection of some of the more important features or variables.
On the basis of these studies, first thing to do is downloaded a toxic and non-toxic mushroom with 11703 data from kaggle as the experiment dataset. This is a completely new data. While some previous studies have been conducted using mushroom features as the basis for experiments, this experiment will be operated using picture recognition methods in view of the development of computer vision. The first thing to do was to divide the overall dataset into a training set and a test set shown in Table 1, dividing the 11703 data were divided into a training set and a test set in a ratio of 8:2, and the models were trained using GoogLeNet, ResNet and SENet networks respectively. After comparing the differences in image recognition between Alexnet and GoogLeNet, it was decided to start training with GoogLeNet as the first network model [10].
Table 1. Data set and training set.
Edible Poison All | Edible Poison All | Edible Poison All | |
Train data | 5549 | 3813 | 9362 |
Test data | 1387 | 9547 | 2341 |
3. Data pre-processing
Image preprocessing is an essential step in the image classification task, which aims to prepare raw images for efficient and effective feature extraction by deep learning models [11]. In this work, we adopt the following preprocessing steps to enhance the input data:
Resize the input image to a fixed size: All images are resized to a fixed size of 224x224 pixels, which is a common choice for image classification tasks. This is achieved by applying bilinear interpolation to preserve the aspect ratio.
Data normalization: Normalizing the image data is a common preprocessing step to reduce the impact of differences in the color distribution between images. In the study, normalize the pixel values by subtracting the mean and dividing by the standard deviation of the dataset. The mean and standard deviation values are calculated from the training set.
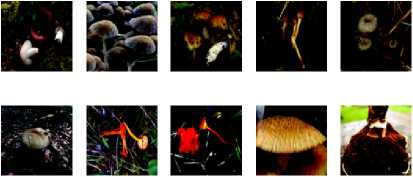
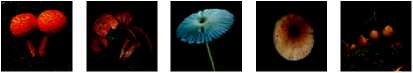
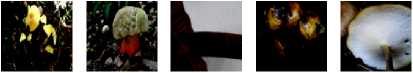
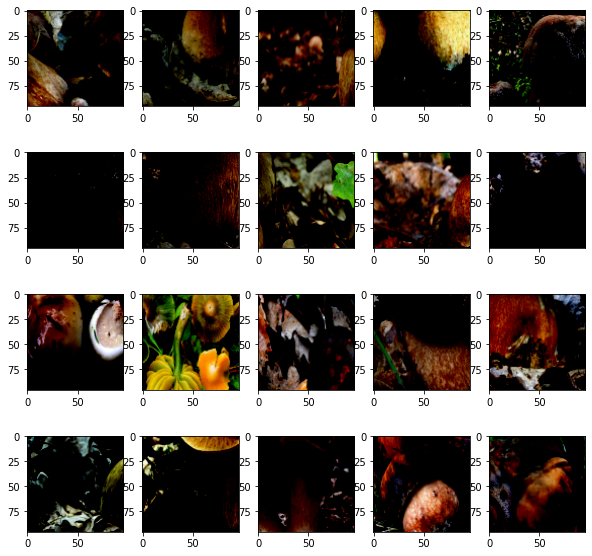
Data augmentation: Data augmentation is a technique that artificially increases the size of the training set by applying transformations to the original images. This helps to improve the robustness and generalization of the deep learning models. In the study, apply random horizontal flipping and random cropping with padding to the input images during training. Figures 1 and 2 show how a portion of the images appear after pre-processing.
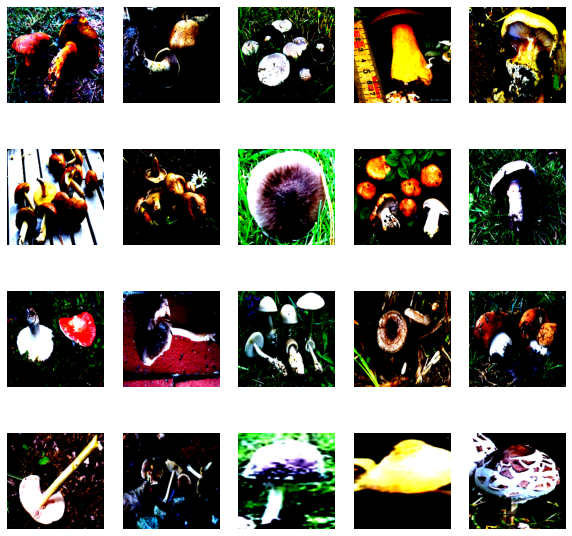
In order to solve the overfitting phenomenon, the first idea is to start some image data enhancement operations in the image preprocessing stage, such as randomly flipping the image horizontally to increase the diversity of data or randomly adjusting the color of the image [12]. Figure 3 shows the image after processing.
|
Figure 1. Pre-processing picture part1. |
|
Figure 2. Pre-processing picture part2. |

|
Figure 3. Data augmentation. |
4. Experiments
To classify poisonous and non-poisonous mushrooms, we chose three different models for the experiment: GoogLeNet, ResNet, and SENet.
For GoogLeNet, the inception module is used to extract features of mushrooms that are not easily measurable, while also distinguishing between poisonous and non-poisonous mushrooms. Additionally, GoogLeNet can detect other features in the image, such as color and shape, which helps with the classification task.
ResNet, on the other hand, can efficiently extract and learn features from mushroom images and represent them in a high-dimensional space. It can also learn features about mushrooms such as color, shape, and texture, which makes it a good choice for mushroom classification.
Lastly, in the toxic or non-toxic mushroom classification task, SENet can adaptively adjust the channel weights of the feature map with the SE module. This allows the model to better represent and classify the features of the mushroom image, leading to improved accuracy in classification.
4.1. GoogLeNet
4.1.1 Architecture. GoogLeNet is a new convolutional neural network algorithm proposed in 2014 by the Google team in the paper "Going deeper with convolutions".
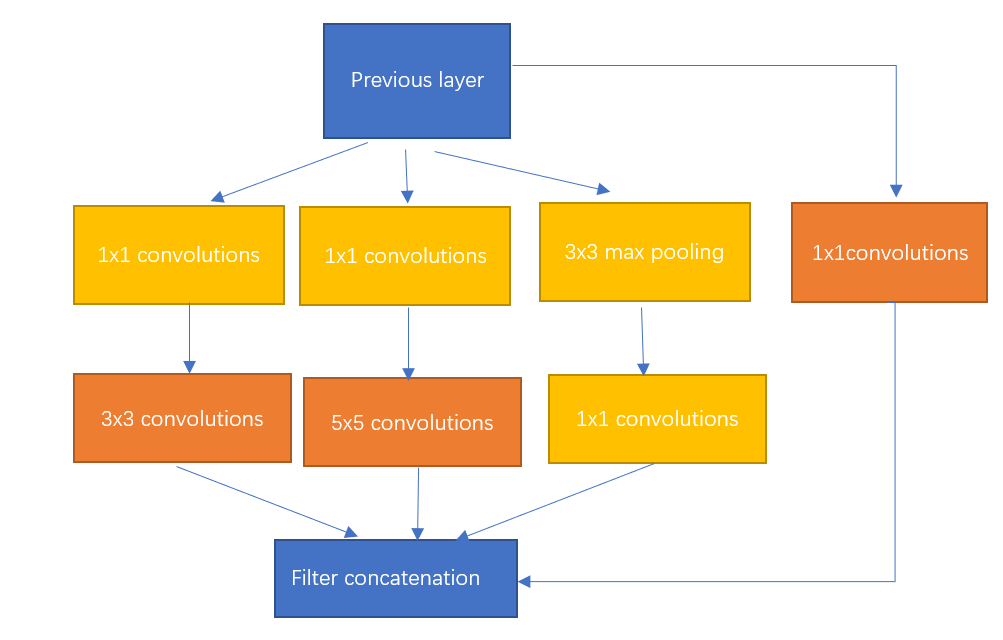
The innovations are the following: the introduction of the Inception structure, the use of a 1*1 convolutional kernel for dimensionality reduction as well as mapping processing, the addition of two auxiliary classifiers to help with training, the use of an average pooling layer for the fully connected layer. The core idea is the Inception module, which is able to significantly improve the performance of the network without increasing the number of parameters and the computational complexity of the network. The structure is shown in Figure 4, and the whole inception structure is made up of several such inception modules strung together.
|
Figure 4. Inception structure. |
4.1.2 Hyperparameters. Random initialisation, using a random number generator to generate some random numbers as the initial values for each parameter in the network.The learning rate is set to 0.001, the batch size is set to 64, the optimizer is the adam optimizer, and the training device is the GPU.The loss function is chosen as CrossEntropy, with the following equation(1):
\( H(p,q)=-\sum _{x}p(x){log_{q}}{(x)} \) (1)
| |
Figure 5. Training accuracy. | |
| |
Figure 6. Training loss. | |
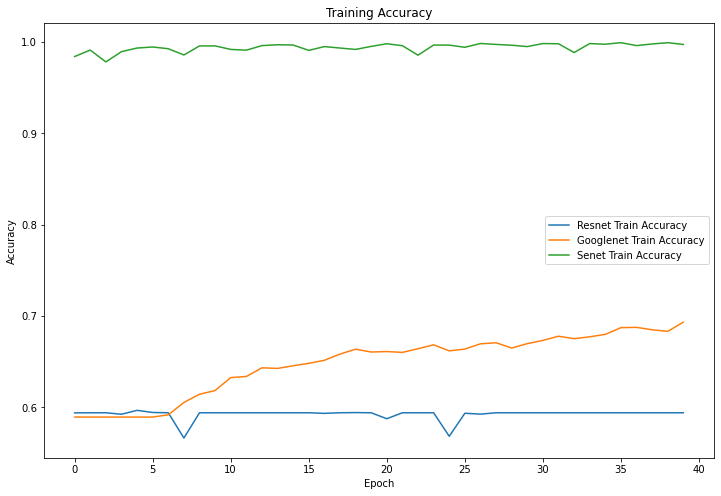
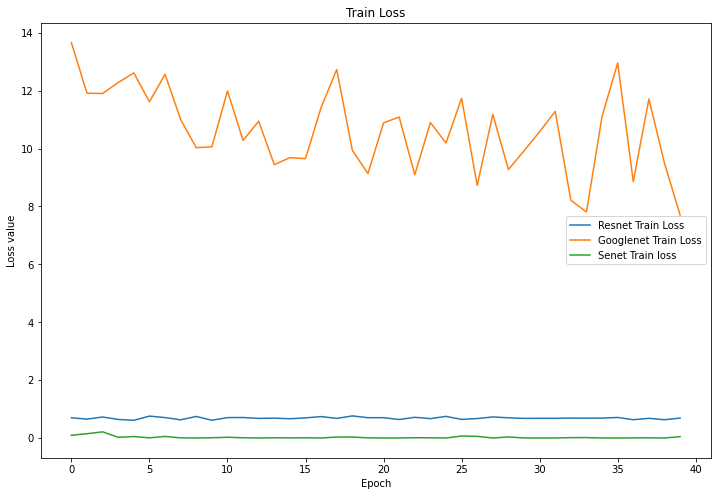
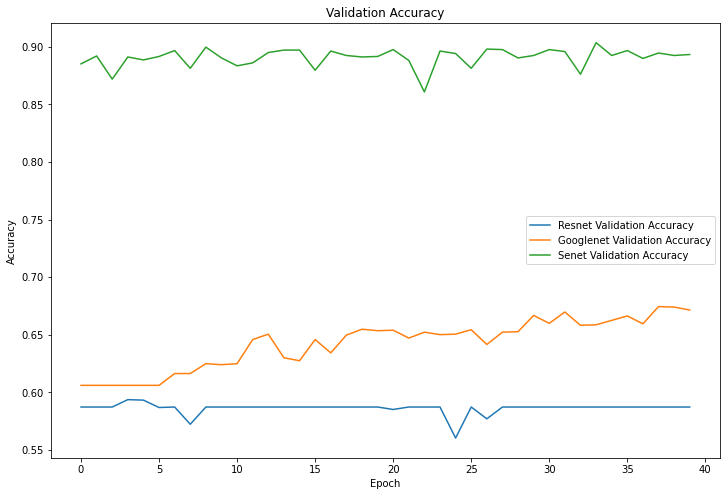
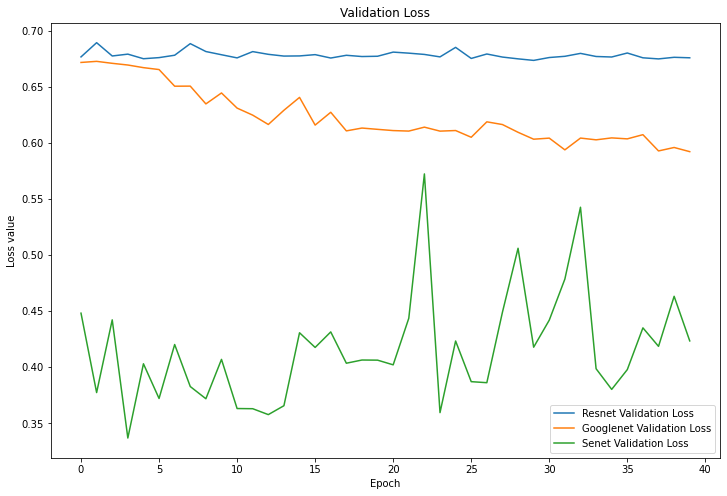
4.1.3 Results. As can be seen from Figure 7, the final accuracy of being able to identify mushrooms as poisonous or non-poisonous has a probability of close to 70%, and as can be seen from the Figure 5 the accuracy during the training process kept rising from 60% at the beginning, and in the accuracy of the training set, and it can be seen to have also kept rising from 60% at the beginning to about 70%. For mushrooms, the accuracy did not reach the expected standard. In Figure 6 and Figure 8, both the training set and the test set have a decreasing trend in loss, but the training set has an initial value of 14 and has a small fluctuation during the training process, eventually reaching around 10, while the test set starts s around 0.65 and finally converges in the interval of 0.6.
|
Figure 7. Validation accuracy. |
|
Figure 8. Validation Loss. |
4.2. ResNet
4.2.1 Architecture. The innovative structure of the proposed Residual block, with its shortcut connection, increases its information flow and argues that for a stacked non-linear layer, it is optimal to make it a constant mapping, but the presence of the shortcut connection makes it easier to turn it into an Identity Mapping.
|
Figure 9. ResNet Construction. |
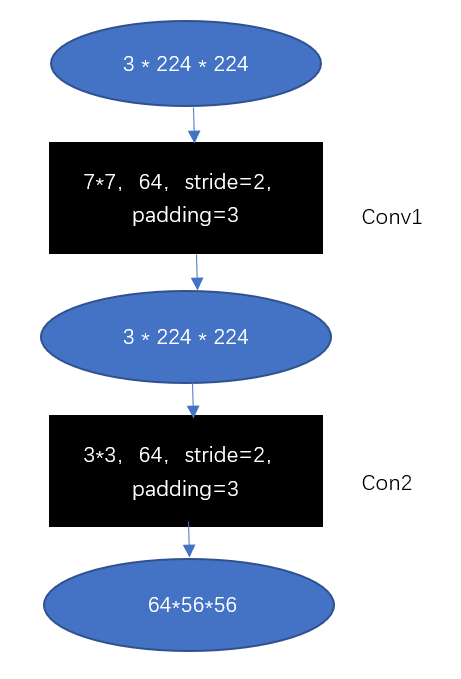
With the help of the BasicBlock-based shallow network ResNet18, Figure 9 only has convolutional and pooling layers. The input and output are shown as ovals, with the channel, height, and width in the middle. The convolutional or pooling layer is a black rectangle that is 33,64, stride=2, and padding=3. The kind of convolutional or pooling layer indicated by the black rectangle is 33,64, stride=3, which denotes that the convolutional layer has 64 output channels, a stride of 2, and a padding of 3. The right side of the box indicates the type of layer that the rectangle represents, such as ''conv1''. In the experiments, the activation function used is Relu and shown in equation (2).
\( F(x)=max(0,x) \) (2)
Using the Adam optimiser, where SoftMax is used as the activation function for all architectures of equation (3).
\( softmax{(}z{)_{i}}=\frac{exp{(}{z_{i}})}{\sum _{j=1}^{K}exp{(}{z_{j}})} \) (3)
4.2.2 Hyperparameters. Random initialization, setting the learning rate to 0.0001, batch sizes to 64, epoch to 40, training device to GPU. The loss function is chosen as CrossEntropy, optimizer to Adam. In the optimizer settings, normalization are added, as shown in equation (4).
\( λ\sum _{i=1}^{n}|{w_{i}}| \) (4)
4.2.3 Results. As can be seen from Figure 5 and Figure 7, ResNet's performance in terms of mushroom accuracy in both the training and test sets basically remains around 60%, with occasional fluctuations reaching 55%, and for the loss values, Figure 6 and Figure 8 show that they also fluctuate around 0.7, without producing too much up and down.
4.3. SENet
4.3.1 Architecture. The SE module has been introduced to adaptively adjust the importance of the channels to each other, thus improving the performance of the network. The introduction of Skip Connection, which helps information to pass better between the different layers. Equation (5) shows the formula for the SE module.
\( {x_{out}}={x_{in}}+γ•\frac{{x_{in}}-μ}{σ+ε}Θβ \) (5)
The feature extraction part and the SE module part. The feature extraction part usually uses classical convolutional neural network structures such as ResNet and Inception, while the SE module is an attention mechanism module added to these basic models.
4.3.2 Hyperparameters. The initial parameters were randomized, the learning rate was set to 0.0001, the batch size was set to 16, the training device was the GPU, and the optimizer was selected as the Adam optimizer.he loss function is chosen as CrossEntropy.
4.3.3 Results. In the correct rates shown in Figures 5 and 7, SENet's classification accuracy for mushrooms is quite high, reaching around 90%, and the training set can reach around 98% correct. The loss value, as seen in Figure 6, remains stable at around 0.5 in the training set and does not fluctuate widely, while in the test machine, it fluctuates between 0.35 and 0.55, with the last output value being 0.40.
5. Discussion
The accuracy equation for this experiment is as follows:
\( Accuracy=\frac{TP+TN}{TP+TN+FP+FN} \) (6)
Accuracy indicates the proportion of correct predictions made by the model. From Table 2, it is obvious that SENet performs best in the mushroom identification task, which can reach 90% accuracy, but the recognition accuracy of ResNet is only 59.12%, and the difference between the two networks is nearly 30% or so. In the training set model, the accuracy of GoogLeNet and ResNet network recognition check not much is around 70%, and SENet is a distant second with 98.12%. Considering that the mushroom images are pre-processed, the features may disappear or invalid information may be extracted, which may lead to a decrease in the accuracy of the ResNet network model for mushroom recognition. The reason why sENet's results are significantly better than other networks with accuracy close to 100% may be that the sE module helps the network to better capture the important features in the mushroom images, thus improving the classification accuracy. In addition, the mushroom recognition classification problem itself is somewhat divisible, as different species of mushrooms have distinct morphological and colour differences, which also helps the model's classification accuracy to improve. GoogLeNet is a moderate level for both the training set and the test machine, and the results of 72.12% and 68.13% may be due to the smaller number of edible mushrooms compared to poisonous mushrooms, which have a There may be a large difference in morphology and colour.
Table 2. Differences in the accuracy of different networks in the training and test sets.
GoogLeNet | ResNet | SENet | |
Training Accuracy | 70.23% | 72.12% | 98.12% |
Validation Accuracy | 68.31% | 59.12% | 90% |
6. Conclusions
The identification of edible mushrooms is a significant problem, as numerous poisonous species exist and can lead to severe health problems. The utilization of deep learning algorithms, such as GoogLeNet, ResNet, and sENet, has shown great potential in addressing this issue. Through a series of experiments on a dataset of 11,000 mushroom images, the three algorithms were able to distinguish between poisonous and non-poisonous mushrooms. While all three algorithms showed promising results, sENet proved to be the most accurate with a recognition accuracy of over 90%. This indicates that the addition of the sE block, which emphasizes the most informative features and suppresses less useful ones, is a significant factor in enhancing the accuracy of the model. However, there is still room for improvement in the performance of these algorithms. The dataset used in this study can be further expanded, and the models can be optimized by adjusting hyperparameters, modifying network architectures, and utilizing more advanced optimization techniques. Moreover, exploring the use of transfer learning, data augmentation, and ensemble learning methods may help improve the accuracy of these algorithms. overall, the development of deep learning algorithms for mushroom identification has significant implications for public health and safety. Further research in this area has the potential to save lives and prevent health hazards caused by accidental ingestion of poisonous mushrooms.
References
[1]. A. in Domain Adaptation Theory, “Image classification." 2019,[Online]. Available:https://www.sciencedirect.com/topics/engineering/ image-classification,[Access:26-Mar-2023].
[2]. A. J. Myles, R. N. Feudale, Y. Liu, N. A. Woody, and S. D. Brown, “An introduction to decision tree modeling," Journal of Chemometrics: A Journal of the Chemometrics Society, vol. 18, no. 6, pp. 275-285, 2004.
[3]. C. Cortes and V. Vapnik, “Support-vector networks," Machine learning, vol. 20, pp. 273-297, 1995.
[4]. J. Hu, L. Shen, and G. Sun, “Squeeze-and-excitation networks," in Proceedings of the IEEE conference on computer vision and pattern recognition, pp. 7132-7141, 2018.
[5]. T. Oder, “Identifying wild mushrooms: What to eat, what to avoid." 2022,[Online]. Available: https://www.treehugger. com,[Access:2023-03-26].
[6]. A. Wibowo, Y. Rahayu, A. Riyanto, and T. Hidayatulloh, “Classification algorithm for edible mushroom identification," in 2018 International Conference on Information and Communications Technology (ICOIACT), pp. 250-253, 2018.
[7]. N. Zahan, M. Z. Hasan, M. A. Malek, and S. S. Reya, “A deep learning-based approach for edible, inedible and poisonous mushroom classification," in 2021 International Conference on Information and Communication Technology for Sustainable Development (ICICT4SD), pp. 440-444, 2021.
[8]. N. Chitayae and A. Sunyoto, “Performance comparison of mushroom types classification using k-nearest neighbor method and decision tree method," in 2020 3rd International Conference on Information and Communications Technology (ICOIACT), pp. 308-313, 2020.
[9]. Kaggle, “Datasets." [Online]. Available: https://www.kaggle. com/datasets,[Access:26-Mar-2023].
[10]. P. Ballester and R. Araujo, “On the performance of googlenet and alexnet applied to sketches," Proceedings of the AAAI Conference on Artificial Intelligence, vol. 30, Feb. 2016.
[11]. S. T. Bow, “Pattern recognition and image preprocessing." ,[Online]. Available: https://books.google.com.tw/ books?hl=zh—CN&lr=&id=5gEqB7C4yAMC&oi=fnd&pg= PP11&dq=Image+preprocessing&ots=q2nDfVUzHS&sig=8pbUTmFZVyPS3lGBHPYk6uHXd8&redir_esc=y#v= onepage&q&f=false,[Access:27-Mar-2023].
[12]. D. M. Hawkins, “The problem of overfitting," Journal of chemical information and computer sciences, vol. 44, no. 1, pp. 1-12, 2004.
Cite this article
Wu,Y. (2023). Recognition of edible mushrooms based on different image classification methods. Applied and Computational Engineering,27,185-193.
Data availability
The datasets used and/or analyzed during the current study will be available from the authors upon reasonable request.
Disclaimer/Publisher's Note
The statements, opinions and data contained in all publications are solely those of the individual author(s) and contributor(s) and not of EWA Publishing and/or the editor(s). EWA Publishing and/or the editor(s) disclaim responsibility for any injury to people or property resulting from any ideas, methods, instructions or products referred to in the content.
About volume
Volume title: Proceedings of the 2023 International Conference on Software Engineering and Machine Learning
© 2024 by the author(s). Licensee EWA Publishing, Oxford, UK. This article is an open access article distributed under the terms and
conditions of the Creative Commons Attribution (CC BY) license. Authors who
publish this series agree to the following terms:
1. Authors retain copyright and grant the series right of first publication with the work simultaneously licensed under a Creative Commons
Attribution License that allows others to share the work with an acknowledgment of the work's authorship and initial publication in this
series.
2. Authors are able to enter into separate, additional contractual arrangements for the non-exclusive distribution of the series's published
version of the work (e.g., post it to an institutional repository or publish it in a book), with an acknowledgment of its initial
publication in this series.
3. Authors are permitted and encouraged to post their work online (e.g., in institutional repositories or on their website) prior to and
during the submission process, as it can lead to productive exchanges, as well as earlier and greater citation of published work (See
Open access policy for details).
References
[1]. A. in Domain Adaptation Theory, “Image classification." 2019,[Online]. Available:https://www.sciencedirect.com/topics/engineering/ image-classification,[Access:26-Mar-2023].
[2]. A. J. Myles, R. N. Feudale, Y. Liu, N. A. Woody, and S. D. Brown, “An introduction to decision tree modeling," Journal of Chemometrics: A Journal of the Chemometrics Society, vol. 18, no. 6, pp. 275-285, 2004.
[3]. C. Cortes and V. Vapnik, “Support-vector networks," Machine learning, vol. 20, pp. 273-297, 1995.
[4]. J. Hu, L. Shen, and G. Sun, “Squeeze-and-excitation networks," in Proceedings of the IEEE conference on computer vision and pattern recognition, pp. 7132-7141, 2018.
[5]. T. Oder, “Identifying wild mushrooms: What to eat, what to avoid." 2022,[Online]. Available: https://www.treehugger. com,[Access:2023-03-26].
[6]. A. Wibowo, Y. Rahayu, A. Riyanto, and T. Hidayatulloh, “Classification algorithm for edible mushroom identification," in 2018 International Conference on Information and Communications Technology (ICOIACT), pp. 250-253, 2018.
[7]. N. Zahan, M. Z. Hasan, M. A. Malek, and S. S. Reya, “A deep learning-based approach for edible, inedible and poisonous mushroom classification," in 2021 International Conference on Information and Communication Technology for Sustainable Development (ICICT4SD), pp. 440-444, 2021.
[8]. N. Chitayae and A. Sunyoto, “Performance comparison of mushroom types classification using k-nearest neighbor method and decision tree method," in 2020 3rd International Conference on Information and Communications Technology (ICOIACT), pp. 308-313, 2020.
[9]. Kaggle, “Datasets." [Online]. Available: https://www.kaggle. com/datasets,[Access:26-Mar-2023].
[10]. P. Ballester and R. Araujo, “On the performance of googlenet and alexnet applied to sketches," Proceedings of the AAAI Conference on Artificial Intelligence, vol. 30, Feb. 2016.
[11]. S. T. Bow, “Pattern recognition and image preprocessing." ,[Online]. Available: https://books.google.com.tw/ books?hl=zh—CN&lr=&id=5gEqB7C4yAMC&oi=fnd&pg= PP11&dq=Image+preprocessing&ots=q2nDfVUzHS&sig=8pbUTmFZVyPS3lGBHPYk6uHXd8&redir_esc=y#v= onepage&q&f=false,[Access:27-Mar-2023].
[12]. D. M. Hawkins, “The problem of overfitting," Journal of chemical information and computer sciences, vol. 44, no. 1, pp. 1-12, 2004.