


1. Introduction
The emergence of Bitcoin and other cryptocurrencies has revolutionized the concept of digital currency by introducing decentralized systems that operate without the need for a central authority. These cryptocurrencies rely on a peer-to-peer network and utilize blockchain technology to record and verify transactions. Among them, Bitcoin holds the largest market capitalization, followed by various altcoins such as Ripple, Litecoin, and Dash [1].
The price dynamics of Bitcoin and other cryptocurrencies can be viewed as time series data, making price prediction a crucial task in this domain. The limited supply and unique characteristics of Bitcoin contribute to its highly volatile nature and lack of correlation with traditional assets. This has attracted considerable attention from financial markets, positioning cryptocurrencies as assets with distinct features [2].
In recent years, deep learning techniques, especially those leveraging convolutional and long short-term memory (LSTM) layers, have gained prominence in time series prediction tasks, including cryptocurrency market analysis [3,4]. Convolutional layers are effective in filtering noise and extracting meaningful features from complex time series data. They excel at capturing intricate patterns and relationships that may not be apparent at first glance.
By combining convolutional and LSTM layers in deep learning architectures, researchers have developed models that can effectively analyze and predict trends in the cryptocurrency market. This hybrid approach capitalizes on the feature extraction capabilities of convolutional layers and the ability of LSTM layers to capture complex temporal dependencies. As a result, it shows promise in enhancing the accuracy and reliability of time series predictions within the realm of cryptocurrency analysis [5].
In this article, the main objective is to compare the performance of various models in predicting cryptocurrency prices using three different datasets. Specifically, this work analyzes the effectiveness of the Moving Average, logistic regression, ARIMA, LSTM, and CNN-LSTM models. By conducting this comparative analysis, the author aims to uncover underlying patterns in cryptocurrency price movements and identify the most accurate and reliable approach for predicting future prices. Through the research, the author seeks to contribute to the development of improved methodologies for cryptocurrency price prediction.
2. Method
2.1. Dataset
The "Cryptocurrency Price Analysis Dataset: BTC, ETH, LTC (2018-2023)" is a comprehensive and valuable resource for researchers, analysts, and cryptocurrency enthusiasts. Covering a period of over five years, from January 1, 2018, to May 31, 2023, this dataset captures the daily price movements of six major cryptocurrencies: Bitcoin (BTC), Ethereum (ETH) and Litecoin (LTC).
With this dataset, the historical price behavior of these popular digital assets could be explored and analyzed. It enables the study of long-term trends, identification of volatility patterns, and gaining insights into the dynamics of the cryptocurrency market.
2.2. Preprocessing
In the research, the Min-Max normalization method is utilized to preprocess the figures. Referred to as feature scaling or data normalization, Min-Max normalization is a widely used data transformation method to ensure all data values are scaled proportionally within a specified range.
The concept of Min-Max normalization is straightforward: by identifying the minimum and maximum values in the dataset, the data is linearly mapped to a new range, typically between 0 and 1. To perform Min-Max normalization for a given feature or variable, following formula is leveraged:
\( {x_{normalizaion}}=\frac{x-{x_{min}}}{{x_{max}}-{x_{min}}} \) (1)
x represents an observation from the original data, minimum value is denoted as \( {x_{min}} \) , and maximum value is denoted as \( {x_{max}} \) .
One of the benefits of Min-Max normalization is its simplicity and ease of implementation. It does not change the shape of the data distribution, but rather linearly maps the data to a new range. This allows for the comparison and uniform treatment of features with different scales and ranges, eliminating any potential bias towards certain features due to scale differences. This preprocessing technique helped enhance the training effectiveness, stability, and prediction accuracy of the models.
2.3. Models
2.3.1. Moving average (MA). MA model is a commonly used technical analysis indicator in financial markets. It assists in identifying underlying patterns by averaging a security's price over a specified time range, effectively reducing the impact of short-term price fluctuations [6]. To make predictions using the MA model, historical data is used to calculate the moving average. The process involves summing the closing prices of the security for the chosen time period, as well as dividing it by the number of data points considered. This provides an average value that represents the current trend in the security's price.
By repeating this calculation for each time step in the validation set, a series of predicted values can be generated. These predictions can provide insights into the potential future direction of the security's price based on its historical behavior.
2.3.2. Logistic regression (LR). Considering the values of a given group of predictor variables, logistic regression (LR) is a widely utilized multivariate analysis model used to forecast whether there exists a property or consequence [7]. Across various domains, this method enjoys widespread popularity, such as corporate finance, banking, and investments. LR has been extensively applied in default-prediction models, where researchers utilize multivariate discriminant analysis (MDA) techniques [8].
2.3.3. ARIMA. Autoregressive Integrated Moving Average, is a widely used statistical regression model for time series forecasting, particularly in finance. It takes into account the previous values of a time series and adjusts for non-stationarity. ARIMA combines the autoregressive (AR) and moving average (MA) models, which are fundamental components of the model. ARIMA's ability to consider lagged values and handle non-stationarity makes it a popular choice for linear time series forecasting [9].
2.3.4. LSTM. RNN (Recurrent Neural Network) was initially introduced for learning sequential patterns in time series data. To solve the problem of vanishing gradients that RNN cannot handle, LSTM (Long Short-Term Memory) was developed. It incorporates three gate mechanisms within its structure, which belongs to recurrent neural network that effectively tackle the problem. Additionally, LSTM introduces a separate mechanism for memory cell transmission, allowing information to be propagated across different time intervals. This makes LSTM suitable for extracting temporal features from time series data and enables it to learn long-term dependencies within the sequence. The structure of LSTM consists of three types of gates: input gate, forget gate, and output gate [10]. These gates control the flow by selectively enabling or blocking the entry and exit of data in the neurons. The neuron's input gate regulates the data to be accepted, the output gate governs the data to be transmitted, and the forget gate determines the data to be disregarded. Furthermore, hidden state after computation also serves as the historical hidden state for the next neuron. The computation of current neuron's state after processing is different from that of represents the hidden state after computation, allowing for independent storage of memory data and long-term memory capabilities.
2.3.5. CNN-LSTM. This work developed a CNN-LSTM model tailored for time series forecasting in the cryptocurrency market. The architecture of the model combines Convolutional Neural Networks (CNNs) with Long Short-Term Memory (LSTM) networks to effectively capture both local patterns and temporal dependencies present in cryptocurrency price data. The CNN component of the model utilizes 1D convolutional layers to extract local features from the historical price data. By applying filters to the input sequence, the CNN identifies and captures important patterns, such as short-term fluctuations and local trends. The use of multiple convolutional layers with batch normalization helps enhance the model's feature extraction capabilities. The output from the CNN layers is then fed into the LSTM component of the model. The LSTM layers are capable of grasping and understanding long-term relationships within the time series data. This includes capturing recurring patterns and seasonality present in the data [10]. By incorporating LSTM layers, the model can effectively capture the complex relationships and dependencies present in cryptocurrency price data, which is crucial for accurate prediction.
The loss function of the model utilizes the mean squared error (MSE) to quantify the discrepancy of its predicted cryptocurrency prices from the actual prices during the training process. To update the model's parameters and minimize the loss, this work considers the Adam optimizer. The model is trained using a historical dataset of cryptocurrency prices, iteratively optimizing the model over multiple epochs.
By leveraging the combined power of CNNs and LSTMs, the proposed CNN-LSTM model can effectively analyze and forecast cryptocurrency prices.
2.4. Evaluation matrixes
Widely used MASE, RMSE, and RMAE are chosen to be model evaluation metrics. MASE measures the relative accuracy of a model by comparing it to a naive or baseline model, with values less than 1 indicating better performance. RMSE, irrespective of the scale of the values, is a useful method to uncover relatively large prediction errors. It calculates the average magnitude of residuals between predicted and actual values, penalizing larger errors more than MAE. RMAE, similar to RMSE, uses absolute errors and provides a measure of average magnitude. These metrics assist in assessing the accuracy and quality of predictions, enabling model comparison, selection, and performance monitoring. These equations are shown below, where \( {R_{i}} \) represents the true price and \( \hat{{R_{i}}} \) represents the predicted ones.
\( RMSE=\sqrt[]{\frac{1}{n}\sum _{i=1}^{n}{(\hat{{R_{i}}}{-R_{i}})^{2}}} \) (2)
\( RMAE=\sqrt[]{\frac{1}{n}\sum _{i=1}^{n}|\hat{{R_{i}}}-R_{i}|} \) (3)
\( MAPE=\frac{1}{n}\sum _{i=1}^{n}|\frac{\hat{{R_{i}}}-{R_{i}}}{{R_{i}}}| \) (4)
3. Result and discussion
3.1. Performance on Bitcoin (BTC)
The experimental results of five models on the BTC dataset are demonstrated in Figure 1.
The MA, Logistic Regression, and ARIMA models consistently exhibit a similar pattern in their predictions, showing an upward trend, while the actual prices experience a downward trend followed by an upward trend.
However, it is important to note that these models have limitations and may struggle to capture complex trends and non-linear patterns in the data. Their inability to accurately reflect the actual trend indicates the need for more sophisticated and flexible models that can capture the nuances of the underlying data dynamics. Both the LSTM and CNN-LSTM models demonstrate a strong fit to the actual price trend. They are able to capture the complex patterns and dynamics present in the data more effectively compared to other models.
The time units on the x-axis are decreased for both the LSTM and CNN-LSTM models to observe more intricate trends as shown in Figure 2. Results show the CNN-LSTM model outperforms the LSTM model in capturing price trends with greater detail. The CNN-LSTM model offers more refined predictions, offering a deeper understanding of the patterns in price movement. However, both models exhibit lagging effects in their predictions.
Moreover, It appears that the LSTM model tends to produce predictions that are generally lower than the actual results, indicating a potential underestimation of the target variable and leading to relatively conservative predictions. Alternatively, the opposite trend was shown in the CNN-LSTM mode, suggesting that it tends to overestimate the target variable with its predictions, which may tend to be more optimistic.
It is crucial to acknowledge that the conclusions drawn from these observations are specific to the dataset and model performance mentioned in the statement. The performance of models can vary significantly depending on the characteristics and peculiarities of the dataset at hand.
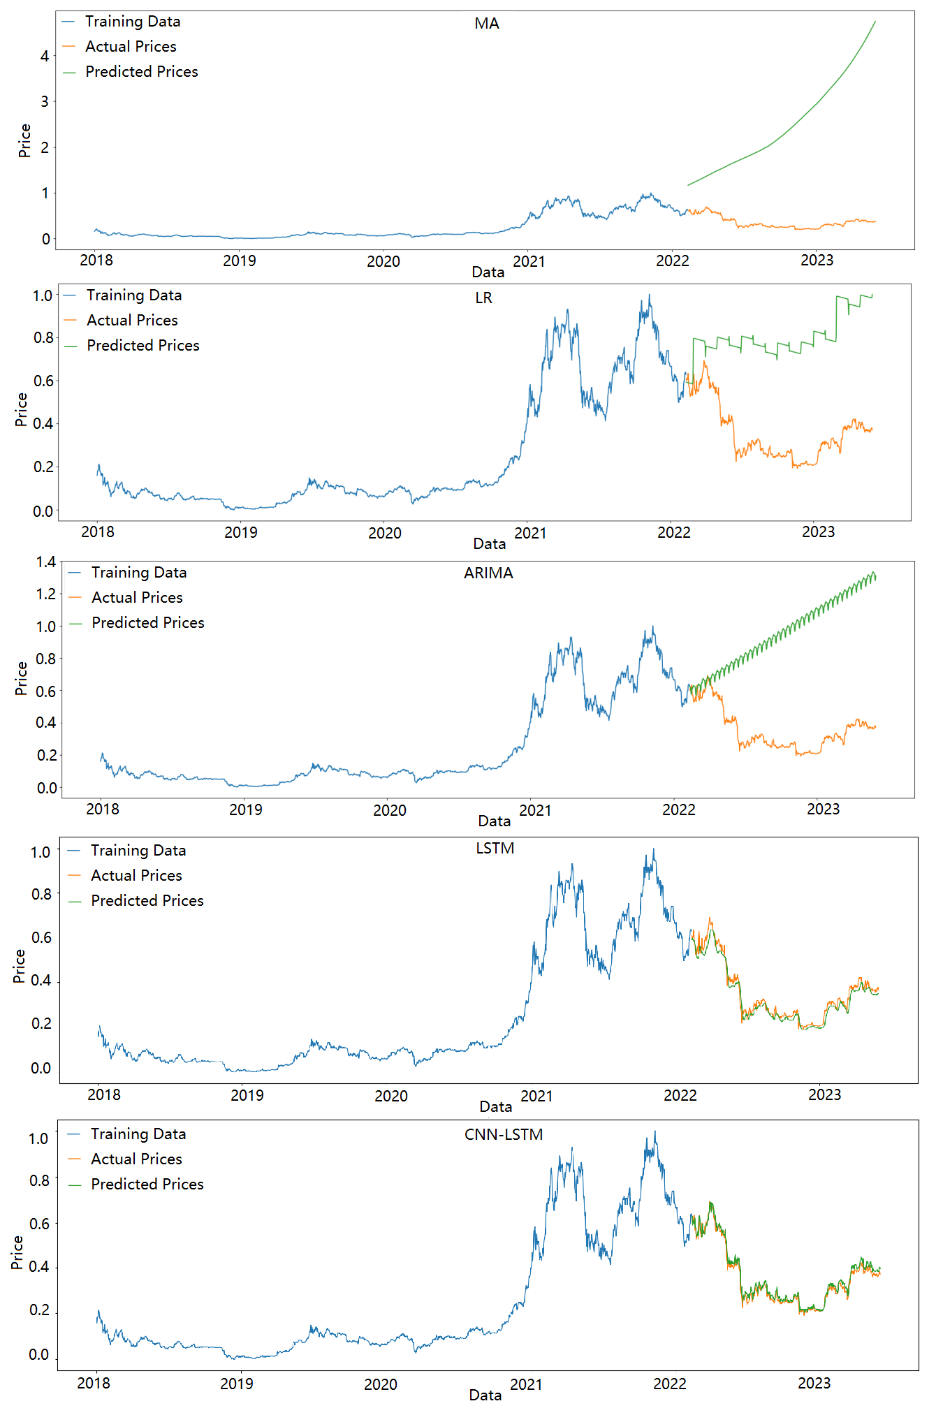
Figure 1. Prediction visualization on BTC data (Figure credit: Original).
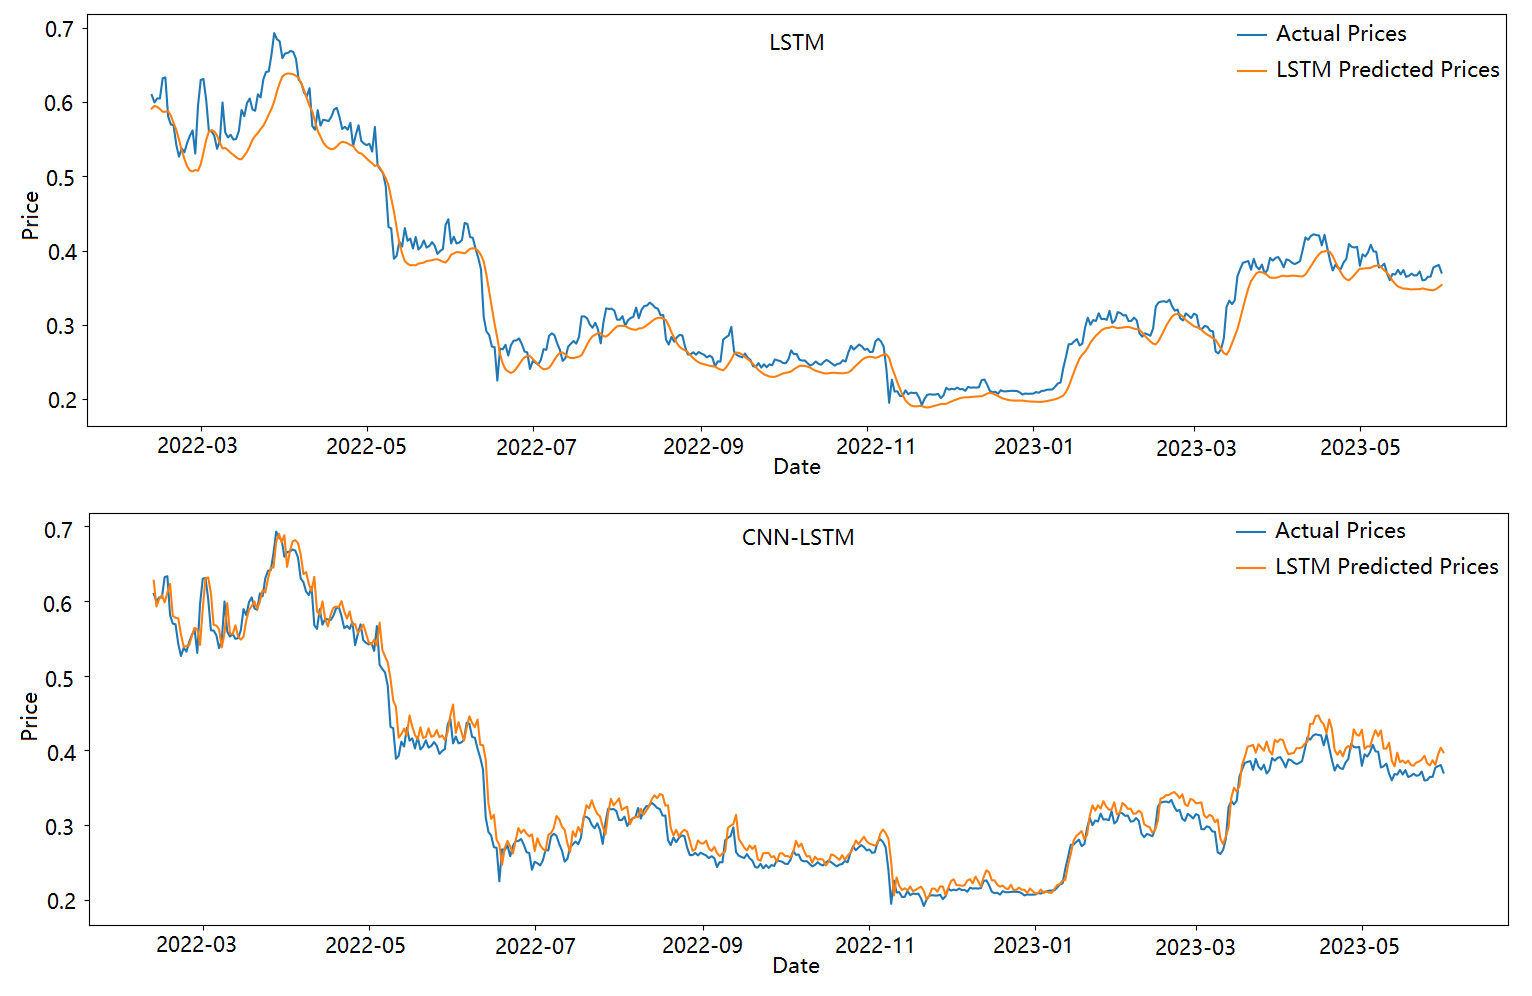
Figure 2. Actual Price and Predicted Price of LSTM and CNN-LSTM models of Bitcoin (BTC) on 11 February 2022 to 31 May 2023 (Figure credit: Original).
3.2. Performance on Litecoin (LTC)
Experimental results of a model on a single dataset can be subject to randomness. Furthermore, predictions are performed also on LTC and others. These insights are crucial for developing more accurate and reliable stock price prediction models and improving their applicability in real-world scenarios.
The experimental results of five models on the LTC dataset are shown in Figure 3.
Indeed, MA models can struggle to capture the underlying trends and dynamics of non-periodic data, and ARIMA models may have limitations when applied to cryptocurrencies due to their non-periodic nature. A variety of elements such as market sentiment, news events, and technological advancements influence Cryptocurrency prices, which may not adhere to the assumptions of stationarity and periodicity in ARIMA modeling.
An interesting observation is that the Logistic Regression (LR) model, despite its higher predicted values compared to the actual situation, provides a general prediction that aligns more closely with the true trend, which can still be valuable in certain scenarios. Similar to BTC, Both the CNN and CNN-LSTM models demonstrate accurate predictions in the given context.
The time units is decreased ton the x-axis for both the LSTM and CNN-LSTM models to observe more intricate trends as show in Figure 4. The analysis indicates that the CNN-LSTM model outperforms the LSTM model in capturing price trends with a higher level of detail. In contrast, the result from LSTM appears to struggle in predicting local peak values and tends to generate more conservative and lower predictions compared to the true values. This suggests that the LSTM model may not fully capture the extreme fluctuations or sudden spikes in cryptocurrency prices.
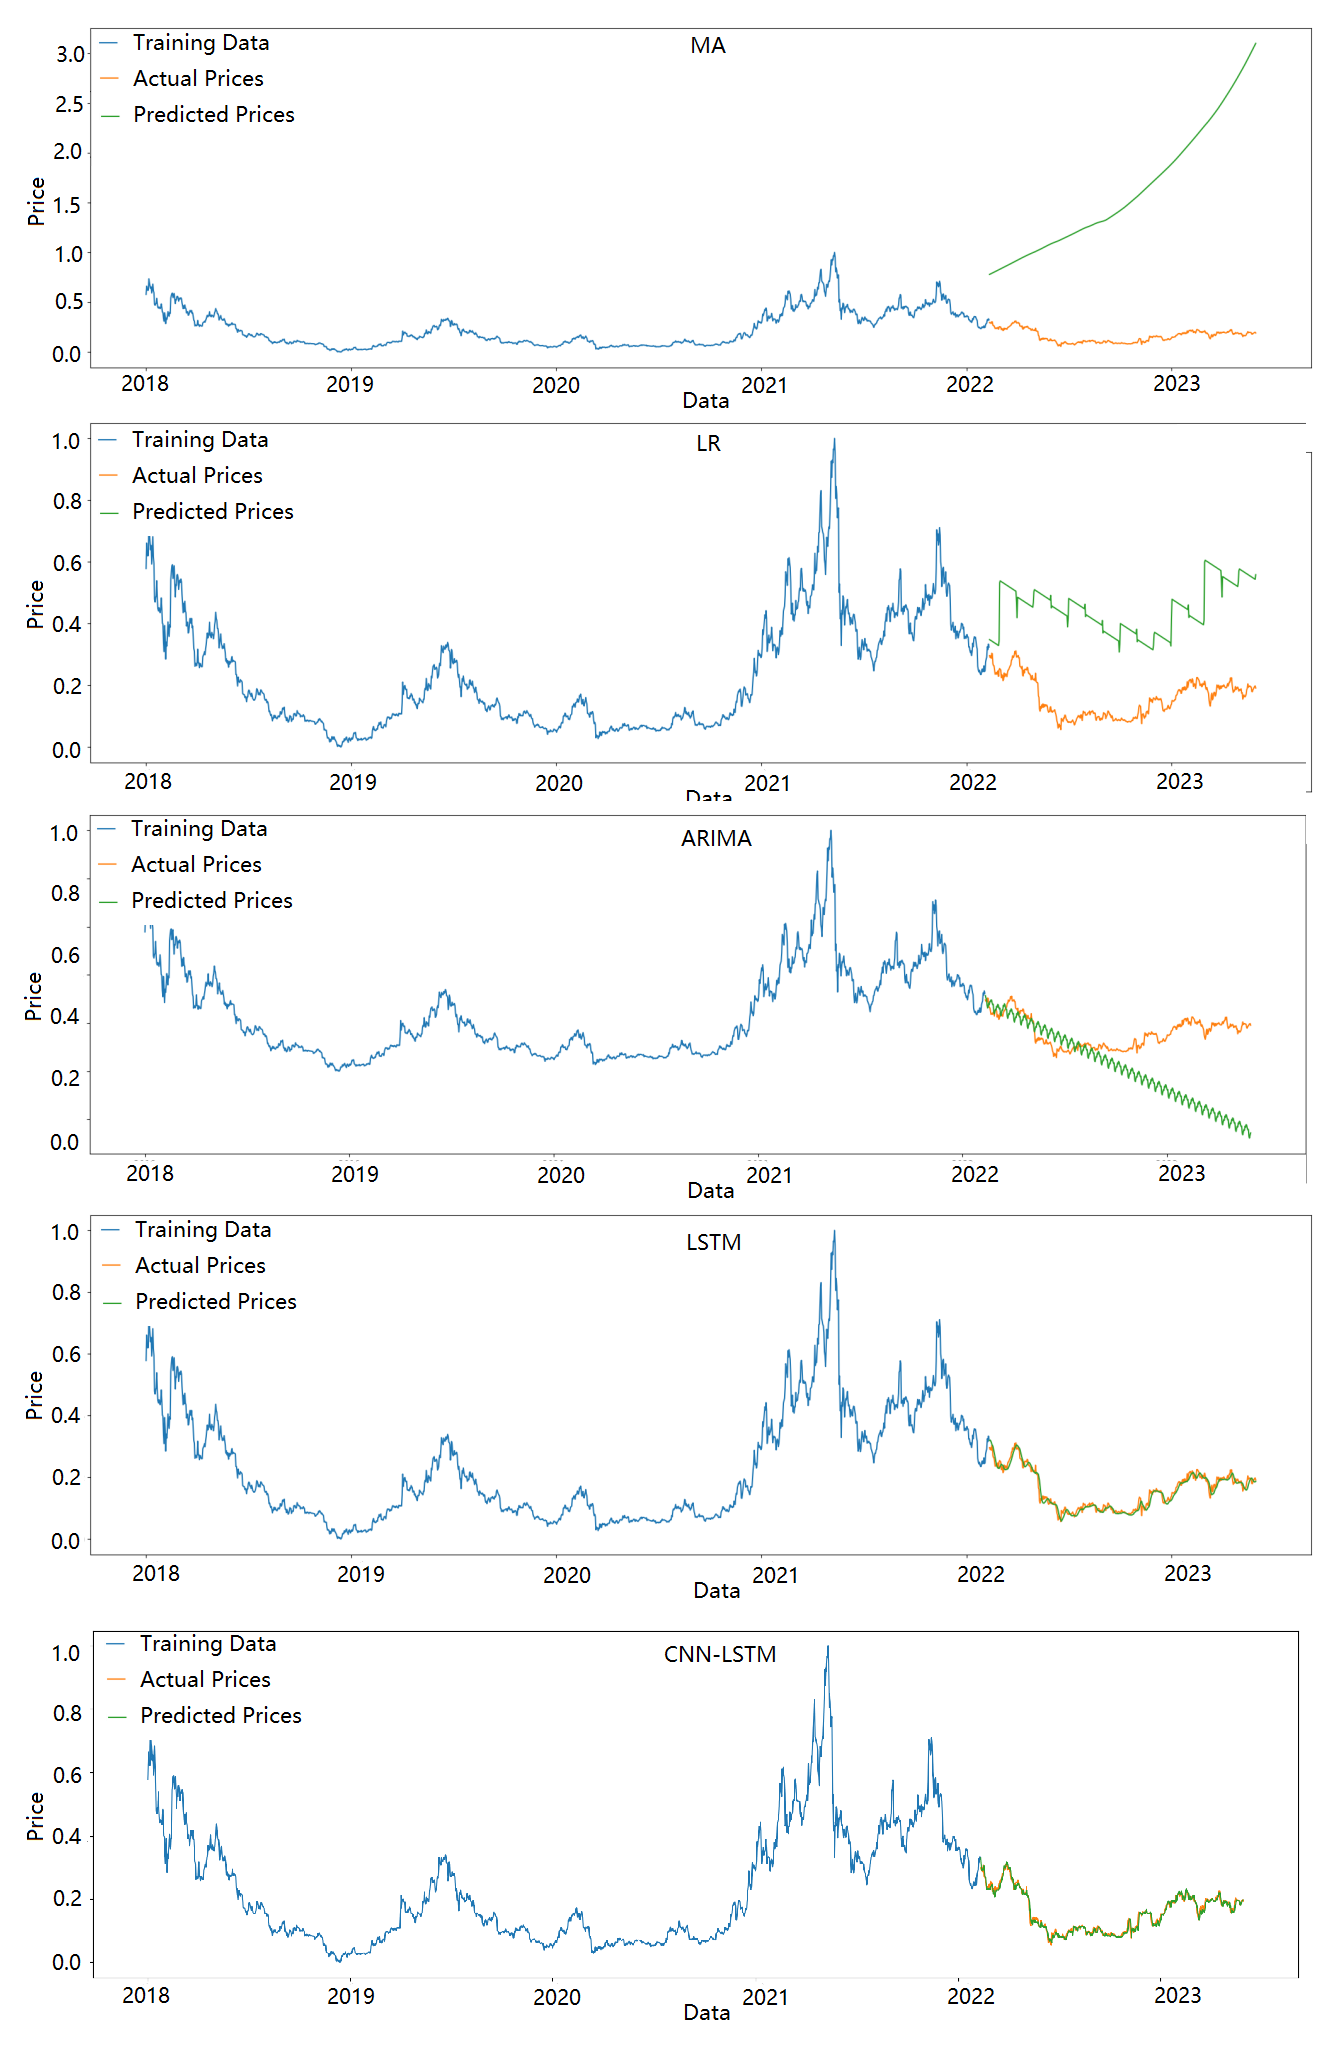
Figure 3. Prediction visualization on LTC data (Figure credit: Original).
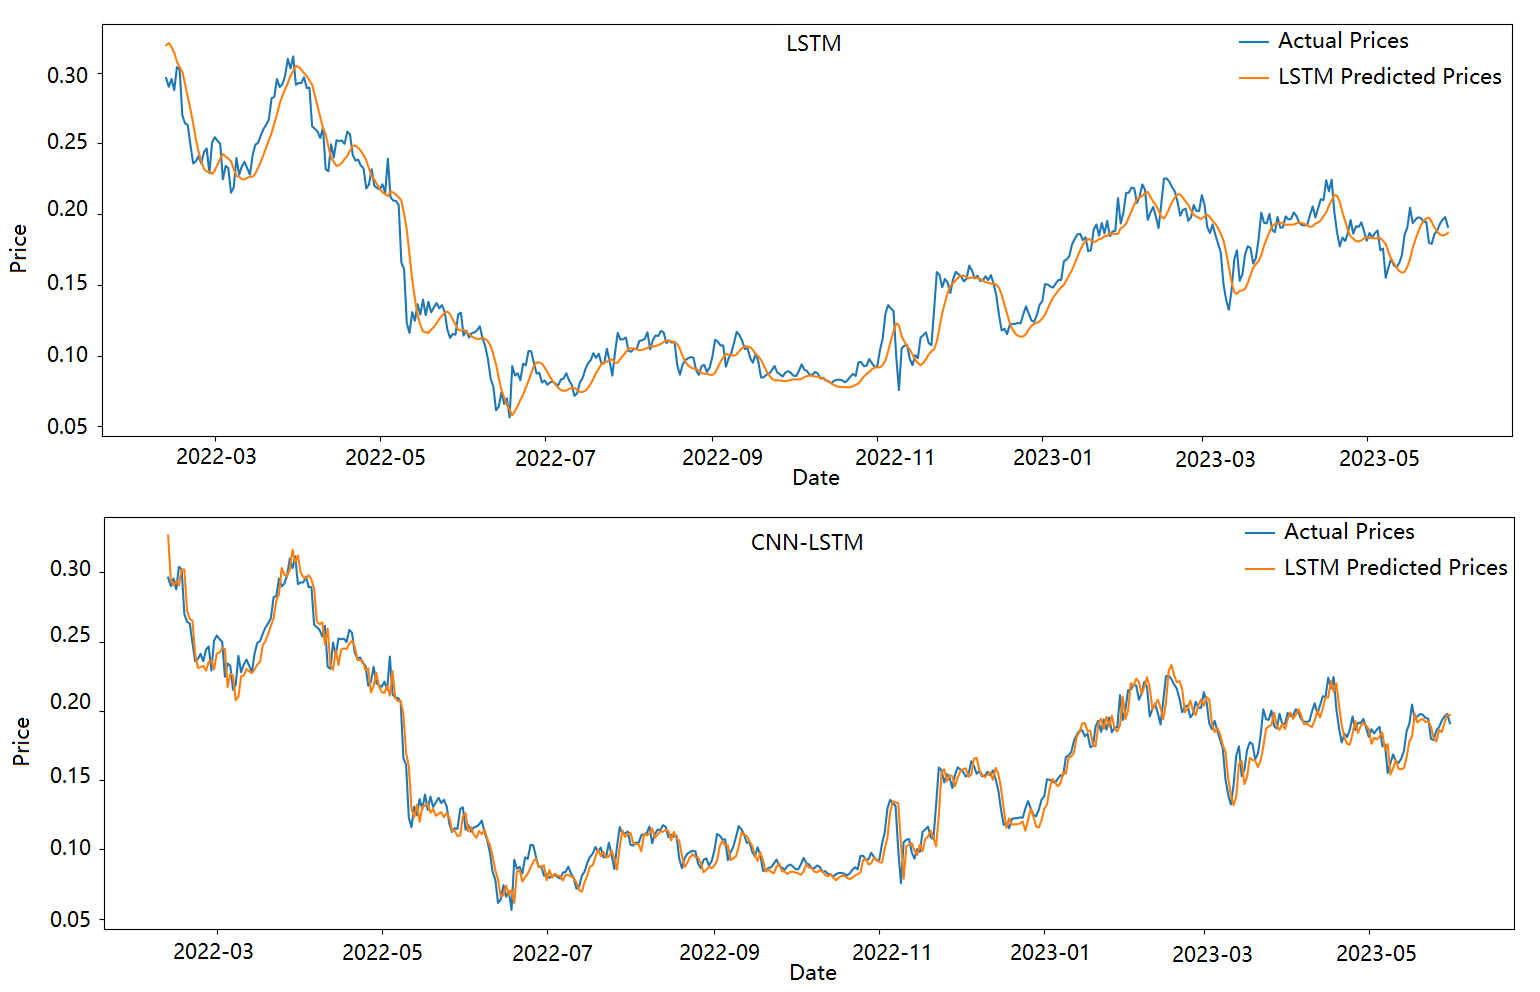
Figure 4. Actual Price and Predicted Price of LSTM and CNN-LSTM models of Litecoin (LTC) on 11 February 2022 to 31 May 2023 (Figure credit: Original).
3.3. Performance on Litecoin (ETH)
The experimental results of five models on the ETH dataset are demonstrated in Figure 5
The predictions of the five models for ETH display similar patterns to the observations discussed earlier. By examining the performance of the models across multiple datasets, a broader perspective is achieved and can assess their general predictive capabilities. As a result, it could show that the stronger predictive capabilities across the three datasets was demonstrated in CNN-LSTM model. Its ability to capture nuanced patterns and provide accurate predictions makes it a favorable choice for cryptocurrency price forecasting tasks.
It is evident from the analysis in Figure 6 that the CNN-LSTM model is in position to reflect price trends in a more detailed manner compared to LSTM. The CNN-LSTM model exhibits a higher level of granularity in its predictions, providing more nuanced insights into the price movement patterns. However, it is important to note that the predicted prices from both models tend to lag behind the actual prices, where LSTM model is more lagging, indicating a potential deviation from accuracy.
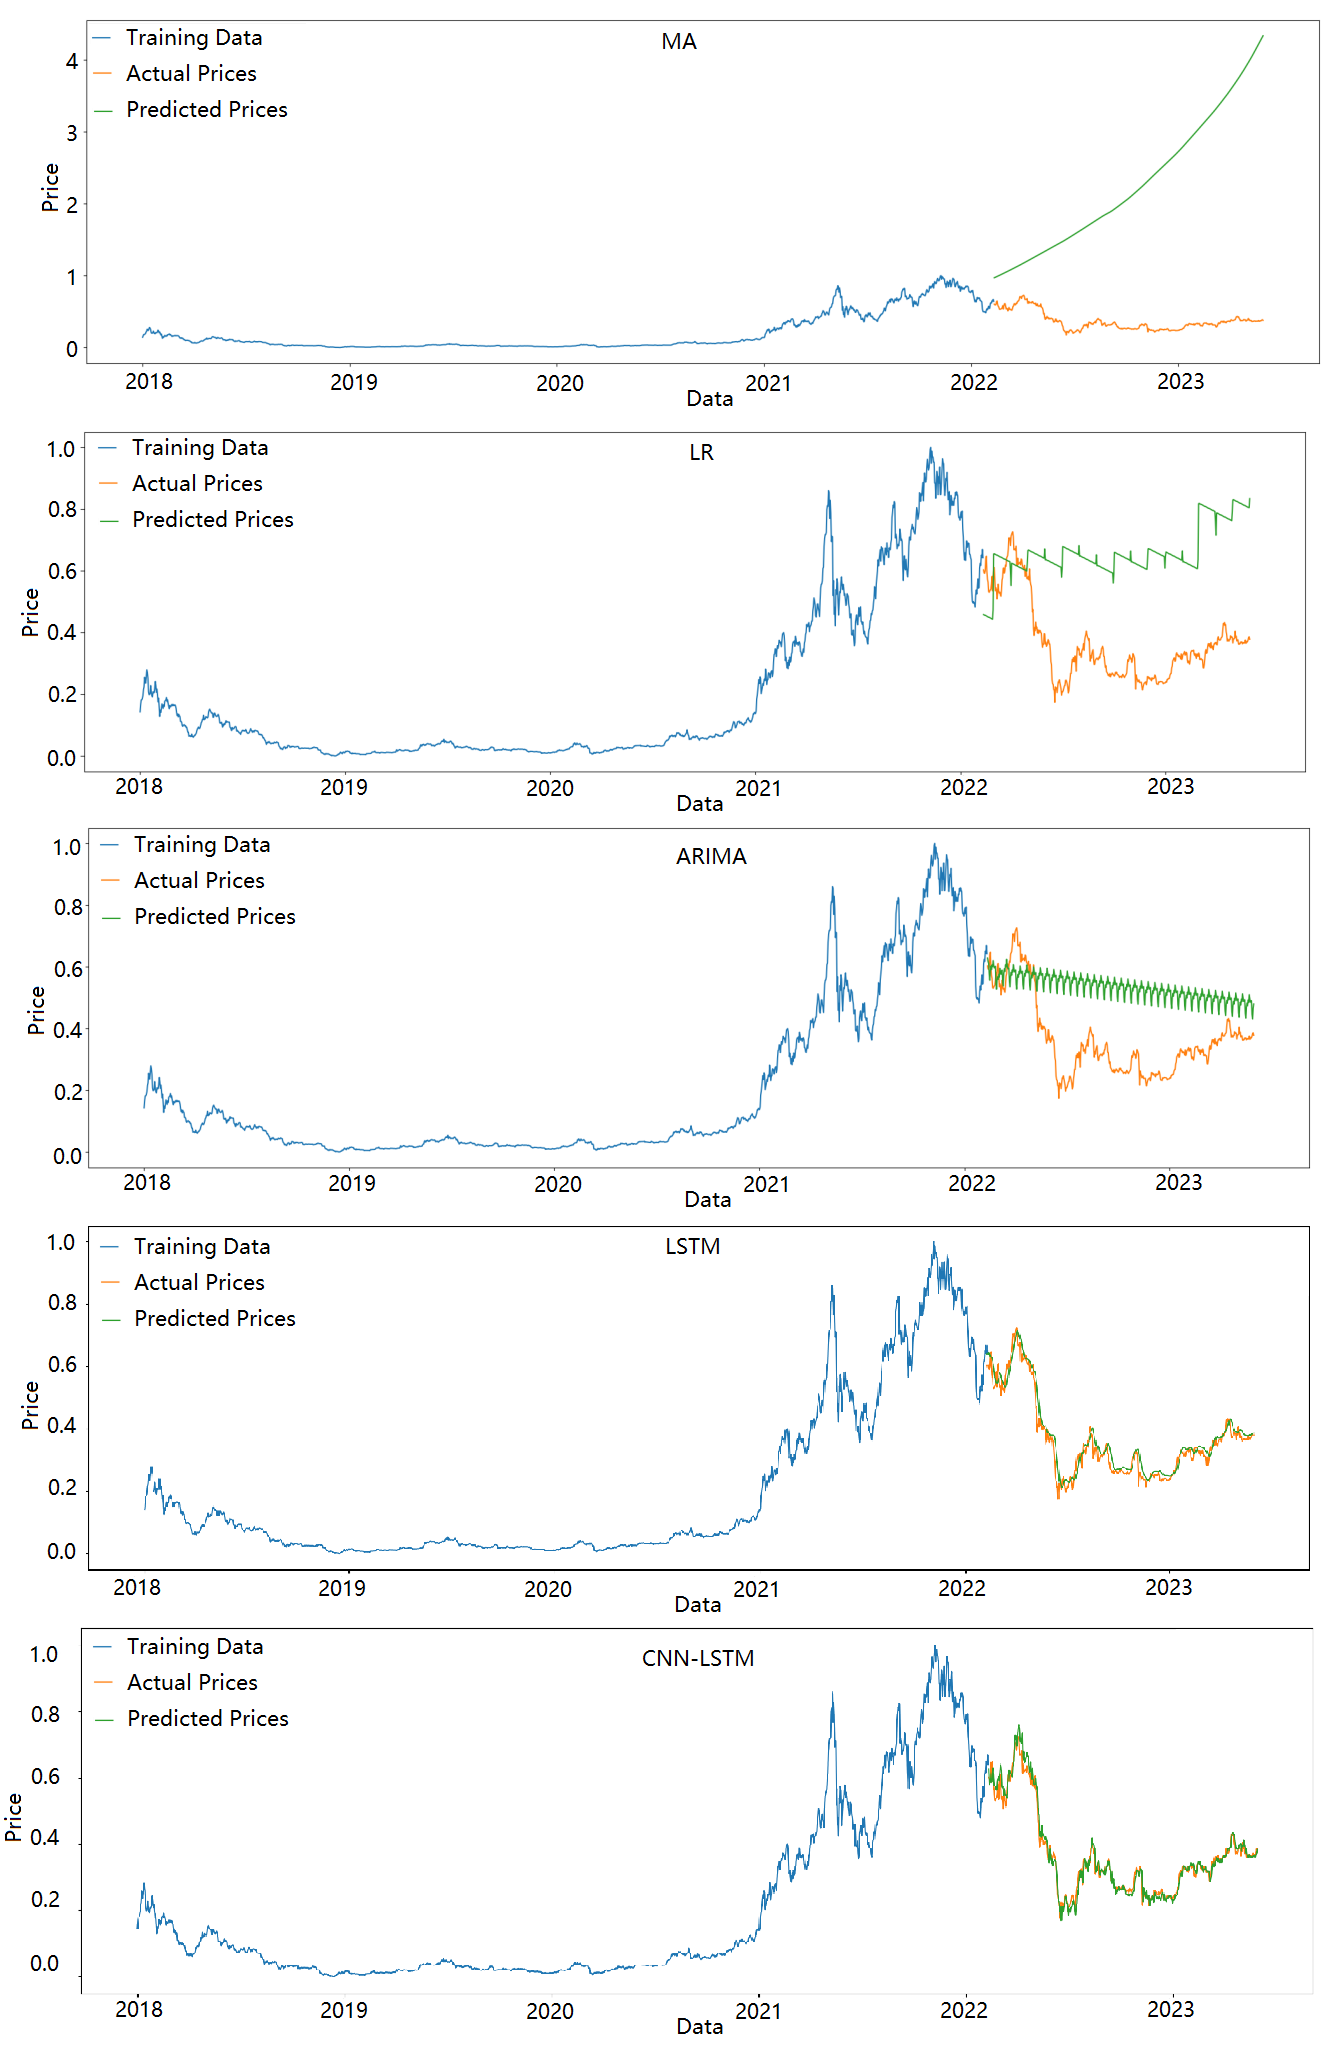
Figure 5. Prediction visualization on ETH data (Figure credit: Original).
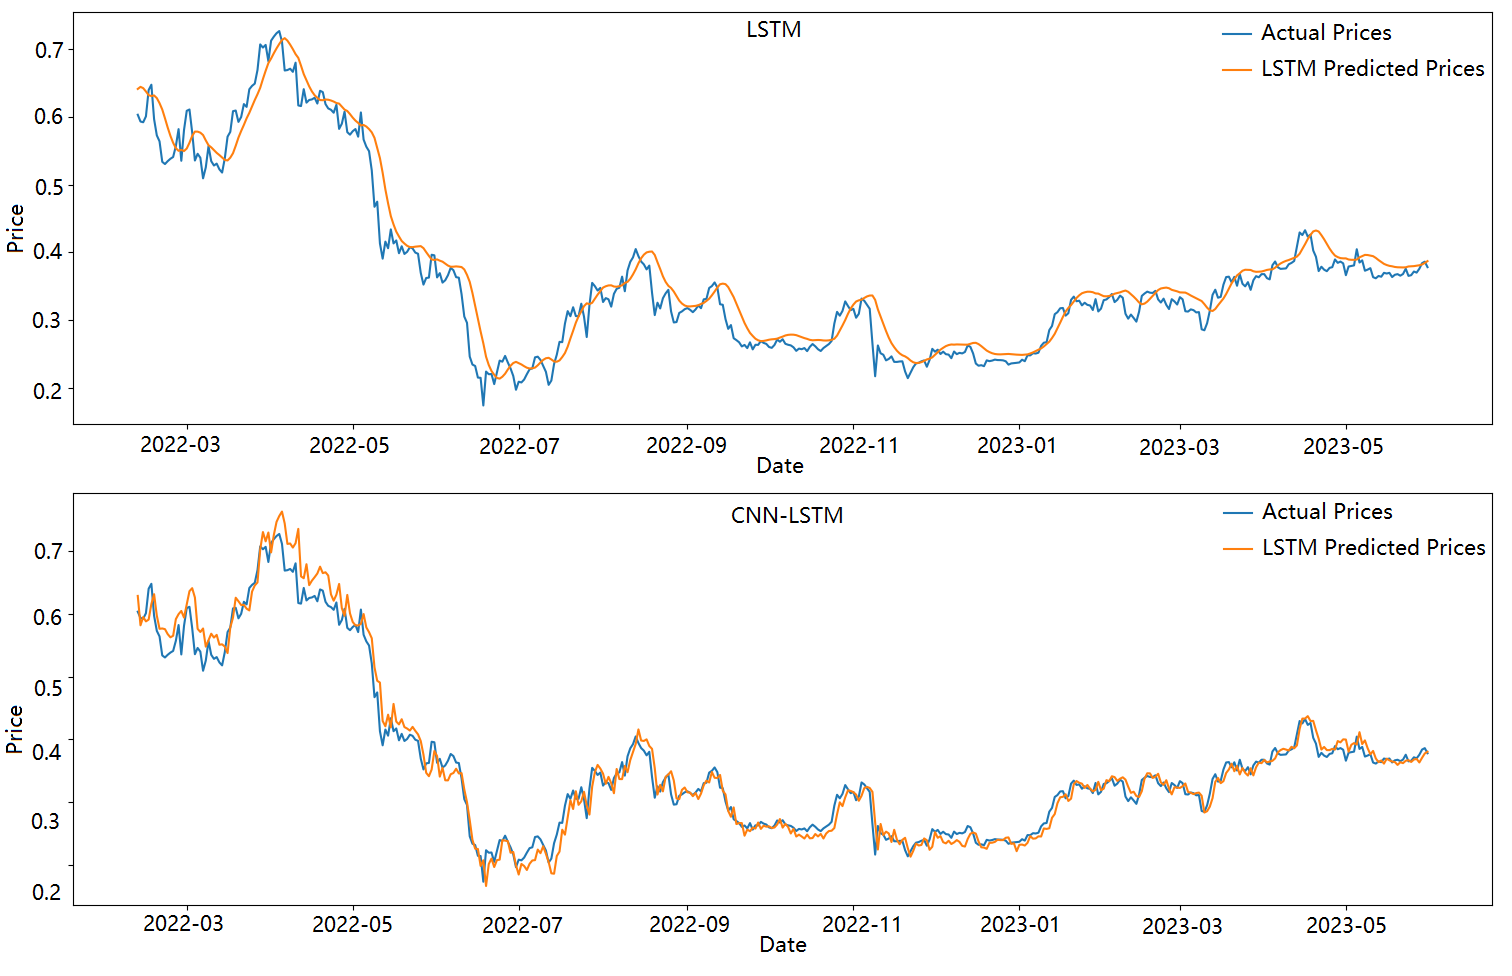
Figure 6. Actual Price and Predicted Price of LSTM and CNN-LSTM models of Ethereum (ETH) on 11 February 2022 to 31 May 2023 (Figure credit: Original)
3.4. Quantitative evaluation
By demonstrating the RMSE, RAME and MAPE values in Table 1, this work can better assess the performance of each model and compare their strengths and weaknesses.
Table 1. Comparative analysis of predictive models on cryptocurrency datasets.
Dataset | Model | RMSE | RAME | MAPE |
BTC | MA | 2.376 | 1.462 | 705.95% |
Linear Regression | 0.478 | 0.671 | 152.53% | |
ARIMA | 0.675 | 0.779 | 210.76% | |
LSTM | 0.028 | 0.147 | 6.198% | |
CNNLSTM | 0.020 | 0.125 | 4.664% | |
LTC | MA | 1.593 | 1.210 | 1041.965% |
Linear Regression | 0.299 | 0.537 | 218.125% | |
ARIMA | 0.215 | 0.103 | 98.404% | |
LSTM | 0.014 | 0.092 | 7.976% | |
CNNLSTM | 0.011 | 0.086 | 5.004% | |
ETH | MA | 2.148 | 1.381 | 603.958% |
Linear Regression | 0.336 | 0.557 | 102.086% | |
ARIMA | 0.203 | 0.426 | 62.145% | |
LSTM | 0.030 | 0.148 | 6.425% | |
CNNLSTM | 0.021 | 0.124 | 4.230% |
After applying different models to three kinds of cryptocurrency, Table 1 specify their corresponding performance. Among the models compared, CNN-LSTM stands out as the best performer in terms of three metrics, exhibiting the minimum RMSE (<0.021), RAME (<0.125), and MAPE values (<10%). It effectively captures the price trends in the BTC dataset.
The LSTM and CNNLSTM models consistently outperform the other models across all three datasets in terms of RMSE, RAME, and MAPE, indicating their superior predictive performance. The LSTM model demonstrated the low RMSE values for BTC (0.028), LTC (0.014), and ETH (0.030), indicating its superior predictive accuracy. And the CNN-LSTM model demonstrated significant optimization over the LSTM model, resulting in a notable decrease in RMSE by 28.6% for BTC, 21.4% for LTC, and 30% for ETH, respectively.
The MA model generally exhibits the highest errors and the highest MAPE values, suggesting it may not capture the underlying patterns and dynamics effectively. ARIMA also performs well, demonstrating competitive results with significantly lower errors compared to the MA and Linear Regression models.
4. Conclusion
The analysis of the MA, LR, and ARIMA models' predictions reveals limitations in capturing the actual changes and trends in the data. The MA model exhibits a general upward trend in its predictions; however, the predicted values deviate significantly from the actual values. It tends to overestimate the actual values, and it performs poorly in capturing the peaks and fluctuations in the data. The LR model provides a relatively close approximation to the overall trend in the predictions. However, the LR model yields high values in model evaluation metrics, indicating poor performance in terms of accuracy. The ARIMA model shows relatively poor performance in capturing the overall trend of the actual data. Nevertheless, it performs relatively well in terms of evaluation metrics.
Considering the unique attributes of cryptocurrencies, approaches such as deep learning architectures like LSTM and CNN-LSTM, have shown promise in capturing and predicting the intricate dynamics of cryptocurrency prices. These models are capable of capturing non-linear relationships, long-term dependencies, and complex patterns, which can be particularly advantageous in the context of cryptocurrencies. However, it is worth noting that this work has observed consistent trends in the prices of the three cryptocurrencies during the same time period. This suggests the possibility of some degree of consistency in the results across the datasets. Further research is required to investigate the correlation among these cryptocurrencies and explore if there are underlying factors that contribute to the observed similarities. It is important to conduct more extensive studies to gain a deeper understanding of their predictive behaviors.
References
[1]. Hameed, S., & Farooq, S. (2017). The art of crypto currencies: A comprehensive analysis of popular crypto currencies. arXiv preprint arXiv:1711.11073.
[2]. Rebane, J., Karlsson, I., Papapetrou, P., & Denic, S. (2018). Seq2Seq RNNs and ARIMA models for cryptocurrency prediction: A comparative study. In SIGKDD Fintech’18, 19-23, 2018.
[3]. Dyhrberg, A. H. (2016). Bitcoin, gold and the dollar–A GARCH volatility analysis. Finance Research Letters, 16, 85-92.
[4]. Vidal, A., & Kristjanpoller, W. (2020). Gold volatility prediction using a CNN-LSTM approach. Expert Systems with Applications, 157, 113481.
[5]. Livieris, I. E., Pintelas, E., & Pintelas, P. (2020). A CNN–LSTM model for gold price time-series forecasting. Neural computing and applications, 32, 17351-17360.
[6]. Naved, M., & Srivastava, P. (2015). The profitability of five popular variations of moving averages on Indian market Index S&P CNX Nifty 50 during January 2004-December 2014. SSRN. 1-6.
[7]. Lee, S. (2004). Application of likelihood ratio and logistic regression models to landslide susceptibility mapping using GIS. Environmental Management, 34, 223-232.
[8]. Dutta, A., Bandopadhyay, G., & Sengupta, S. (2012). Prediction of stock performance in the Indian stock market using logistic regression. International Journal of Business and Information, 7(1), 105.
[9]. Ghaderpour, E., Pagiatakis, S. D., & Hassan, Q. K. (2021). A survey on change detection and time series analysis with applications. Applied Sciences, 11(13), 6141.
[10]. Thakkar, A., & Chaudhari, K. (2021). A comprehensive survey on deep neural networks for stock market: The need, challenges, and future directions. Expert Systems with Applications, 177, 114800.
Cite this article
Yu,S. (2024). Comparative analysis of machine learning techniques for cryptocurrency price prediction. Applied and Computational Engineering,32,1-12.
Data availability
The datasets used and/or analyzed during the current study will be available from the authors upon reasonable request.
Disclaimer/Publisher's Note
The statements, opinions and data contained in all publications are solely those of the individual author(s) and contributor(s) and not of EWA Publishing and/or the editor(s). EWA Publishing and/or the editor(s) disclaim responsibility for any injury to people or property resulting from any ideas, methods, instructions or products referred to in the content.
About volume
Volume title: Proceedings of the 2023 International Conference on Machine Learning and Automation
© 2024 by the author(s). Licensee EWA Publishing, Oxford, UK. This article is an open access article distributed under the terms and
conditions of the Creative Commons Attribution (CC BY) license. Authors who
publish this series agree to the following terms:
1. Authors retain copyright and grant the series right of first publication with the work simultaneously licensed under a Creative Commons
Attribution License that allows others to share the work with an acknowledgment of the work's authorship and initial publication in this
series.
2. Authors are able to enter into separate, additional contractual arrangements for the non-exclusive distribution of the series's published
version of the work (e.g., post it to an institutional repository or publish it in a book), with an acknowledgment of its initial
publication in this series.
3. Authors are permitted and encouraged to post their work online (e.g., in institutional repositories or on their website) prior to and
during the submission process, as it can lead to productive exchanges, as well as earlier and greater citation of published work (See
Open access policy for details).
References
[1]. Hameed, S., & Farooq, S. (2017). The art of crypto currencies: A comprehensive analysis of popular crypto currencies. arXiv preprint arXiv:1711.11073.
[2]. Rebane, J., Karlsson, I., Papapetrou, P., & Denic, S. (2018). Seq2Seq RNNs and ARIMA models for cryptocurrency prediction: A comparative study. In SIGKDD Fintech’18, 19-23, 2018.
[3]. Dyhrberg, A. H. (2016). Bitcoin, gold and the dollar–A GARCH volatility analysis. Finance Research Letters, 16, 85-92.
[4]. Vidal, A., & Kristjanpoller, W. (2020). Gold volatility prediction using a CNN-LSTM approach. Expert Systems with Applications, 157, 113481.
[5]. Livieris, I. E., Pintelas, E., & Pintelas, P. (2020). A CNN–LSTM model for gold price time-series forecasting. Neural computing and applications, 32, 17351-17360.
[6]. Naved, M., & Srivastava, P. (2015). The profitability of five popular variations of moving averages on Indian market Index S&P CNX Nifty 50 during January 2004-December 2014. SSRN. 1-6.
[7]. Lee, S. (2004). Application of likelihood ratio and logistic regression models to landslide susceptibility mapping using GIS. Environmental Management, 34, 223-232.
[8]. Dutta, A., Bandopadhyay, G., & Sengupta, S. (2012). Prediction of stock performance in the Indian stock market using logistic regression. International Journal of Business and Information, 7(1), 105.
[9]. Ghaderpour, E., Pagiatakis, S. D., & Hassan, Q. K. (2021). A survey on change detection and time series analysis with applications. Applied Sciences, 11(13), 6141.
[10]. Thakkar, A., & Chaudhari, K. (2021). A comprehensive survey on deep neural networks for stock market: The need, challenges, and future directions. Expert Systems with Applications, 177, 114800.