


1. Introduction
Since the emergence of the novel coronavirus (SARS-CoV-2) at the end of 2019, global public health systems have faced unprecedented challenges. The United States is no exception, experiencing varying degrees of difficulty in both controlling the outbreak and allocating medical resources across different regions. As one of the largest cities in the United States, New York City has been a particularly hard-hit area, owing to its complex demographic makeup and high volume of human traffic. Yet, the city's administrative districts have exhibited varying performance during the pandemic. This inconsistency raises questions about how geographical factors, healthcare resources, and socio-economic conditions influence the rate of COVID-19 cases, hospitalizations, and deaths. Comprised of five boroughs—Manhattan, Brooklyn, Queens, the Bronx, and Staten Island—New York City presents significant disparities in terms of population density, healthcare infrastructure, and socio-economic indicators. Understanding these disparities can not only facilitate more effective allocation of medical resources but also inform targeted public health policies.
The topic of regional heterogeneity in healthcare capabilities has been extensively discussed in academia. First, Raghupathi point edout in their paper that healthcare spending has a positive correlation with income, GDP, and labor productivity [1]. Song et al. analyzed two-level healthcare resources across 31 provinces in China and found significant spatial disparities, with different factors affecting healthcare resources at different levels [2]. There are opposing views as well, such as those of Halkos and Tzeremes, who suggest that an increase in GDP per capita (GDPc) can negatively affect the efficiency of healthcare services in a region, implying that economic growth does not guarantee improved healthcare services [3].
In studies concerning public health conditions, population density, economic levels, and the spread of epidemics, Singh et al. found that the speed of infectious disease transmission increases with increasing carrier population density. The research also points out that diseases are more likely to become endemic due to the impact of immigration [4]. Poverty leads to a lack of public health infrastructure, and inadequate public health infrastructure could cause an increase in the incidence of infectious diseases in border areas (Laskowski et al., 2011) [5]. Sun et al. also emphasized that the economic level could impact the mortality rate of infectious diseases [6]. Bonds et al. shown that the integration of economic and epidemiological models can naturally form poverty traps, where initial economic and epidemiological conditions determine a society's long-term health and economic development trajectory [7]. A study specific to China provided new data on the spatial spread of epidemics in relation to economic growth, offering valuable insights for epidemic control strategies and development plans [8]. Research at the county level in the United States by Wong et al. shown that regional economic conditions are effective predictors of cumulative infection cases [9]. Earlier research by Doyle et al. indicated that inadequate public health infrastructure could lead to an increase in the incidence of infectious diseases in border areas [10].
However, overall, there are relatively few research papers specifically on how "economic conditions and locational factors affect COVID-19 hospitalization and mortality rates," perhaps because the topic has not yet received widespread research attention.
This study aims to investigate the relationship between hospitalization and mortality across different administrative districts in New York City during the COVID-19 pandemic. By utilizing data provided by the New York City Department of Public Health, we intend to assess the healthcare stress experienced by each district and identify potential key factors affecting hospitalization and mortality rates. These findings will serve as vital reference points for public health policymakers, aiding in the formulation of more informed decisions for future pandemics or other public health crises.
2. Theoretical Assumptions
In the field of public health research, the mortality rate among hospitalized patients has always been a focal point, especially in the context of large-scale public health events like the COVID-19 pandemic. However, the mortality rate is not explained by a single variable but is influenced by multiple factors. Among these, the level of economic development and healthcare conditions are two significant yet often overlooked factors. Thus, this paper proposes the following theoretical assumption: Different levels of economic development and healthcare conditions will significantly impact the mortality rate among hospitalized patients.
Firstly, the level of economic development is related to the mortality rate among hospitalized patients in multiple dimensions. More developed economies typically have more robust healthcare resources, including but not limited to medical facilities, specialized medical staff, and advanced medical technologies. These factors work in tandem to increase the likelihood of patient recovery, thereby reducing the mortality rate among hospitalized patients. Additionally, economically developed areas often have more comprehensive social security systems, including medical insurance and emergency rescue mechanisms, which may also decrease the risk of death among hospitalized patients.
Secondly, healthcare conditions encompass not just hardware facilities like hospitals and medical equipment but also software aspects like healthcare management systems and the professional expertise of medical staff. Superior healthcare conditions usually imply faster disease diagnoses, more accurate treatment plans, and more effective recovery measures. These factors, too, will have a positive impact on the mortality rate among hospitalized patients.
It is worth noting, however, that economic development and healthcare conditions do not exist in isolation; they influence and constrain each other. For example, in a region with underdeveloped economics but a relatively well-established healthcare system, the mortality rate among hospitalized patients might not be excessively high. Conversely, even in economically developed regions, if the healthcare system has significant flaws or poor management, the mortality rate among hospitalized patients may not significantly decrease.
In summary, the core theoretical assumption of this paper is that the levels of economic development and healthcare conditions in different regions will significantly influence the mortality rate among hospitalized patients. This assumption not only helps us understand more comprehensively the factors affecting the mortality rate but also provides policymakers with more accurate reference points, enabling more effective risk reduction strategies for hospitalized patients.
3. Research Design
3.1. Data Source
The dataset used in this study comes from the New York City Department of Public Health, an authoritative and reliable source of information. This dataset encompasses nearly two years, from March 2020 to January 2022, and includes COVID-19 related data for the five main administrative districts of New York City-Manhattan, Brooklyn, Queens, the Bronx, and Staten Island. Specifically, the dataset includes daily counts of new COVID-19 cases, hospitalizations, and deaths. There are two primary reasons for selecting this dataset: First, New York City is one of the largest cities in the United States, with a high degree of diversity and complexity. As such, its data can offer us a wealth of information and research perspectives. Second, the extended timeframe of the dataset-nearly two years-allows us to observe and analyze how hospitalizations and deaths have varied across different stages of the pandemic in each administrative district. The dataset is publicly available and has undergone rigorous quality control to ensure the accuracy and consistency of the data.
By leveraging this dataset, we can more accurately assess the healthcare needs in different areas of New York City under the COVID-19 pandemic, as well as how to allocate resources and formulate policies more effectively. These data will serve as the foundation for our model building and subsequent analysis.
3.2. Variable Selection
The number of deaths is chosen as the dependent variable to measure the severity of the pandemic. The unit for this variable is the number of deaths, and the data is sourced directly from official statistics provided by the New York City Department of Public Health. Hospitalizations serve as the independent variable to explore whether there is a clear relationship with the number of deaths. The unit is likewise the number of hospitalizations. Given that New York City is composed of multiple administrative districts, each with its own unique demographics, geography, and healthcare resources, the administrative district is included as a categorical variable for control. As the pandemic is a dynamic process, the date is added as another control variable to examine the potential impact of time on the number of hospitalizations and deaths.
The choice of these variables aims to construct a more comprehensive and accurate model to address the core questions this study seeks to explore. Together, these four variables form the foundation for our subsequent data analysis and model building (Table 1).
Table 1: Variable Type Symbols and Units.
Variable type | Variable | Variable Symbol |
Dependent variable | Number of deaths | DTH |
Argument | Number of hospitalizations | HOS |
Control variable | Administrative district | BOR |
Control variable | Date | DAT |
3.3. Data Processing and Cleaning
To more accurately analyze the relationship between hospitalizations and deaths in different administrative districts of New York City during the COVID-19 pandemic, we first need to process and clean the raw data. The original data is not in panel format, so a series of transformations and integrations are needed.
Panel Data Construction: We organize the raw data into panel data for further statistical analysis. This step includes matching the number of hospitalizations and deaths for each administrative district and corresponding date to create a long-format panel dataset.
District Coding: For ease of subsequent data processing and analysis, codes are assigned to each administrative district as follows: Brooklyn (BK): 1, Bronx (BX): 2, Manhattan (MN): 3, Queens (QN): 4, Staten Island (SI): 5
Handling Missing and Outlying Values: During the construction of the panel data, we also check for missing and outlying values. Given that the data source is the New York City Department of Public Health, the data's completeness and accuracy are relatively high; therefore, there are fewer missing and outlying values. For the few that do occur, we perform appropriate imputation or removal.
3.4. Model Construction
After completing the data processing and cleaning, we proceed to model construction. Given that the study primarily focuses on the relationship between hospitalizations and deaths in different administrative districts of New York City during the COVID-19 pandemic, we chose the Fixed Effects Model as the primary analytical tool.
The Fixed Effects Model allows people to more accurately capture the differences in hospitalizations and death counts among various administrative districts. This model enables people to control for unobserved factors that remain constant over time but vary across different districts. The equation for the model is as follows:
\( DT{H_{it}}=α+{β_{1}}HO{S_{it}}+{β_{2}}BO{R_{i}}+{β_{3}}DA{T_{t}}+{H_{it}} \) (1)
\( DT{H_{it}} \) is the number of deaths in region i at time t. \( HO{S_{it}} \) is the number of inpatients in region i at time t. \( BO{R_{i}} \) is the number of inpatients in region i at time t. \( DA{T_{t}} \) is the date. \( {H_{it}} \) is the error term. Through this model, a more accurate understanding of how the number of hospitalizations in different areas influences the number of deaths is obtained. This serves as a powerful tool for subsequent analysis and policy recommendations.
4. Results and Discussion
4.1. Descriptive Statistics
Prior to delving into a more detailed data analysis, descriptive statistics were conducted on the dataset to understand its basic characteristics. Table 1 presents the descriptive statistics for the two key variables: number of hospitalizations (HOS) and number of deaths (DTH).
Number of Hospitalizations (HOS): This variable has a total of 5,790 observations with an average of 33.281 and a standard deviation of 56.48429. This indicates significant fluctuations in the number of hospitalizations across different administrative regions and time points. The minimum value for this variable is 0, while the maximum value reaches up to 609.
Number of Deaths (DTH): It has an average of 6.696891 and a standard deviation of 17.18945, implying considerable variation in the number of deaths across different regions and times. The minimum and maximum values for this variable are 0 and 202, respectively.
These preliminary descriptive statistics provide foundational information for the subsequent model construction and analysis. In particular, the size of the standard deviation points out that both variables exhibit a certain level of fluctuation, which is an aspect that needs special attention in the subsequent analysis (Table 2 and Figure 1).
Table 2: Descriptive Statistical Results.
Variable | Obs | Mean | Std. dev. | Min | Max |
HOS | 5,790 | 33.281 | 56.48429 | 0 | 609 |
DTH | 5,790 | 6.696891 | 17.18945 | 0 | 202 |
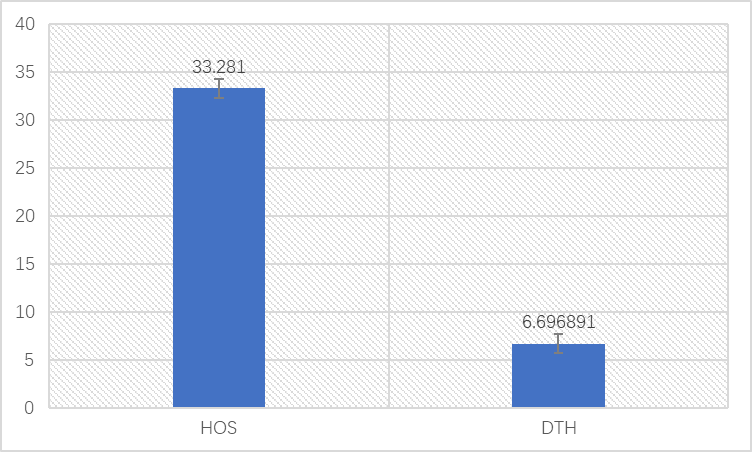
Figure 1: Descriptive statistical results of deaths and hospitalizations.
In the initial part of the descriptive statistical analysis, an overview of the overall number of hospitalizations (HOS) and deaths (DTH) was provided. Subsequently, a more detailed exploration was conducted to investigate the variations in these two variables across different regions.
Firstly, Brooklyn (Region Code 1) and Queens (Region Code 4) exhibit similar high levels in both hospitalizations and death cases. Especially in terms of the number of hospitalizations, both regions have relatively high averages and standard deviations, suggesting that these two areas faced greater healthcare pressure during the pandemic.
Secondly, the Bronx (Region Code 2) and Manhattan (Region Code 3) are relatively moderate, particularly in terms of the number of death cases. Both the average and standard deviation for these two regions are significantly lower than those for Brooklyn and Queens. This may imply that these two areas have more effective measures in terms of pandemic management or healthcare resource allocation.
Lastly, Staten Island (Region Code 5) shows the lowest number of hospitalizations and deaths among these five regions. Despite having the same sample size as other regions, its average and standard deviation are significantly lower, which may be due to its relatively lower population density or more abundant healthcare resources.
In summary, there are noticeable differences in the number of hospitalizations and death cases among different administrative regions. These variations may be associated with factors such as population density, healthcare resources, and pandemic control measures in each area. This provides a strong direction for subsequent analyses and warrants further exploration (Table 3 and Figure 2).
Table 3: Descriptive Statistical Results for Different Regions.
Area | Variable | Obs | Mean | Std. dev. | Min | Max |
1 | HOS | 1,158 | 49.77979 | 70.58625 | 0 | 555 |
DTH | 1,158 | 10.45509 | 22.94296 | 0 | 201 | |
2 | HOS | 1,158 | 35.30743 | 55.43991 | 0 | 390 |
DTH | 1,158 | 6.295337 | 15.56721 | 0 | 132 | |
3 | HOS | 1,158 | 24.9905 | 35.04925 | 0 | 272 |
DTH | 1,158 | 4.586356 | 9.694507 | 0 | 92 | |
4 | HOS | 1,158 | 46.17789 | 74.16113 | 0 | 609 |
DTH | 1,158 | 10.02159 | 23.47507 | 0 | 202 | |
5 | HOS | 1,158 | 10.1494 | 11.4772 | 0 | 83 |
DTH | 1,158 | 2.126079 | 3.727957 | 0 | 34 |
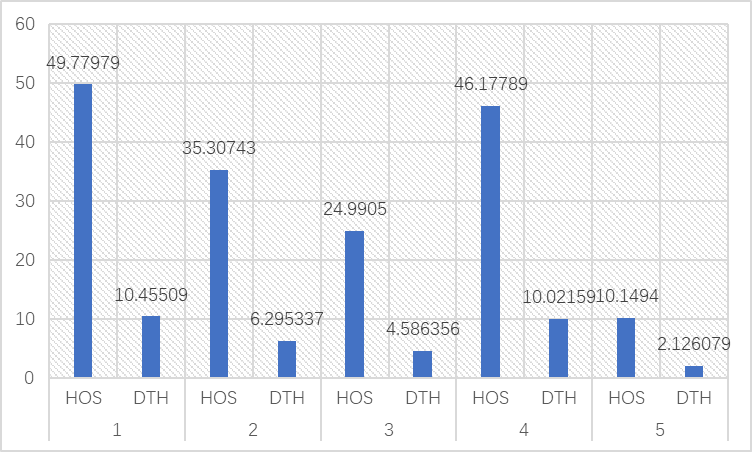
Figure 2: Descriptive statistical results of deaths and hospitalizations in different regions.
4.2. Hypothesis Testing
In the empirical analysis, two differently configured regression models were employed to examine the impact of the number of hospitalizations (HOS) on the number of deaths (DTH). Model (1) includes only the number of hospitalizations as an explanatory variable, while Model (2) additionally incorporates area and time as control variables (Table 4).
Firstly, in both models, the number of hospitalizations (HOS) shows a significant positive relationship with the number of deaths (DTH). This result is robustly confirmed in both Model (1) and Model (2). This indicates that the number of hospitalizations is an important predictive variable that significantly affects the number of deaths, both before and after controlling for other factors.
Secondly, in Model (2), Used Queens as the reference group to examine the impact of other administrative areas on the number of deaths. Compared to Queens, the number of deaths in the Bronx is significantly lower, while Manhattan shows a moderate decrease. However, there are no statistically significant differences for Brooklyn and Staten Island. This may suggest that aside from Queens, there is some degree of imbalance in pandemic management and resource allocation in other administrative areas.
Lastly, the R² value in Model (2) reached 0.892, significantly higher than the 0.592 in Model (1). This indicates that the explanatory power of the model is significantly enhanced after including area and time as control variables.
Overall, these results not only confirm the significance of the number of hospitalizations as an important influencing factor but also reveal possible disparities in pandemic response across different administrative areas. This provides a strong basis for subsequent policy discussions.
Table 4: Regression Analysis Results.
| (1) | (2) |
| DTH | DTH |
HOS | .234*** | .23*** |
| (.003) | (.003) |
BK_dummy | - | -.395 |
| - | (.262) |
BX_dummy | - | -1.225*** |
| - | (.265) |
MN_dummy | - | -.56** |
| - | (.271) |
SI_dummy | - | .394 |
| - | (.288) |
cons | -1.096*** | .311 |
| (.167) | (2.826) |
Observations | 5790 | 5790 |
R-squared | .592 | .892 |
Standard errors are in parentheses
*** p<.01, ** p<.05, * p<.1
5. Conclusion
The aim of this study is to delve into the relationship between hospitalizations and deaths in different administrative districts of New York City during the COVID-19 pandemic, and further analyze how the level of economic development and medical conditions affect this relationship. Through two differently configured regression models, have arrived at a series of robust empirical results. These not only confirm the significance of the number of hospitalizations (HOS) as an important influencing factor but also reveal potential disparities in pandemic response across different administrative areas.
Firstly, the number of hospitalizations is significantly positively correlated with the number of deaths in both Model (1) and Model (2). This result is robustly verified in both models, and the explanatory power of Model (2) far exceeds that of Model (1). This outcome supports our main theoretical hypothesis that the number of hospitalizations is an important factor affecting the number of deaths.
Secondly, Model (2) further reveals the impact of different administrative districts on the number of deaths. Taking Queens as the reference group, the number of deaths in the Bronx and Manhattan are statistically significantly lower than in Queens, whereas Brooklyn and Staten Island do not show significant differences when compared to Queens. This could be due to differing levels of economic development and medical conditions in these districts. For example, the Bronx and Manhattan may have medical or socio-economic conditions superior to those in Queens, leading to lower death numbers.
These findings are also consistent with our theoretical hypothesis that the level of economic development and medical conditions would affect the death rate among hospitalized patients. The Bronx and Manhattan may display lower death numbers due to more advantageous economic or medical conditions, while Brooklyn and Staten Island may not show significant differences because they are similar to Queens in these respects.
Overall, these empirical results not only confirm that the number of hospitalizations is an important factor affecting the number of deaths but also reveal potential disparities in this relationship among different administrative districts. These disparities are likely related to the levels of economic development and medical conditions in each district. For policymakers, this provides a more precise and targeted reference for pandemic response. Particularly in resource-limited settings, understanding these disparities will help policymakers allocate resources more effectively, thereby effectively reducing the risk of death among hospitalized patients.
References
[1]. Raghupathi and Raghupathi. (2020) investigated how education influences health across OECD countries between 1995-2015. Archives of Public Health, 78, 1.
[2]. Song, et al. (2019) Studied the distribution and impact of China's two-tier public healthcare resources and their spillover effects. Int. J. Environ. Res. Public Health, 16, 4.
[3]. Halkos and Tzeremes. (2011) conducted a nonparametric analysis on the efficiency of Greek regional public healthcare. Health Policy, 103.
[4]. Singh, E., et al. (2003) developed a model to understand the spread of infections dependent on carriers and environmental factors. Journal of Biological Systems, 11.
[5]. Laskowski, et al. (2011) analyzed how demographic factors influenced influenza spread in remote areas. Scientific Reports, 1.
[6]. Sun, et al. (2021) explored the relationship between economic changes and infectious disease mortality. Frontiers in Public Health, 9.
[7]. Bonds, et al. (2010) discussed the link between poverty and the ecology of infectious diseases. Proc. Royal Soc. B: Biological Sciences, 277, 1685.
[8]. Mo, et al. (2021) examined how economic growth levels correlated with the COVID-19 spread across Chinese provinces. J. Epidemiol Community Health, 75, 9.
[9]. Wong, L. (2020) Emphasized the role of population density in the spread of COVID-19. Plos One, 15, 12.
[10]. Doyle, B. (2000) Highlighted infectious disease rates in the US region adjacent to Mexico between 1990-1998. J. Infectious Diseases, 182.
Cite this article
Pan,Z. (2024). Empirical Analysis of the Relationship Between Hospitalization and Mortality in Different Administrative Districts of New York City During the COVID-19 Pandemic. Advances in Economics, Management and Political Sciences,73,150-157.
Data availability
The datasets used and/or analyzed during the current study will be available from the authors upon reasonable request.
Disclaimer/Publisher's Note
The statements, opinions and data contained in all publications are solely those of the individual author(s) and contributor(s) and not of EWA Publishing and/or the editor(s). EWA Publishing and/or the editor(s) disclaim responsibility for any injury to people or property resulting from any ideas, methods, instructions or products referred to in the content.
About volume
Volume title: Proceedings of the 2nd International Conference on Financial Technology and Business Analysis
© 2024 by the author(s). Licensee EWA Publishing, Oxford, UK. This article is an open access article distributed under the terms and
conditions of the Creative Commons Attribution (CC BY) license. Authors who
publish this series agree to the following terms:
1. Authors retain copyright and grant the series right of first publication with the work simultaneously licensed under a Creative Commons
Attribution License that allows others to share the work with an acknowledgment of the work's authorship and initial publication in this
series.
2. Authors are able to enter into separate, additional contractual arrangements for the non-exclusive distribution of the series's published
version of the work (e.g., post it to an institutional repository or publish it in a book), with an acknowledgment of its initial
publication in this series.
3. Authors are permitted and encouraged to post their work online (e.g., in institutional repositories or on their website) prior to and
during the submission process, as it can lead to productive exchanges, as well as earlier and greater citation of published work (See
Open access policy for details).
References
[1]. Raghupathi and Raghupathi. (2020) investigated how education influences health across OECD countries between 1995-2015. Archives of Public Health, 78, 1.
[2]. Song, et al. (2019) Studied the distribution and impact of China's two-tier public healthcare resources and their spillover effects. Int. J. Environ. Res. Public Health, 16, 4.
[3]. Halkos and Tzeremes. (2011) conducted a nonparametric analysis on the efficiency of Greek regional public healthcare. Health Policy, 103.
[4]. Singh, E., et al. (2003) developed a model to understand the spread of infections dependent on carriers and environmental factors. Journal of Biological Systems, 11.
[5]. Laskowski, et al. (2011) analyzed how demographic factors influenced influenza spread in remote areas. Scientific Reports, 1.
[6]. Sun, et al. (2021) explored the relationship between economic changes and infectious disease mortality. Frontiers in Public Health, 9.
[7]. Bonds, et al. (2010) discussed the link between poverty and the ecology of infectious diseases. Proc. Royal Soc. B: Biological Sciences, 277, 1685.
[8]. Mo, et al. (2021) examined how economic growth levels correlated with the COVID-19 spread across Chinese provinces. J. Epidemiol Community Health, 75, 9.
[9]. Wong, L. (2020) Emphasized the role of population density in the spread of COVID-19. Plos One, 15, 12.
[10]. Doyle, B. (2000) Highlighted infectious disease rates in the US region adjacent to Mexico between 1990-1998. J. Infectious Diseases, 182.