


1. Introduction
Customer churn is when a company or organization loses its original customers, which means that the customers no longer buy or use the company's or organization's products or services [1]. Customer churn is a serious problem for any company or organization because customer churn can lead to problems such as decreased sales, reduced market share, and tarnished brand image, which can affect the long-term growth and profitability of the company or organization [2,3].
Customer churn is usually due to various reasons such as poor product or service quality, high prices, poor customer service, and competitor's advantage [4]. Therefore, understanding the causes and patterns of customer churn can help a company or organization to take appropriate measures to reduce customer churn, increase customer loyalty and satisfaction, and thus increase sales and market share [5-7].
Research on customer churn can help companies or organizations to understand customer needs and preferences, identify potential problems and opportunities, improve product or service quality, improve customer service, enhance brand image, etc. [8,9], so as to better satisfy customers' needs, improve customer loyalty and satisfaction, and increase the long-term profitability of the company or organization [10].
In this paper, we aim to solve the customer churn problem by segmenting customers using k-means clustering algorithm and building a classification model to predict the probability of customer churn. We use classification models to predict customer churn probability and analyze the causes and patterns of customer churn. Finally, we propose appropriate solutions and recommendations to reduce customer churn, increase customer loyalty and satisfaction, and thus increase the long-term profitability of the company or organization. The research results in this paper can provide an important reference and decision-making basis for companies or organizations to help them better meet customer needs and improve market competitiveness.
2. Data set introduction
The dataset of this paper is a private bank customer churn dataset that contains customer information of a virtual telecommunication company, including customers' personal information, service usage, and payment information. The dataset contains 7043 samples and each sample contains 21 features. Among them, 20 features are customers' personal information and service usage, such as customers' gender, age, whether they have a spouse, whether they have children, whether they use telephone service, whether they use internet service, etc. The last feature is whether the customer is churned or not, where 0 means the customer is not churned and 1 means the customer is churned.
The purpose of this dataset is to analyze and model customer data to predict customer churn and provide appropriate solutions and recommendations to reduce churn, increase customer loyalty and satisfaction, and thus increase the long-term profitability of a company or organization. The dataset is a typical binary classification problem that can be modeled and predicted using various machine learning algorithms such as logistic regression, decision trees, random forests, and neural networks. Some of the data is shown in Figure 1.
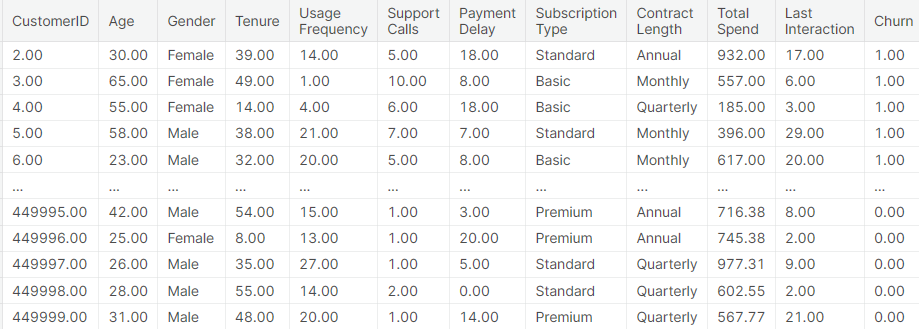
Figure 1: Data set introduction.
(Photo credit: Original)
3. Cluster analysis
In this paper, we find the number of clusters based on the Elbow method, which is a commonly used cluster analysis method to determine the optimal number of clusters. In cluster analysis, the selection of the number of clusters is a very important issue, and choosing an inappropriate number of clusters will affect the accuracy and interpretability of the clustering results. Therefore, the Elbow method can help us choose the best number of clusters in cluster analysis, so as to improve the accuracy and interpretability of cluster analysis. Specifically, the steps of Elbow method are to analyze the data by clustering, calculate the intra-cluster mean error (SSE) under different numbers of clusters, and then plot the relationship between the number of clusters and SSE. Then, we observe the SSE versus the number of clusters and find the inflection point where the SSE decreases slowly, which is the optimal number of clusters. It should be noted that the Elbow method is not an absolutely accurate method, so we need to combine the actual problem and experience to make a judgment when using it. At the same time, in practical applications, it can also be combined with other cluster analysis methods to determine the optimal number of clusters, such as profile coefficient and Gap statistic. In conclusion, Elbow method is a simple but effective cluster analysis method, which can help us to choose the best number of clusters in cluster analysis, so as to improve the accuracy and interpretability of cluster analysis, and the results are shown in Figure 2.
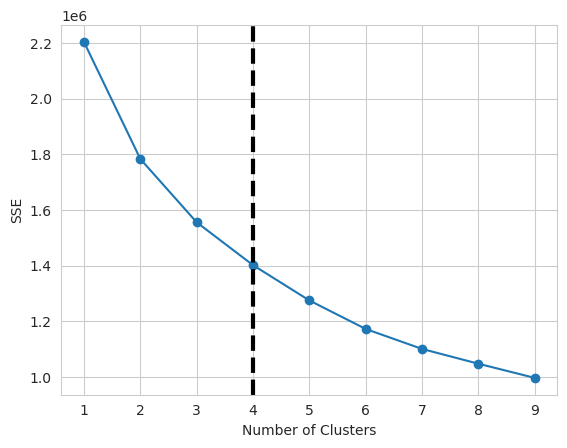
Figure 2: Cluster analysis.
(Photo credit: Original)
From the above figure, it can be seen that 4 is the optimal number of clusters according to the Elbow method.
The four groups are categorized according to whether the customers are churned or not, and the statistical results are shown in Figure 3:
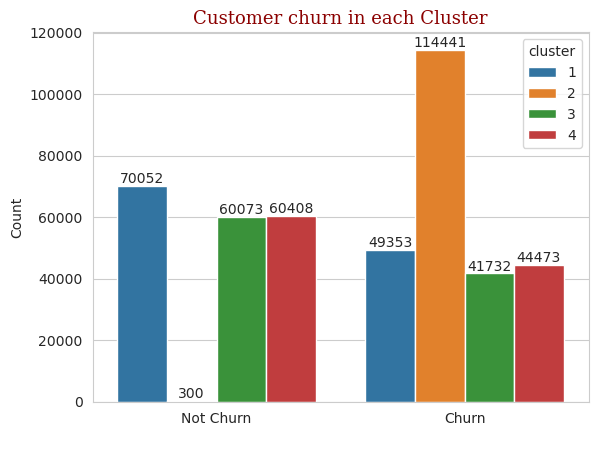
Figure 3: Cluster analysis.
(Photo credit: Original)
As shown in the figure above, the difference between customers churned and customers not churned is insignificant on category 1, category 3 and category 4, while category 2 has a very significant difference between customers churned and customers not churned.
Most of the customers of category 2 type are churned, as long as a very small number of customers are not churned. Importance statistics analysis of customer information for category 2 reveals some of the causes of customer churn, and the results of parameter importance statistics ranking are shown in Figure 4.
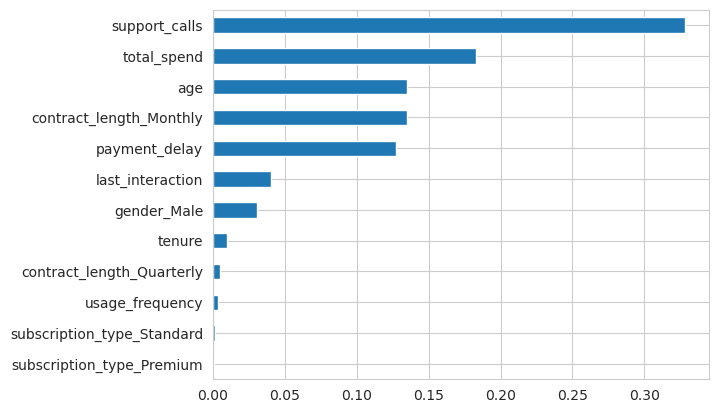
Figure 4: Feature Importance Ranking.
(Photo credit: Original)
4. Cluster analysis
Decision tree and logistic regression models are two classification models commonly used in machine learning. They are both supervised learning models that can be used for classification and regression problems.
4.1. Decision Tree Model
Decision tree model is a classification model based on a tree structure. It divides the dataset into many small subsets, each of which corresponds to a node of the tree. Each node of the decision tree represents a feature, each branch represents a value of that feature, and the leaf nodes represent the classification results. The decision tree generation process can be done using a greedy algorithm, i.e., the optimal feature is selected as a node for classification each time. The classification process of the decision tree starts from the root node and traverses downward layer by layer according to the values of the features until it reaches the leaf nodes. The advantages of the decision tree model are that it is easy to understand and interpret, can handle multiple classification problems, and is suitable for large-scale datasets and high-dimensional datasets. In addition, decision trees can handle missing values and outliers and are robust.
The disadvantage of decision tree models is that they are prone to overfitting, especially for complex datasets. For continuous variables, decision tree models require discretization, which may affect the performance of the model. In addition, the classification results of the decision tree model may be unstable because it is very sensitive to small changes in the input data. Application scenarios for decision tree models include medical diagnosis, financial risk assessment, customer categorization, and product recommendation.
4.2. Logistic Regression Model
Logistic regression model is a probability-based classification model. It maps the input data to a probability value that represents the probability that a sample belongs to a certain category. The basic idea of a logistic regression model is to perform a weighted summation of the input data and then map the result to the interval [0,1] through a nonlinear function (i.e., a sigmoid function). The classification results of the model are judged based on this probability value, and samples with a probability value greater than 0.5 are usually classified as positive cases, and samples with a probability value less than 0.5 are classified as negative cases. The advantages of the logistic regression model are that it is simple, easy to implement and interpret, and can handle both binary and multiple classification problems. In addition, logistic regression models are robust to outliers and noise.
The disadvantage of logistic regression models is that they perform poorly for nonlinear problems. In addition, logistic regression models require feature engineering, i.e., preprocessing and feature selection of the input data, which may affect the performance of the model. Application scenarios for logistic regression models include credit assessment, disease diagnosis, and advertising click-through rate prediction.
4.3. Comparison of Decision Tree Model and Logistic Regression Model
Decision tree model and logistic regression model are both commonly used classification models, but their principles and application scenarios are different. The decision tree model is suitable for multi-categorization problems, and can handle high dimensional and large-scale data sets, but it is easy to overfitting. The logistic regression model is suitable for binary and multiclassification problems, and has strong robustness to outliers and noise, but performs poorly for nonlinear problems.
In practical applications, we can choose the appropriate classification model according to the characteristics of the specific problem. If the dataset is more complex, there are multiple features and multiple categories, you can consider using a decision tree model. If the dataset is relatively simple, with only a small number of features and categories, we can consider using a logistic regression model. In addition, we can also combine other classification models, such as Support Vector Machines and Simple Bayes, to improve the accuracy and interpretability of classification.
5. Result
The training set, validation set and test set are divided according to 6:2:2, the training set is used to train the model, the validation set is used to validate the results of the training, and the test set is used for the testing of the model, and the results are shown in Table 1:
Table 1: Model evaluation. | ||||
Model | Accuracy | Balanced Accuracy | ROC AUC | F1 Score |
Decision Tree Classifier | 0.99 | 0.99 | 0.99 | 0.99 |
Logistic Regression | 0.90 | 0.90 | 0.90 | 0.90 |
From the results, it can be seen that decision tree predicts customer churn with 99% accuracy while logistic regression predicts customer churn with 90% accuracy.
6. Conclusion
Customer churn is when a company or organization loses its original customers, which means that the customers no longer buy or use the company's or organization's products or services. Customer churn is a serious problem for any company or organization because customer churn can lead to problems such as decreased sales, reduced market share, and damaged brand image, which can affect the long-term growth and profitability of the company or organization.
Elbow method is a simple but effective cluster analysis method which can help us to choose the best number of clusters in cluster analysis so as to improve the accuracy and interpretability of cluster analysis, according to Elbow method, 4 is the best number of clusters. Statistical analysis of customer churn in each category reveals that the difference between customer churn and customer non-churn is not significant on category 1, category 3 and category 4, while category 2 has a very significant difference between customer churn and customer non-churn.
Customer churn is predicted using decision tree and random forest models respectively. In this problem, the prediction accuracy of the decision tree is 99% while the logistic regression is 90%. Analyzing this result in terms of principle, this result may be due to a number of reasons.
First, decision tree and logistic regression are two different classification algorithms with different principles and assumptions. Decision tree is a classification algorithm based on tree structure, which constructs a decision tree by dividing the data step by step. In prediction, based on the eigenvalues of the samples, judgment is made along the branches of the decision tree, and the classification result is finally obtained. And logistic regression is a classification algorithm based on probabilistic model, which obtains a logistic regression equation for predicting the classification results of new samples by modeling the relationship between sample features and target variables.
Secondly, decision trees and logistic regression have different application scenarios. Decision trees are usually applicable in situations where there is a nonlinear relationship between features, uneven data distribution, and a small number of samples, while logistic regression is usually applicable in situations where there is a linear relationship between features, a more even data distribution, and a large number of samples. Therefore, the prediction accuracy of decision trees and logistic regression may vary in different datasets and application scenarios.
In addition, the prediction accuracy is also affected by many other factors, such as data quality, feature selection, and model parameters. In practical applications, we need to consider these factors comprehensively and choose the classification algorithms and models that are most suitable for the problem at hand.
In conclusion, decision tree and logistic regression are two common classification algorithms with different principles and applicable scenarios, so their prediction accuracies may vary in different datasets and application scenarios. In practical applications, we need to choose the most suitable classification algorithms and models according to the characteristics of the problem and the data, and consider factors such as prediction accuracy, interpretability, and running time.
References
[1]. K. S W ,A. A A ,S. K W , et al.Customer churn prediction in telecom sector using machine learning techniques[J].Results in Control and Optimization,2024,14
[2]. Nisha M ,C. V J ,A. K , et al.A production inventory model with server breakdown and customer impatience[J].Annals of Operations Research,2023,331(2):1269-1304.
[3]. Asad K ,Zartashia M ,Hussain A , et al.Customer churn prediction using composite deep learning technique[J].Scientific Reports,2023,13(1):17294-17294.
[4]. Ele I S ,Alo* R U,Nweke F H, et al.Regression-Based Machine Learning Framework for Customer Churn Prediction in Telecommunication Industry[J].Journal of Advances in Information Technology,2023,14(5):
[5]. Yongkil A .Predicting customer attrition using binge trading patterns: Implications for the financial services industry[J].Journal of the Operational Research Society,2023,74(8):1878-1891.
[6]. Zahra S ,Omar H K ,Morteza S .Data-driven personalized assortment optimization by considering customers’ value and their risk of churning: Case of online grocery shopping[J]. Computers Industrial Engineering,2023,182.
[7]. Li J ,Bai X ,Xu Q , et al.Identification of Customer Churn Considering Difficult Case Mining[J].Systems,2023,11(7):
[8]. Yu F ,Bi W ,Cao N , et al.Customer Churn Prediction Framework of Inclusive Finance Based on Blockchain Smart Contract[J].Computer Systems Science and Engineering,2023,47(1):1-17.
[9]. MDS Global Launches Marketing Decision Intelligence Platform to Reduce Churn and Increase Revenue[J].Telecomworldwire,2023,
[10]. Soni K P ,Nelson L .PCP: Profit-Driven Churn Prediction using Machine Learning Techniques in Banking Sector[J].International Journal of Performability Engineering,2023,19(5):303-311.
Cite this article
Jiang,Y. (2024). Customer Churn Analysis Prediction Based on Cluster Analysis and Machine Learning Algorithms. Advances in Economics, Management and Political Sciences,77,192-198.
Data availability
The datasets used and/or analyzed during the current study will be available from the authors upon reasonable request.
Disclaimer/Publisher's Note
The statements, opinions and data contained in all publications are solely those of the individual author(s) and contributor(s) and not of EWA Publishing and/or the editor(s). EWA Publishing and/or the editor(s) disclaim responsibility for any injury to people or property resulting from any ideas, methods, instructions or products referred to in the content.
About volume
Volume title: Proceedings of the 3rd International Conference on Business and Policy Studies
© 2024 by the author(s). Licensee EWA Publishing, Oxford, UK. This article is an open access article distributed under the terms and
conditions of the Creative Commons Attribution (CC BY) license. Authors who
publish this series agree to the following terms:
1. Authors retain copyright and grant the series right of first publication with the work simultaneously licensed under a Creative Commons
Attribution License that allows others to share the work with an acknowledgment of the work's authorship and initial publication in this
series.
2. Authors are able to enter into separate, additional contractual arrangements for the non-exclusive distribution of the series's published
version of the work (e.g., post it to an institutional repository or publish it in a book), with an acknowledgment of its initial
publication in this series.
3. Authors are permitted and encouraged to post their work online (e.g., in institutional repositories or on their website) prior to and
during the submission process, as it can lead to productive exchanges, as well as earlier and greater citation of published work (See
Open access policy for details).
References
[1]. K. S W ,A. A A ,S. K W , et al.Customer churn prediction in telecom sector using machine learning techniques[J].Results in Control and Optimization,2024,14
[2]. Nisha M ,C. V J ,A. K , et al.A production inventory model with server breakdown and customer impatience[J].Annals of Operations Research,2023,331(2):1269-1304.
[3]. Asad K ,Zartashia M ,Hussain A , et al.Customer churn prediction using composite deep learning technique[J].Scientific Reports,2023,13(1):17294-17294.
[4]. Ele I S ,Alo* R U,Nweke F H, et al.Regression-Based Machine Learning Framework for Customer Churn Prediction in Telecommunication Industry[J].Journal of Advances in Information Technology,2023,14(5):
[5]. Yongkil A .Predicting customer attrition using binge trading patterns: Implications for the financial services industry[J].Journal of the Operational Research Society,2023,74(8):1878-1891.
[6]. Zahra S ,Omar H K ,Morteza S .Data-driven personalized assortment optimization by considering customers’ value and their risk of churning: Case of online grocery shopping[J]. Computers Industrial Engineering,2023,182.
[7]. Li J ,Bai X ,Xu Q , et al.Identification of Customer Churn Considering Difficult Case Mining[J].Systems,2023,11(7):
[8]. Yu F ,Bi W ,Cao N , et al.Customer Churn Prediction Framework of Inclusive Finance Based on Blockchain Smart Contract[J].Computer Systems Science and Engineering,2023,47(1):1-17.
[9]. MDS Global Launches Marketing Decision Intelligence Platform to Reduce Churn and Increase Revenue[J].Telecomworldwire,2023,
[10]. Soni K P ,Nelson L .PCP: Profit-Driven Churn Prediction using Machine Learning Techniques in Banking Sector[J].International Journal of Performability Engineering,2023,19(5):303-311.