


1. Internet Commerce
The internet commerce industry, also known as the e-commerce industry, is a pivotal component of the modern digital economy that involves the online trading of goods and services. Originating in the 1960s and 70s with foundational systems like Electronic Data Interchange (EDI) and teleshopping, it truly flourished in the 1990s with the rise of platforms such as Amazon and eBay [1]. This evolution marked a revolutionary shift in how businesses functioned. Instead of relying solely on physical storefronts, companies, regardless of size, now have the means to connect with a worldwide market. Today's e-commerce landscape offers unparalleled convenience and a broad array of choices for consumers, all while navigating challenges like cybersecurity and intense competition. E-commerce sales worldwide have continued to grow steadily throughout the years, and the pandemic served as a catalyst for digital transformation, causing an increase of 19% in worldwide e-commerce revenue between 2019 to 2020 [2].
Amazon and Alibaba stand as titans in the e-commerce landscape, each dominating in their primary markets of the United States and China, respectively. Both companies sprouted during the burgeoning era of the internet: Amazon was launched by Jeff Bezos in 1994, initially targeting the U.S. market. Since then, it has broadened its reach globally, offering a multitude of services. Beyond its original retail model, where it purchases and resells products, Amazon has developed a bustling marketplace for third-party sellers. Additionally, its subscription service, Amazon Prime, and ventures into streaming and logistics further diversify its portfolio. For its payment mechanism, Amazon introduced Amazon Pay, a payment system and electronic wallet designed for online and physical store customers and retailers. This system facilitates transactions between purchasers and vendors, streamlining the check-out experience for customers and giving retailers easier access to their credit card details [3]. On the other side of the globe, Alibaba, established by Jack Ma in 1999, operates with a tripartite approach. Its B2B arm, Alibaba.com, bridges manufacturers primarily from China to businesses worldwide. Tmall, its B2C platform, facilitates direct sales from brands to Chinese consumers, while Taobao, a C2C platform, empowers individual sellers. Complementing these services, Alibaba's Alipay has emerged as China's first online payment platform. In 2016, Alipay recorded 175 million daily transactions, and as of now, it has 870 million active users globally, reflecting the company's expansive influence in the Chinese market [3]. The disparities in their primary markets, business strategies, service diversification, and payment mechanisms make them intriguing case studies as leading figures in the industry.
2. Analysis of AMZN and BABA
Table 1. Financial Metrics of AMZN
Year | Total Revenue (in billion USD) | EBIT (in billion USD) | EBIT/Revenue | EPS(USD) | Annual Return |
2019 | 280.522 | 15.576 | 0.05552 | 1.17 | 23.01% |
2020 | 386.064 | 25.825 | 0.06689 | 2.13 | 78.18% |
2021 | 469.822 | 39.960 | 0.08505 | 3.3 | 3.49% |
2022 | 513.983 | -3.569 | -0.006943 | -0.27 | -49.76% |
The correlation coefficient between total revenue and EBIT/Revenue is 0.6943 | |||||
Table 2. Financial Metrics of BABA
Year | Total Revenue (in billion CNY) | EBIT (in billion CNY) | EBIT/Revenue | EPS(USD) | Annual Return |
2019 | 561.520 | 70.022 | 0.1247 | 4.97 | 60.48% |
2020 | 509.711 | 171.825 | 0.3371 | 7.9 | 9.20% |
2021 | 717.289 | 170.054 | 0.2371 | 8.35 | -50.51% |
2022 | 853.062 | 80.161 | 0.09397 | 3.59 | -25.34% |
The correlation coefficient between total revenue and EBIT/Revenue is -0.1554 | |||||
The data shown in Tables 1 and 2 presents the total revenue, EBIT, EBIT/Revenue, EPS, and annual return of Amazon and Alibaba during the years of 2019 to 2022. From 2019 to 2022, the total revenue trend is positive for Amazon, increasing from 280.5 billion USD to 514 billion USD, with an increment of approximately 100 billion USD annually. This shows a relatively consistent growth of Amazon throughout the years. Alibaba also presents a constant growth in total revenue, increasing from 561.5 billion CNY in 2019 to 853 billion CNY in 2022. However, Alibaba saw an initial decrease in total revenue from 2019 to 2020, from 561.5 billion CNY to 509.7 billion CNY in 2020, indicating that external factors caused the total payment to decrease in that particular year. This drop in total revenue might be caused by the antitrust investigation on Alibaba by the Chinese market regulator over concerns of monopolistic behavior. This move heightens the government’s scrutiny of the e-commerce giant in China, and Alibaba vowed strict compliance and dedication to all regulatory demands [4]. The EBIT, which stands for the Earnings before interest and taxes, serves as a measure of comparison when comparing performances across different companies. Amazon’s EBIT showed fluctuation, with a significant drop in 2022, a 50.77% decline from 2021, resulting in a negative EBIT (-3.57 billion USD). Alibaba, on the other hand, peaked in 2020 and 2021, but also experienced a reduction in 2022. The significant drop in Amazon’s EBIT and Earnings Per Share (EPS) indicates a possible increase in their operational costs, inferring that Amazon either made substantial investments or had unforeseen expenses during the year 2022. It could also be due to reduced revenue and external factors that are affecting the ecommerce industry. In the face of challenging year-on-year comparisons, e-commerce businesses grappled with the reopening of the economy, which saw many consumers return to in-person shopping. By the beginning of 2022, issues like inflation, supply chain disruptions, and the Ukraine conflict added to the difficulties faced by Amazon and similar tech firms [5]. Alibaba’s EBIT and EPS hit its lowest amount in 5 years in the year of 2022, indicating that despite the universal challenges affecting the global supply chains and consumer outlook, Alibaba is also facing challenges posed by shifts in consumer behavior [6]. Therefore, Alibaba remained committed to enhancing their customer value proposition as well as focusing on generating sustainable cost structure to enhance the returns [6].
3. Search Engine
The search engine industry serves as the cornerstone of the modern digital age, facilitating the organization and retrieval of the vast expanse of information available on the internet. It is not just a technological marvel but also a significant financial sector that has profound implications for global markets and investment strategies. Originating in the early 1990s, the industry has evolved into a multi-billion-dollar arena, led by giants like Google and Baidu. These companies generate substantial revenue primarily through advertising models, where data analytics, and targeted marketing play a crucial role. The industry's financial impact extends to various stakeholders, including advertisers, publishers, and investors, making it a key focus for financial analysts and portfolio managers.
As a subsidiary of Alphabet Inc., Google is one of the most valuable companies in the world, consistently posting impressive revenue figures primarily driven by its advertising business. Its diversified portfolio, which includes cloud computing, hardware, and various digital services, has made it a staple in investment portfolios and a key player in financial markets. With a robust balance sheet and a history of strong financial performance, Google is often viewed as a bellwether for the tech industry and broader market trends. Its stock is one of the FAANG stocks (Facebook, Amazon, Apple, Netflix, Google), which are widely considered to be high-growth and high-impact in the investment community.
As the dominant search engine in China, Baidu has a strong revenue model primarily based on online advertising and, increasingly, on cloud services and artificial intelligence. Its financial performance is closely watched as an indicator of consumer and business trends within China, the world's second-largest economy. Baidu's stock is often included in portfolios focused on emerging markets and technology. The company has also ventured into various financial services, including online payments and wealth management, further solidifying its financial footprint. Both Google and Baidu are key constituents of major stock indices and are closely followed by investors, analysts, and financial media. Their financial activities, including mergers and acquisitions, capital allocation strategies, and quarterly earnings, often have ripple effects across global financial markets. As such, they serve as both technological innovators and financial heavyweights, each shaping the economic landscape in their respective spheres of influence.
4. Analysis of BIDU and GOOG
Table 3. Financial Metrics of BIDU
Year | Total Revenue (in billion CNY) | EBIT (in billion CNY) | EBIT/REV | EPS(USD) | Annual Return |
2019 | 107.413 | 2.620 | 0.02439 | 0.8 | -20.35% |
2020 | 107.074 | 14.340 | 0.1339 | 9.96 | 44.95% |
2021 | 124.493 | 14.199 | 0.1141 | 4.37 | -37.91% |
2022 | 123.675 | 13.025 | 0.1053 | 2.88 | -22.70% |
The correlation coefficient between total revenue and EBIT/Revenue is 0.4152 | |||||
Table 4. Financial Metrics of GOOG
Year | Total Revenue (in billion USD) | EBIT (in billion USD) | EBIT/REV | EPS(USD) | Annual Return |
2019 | 161.857 | 35.928 | 0.2220 | 2.48 | 29.86% |
2020 | 182.527 | 41.224 | 0.2259 | 2.96 | 30.49% |
2021 | 257.637 | 78.714 | 0.3055 | 5.69 | 66.70% |
2022 | 282.836 | 74.842 | 0.2646 | 4.59 | -38.43% |
The correlation coefficient between total revenue and EBIT/Revenue is 0.2274 | |||||
The data in Tables 3 and 4 above outlines the financial metrics for BIDU and GOOG, spanning 2019 through 2022. During this period, GOOG showcased a rising trend in total revenue, expanding from 161.857 billion USD in 2019 to 282.836 billion USD by 2022. This growth trajectory underscores the consistent market expansion experienced by Google in these years. On the contrary, BIDU's revenue pattern also indicates growth, rising from 107.413 billion CNY in 2019 to 123.675 billion CNY in 2022. Nevertheless, there's a slight dip in 2022 compared to 2021, which could hint at potential challenges or market saturation points faced by BIDU during this timeframe. For GOOG, the EBIT rose dramatically until 2021, hitting 78.714 billion USD, but witnessed a downturn in 2022, declining to 74.842 billion USD. BIDU, conversely, experienced a significant surge in EBIT from a mere 2.62 billion CNY in 2019 to 14.34 billion CNY in 2020, maintaining a similar level in the subsequent years but showing a minor drop in 2022. The EBIT trajectory for GOOG indicates a potential plateauing of their operational profitability after substantial growth, possibly due to market dynamics or increased operating costs. BIDU's EBIT, while impressive in its development, also suggests a level of stabilization in the more recent years, which might be a reflection of both internal strategies and the broader market landscape. Furthermore, the Earnings Per Share (EPS) metric, which provides a per-share profitability snapshot, revealed that both firms faced challenges in 2022, with GOOG's EPS declining to 4.59 USD from 5.69 USD in 2021 and BIDU's dropping to 2.88 USD from 4.4 USD in the preceding year. Such EPS trends might hint at broader industry challenges, shifts in consumer behavior, or company-specific factors impacting shareholder returns. In conclusion, while BIDU and GOOG displayed commendable performances in specific years, the data suggests they encountered hurdles in 2022. This calls for a deeper investigation into the macroeconomic and industry-specific factors that might have influenced these tech giants during the reported years.
5. Correlation Analysis
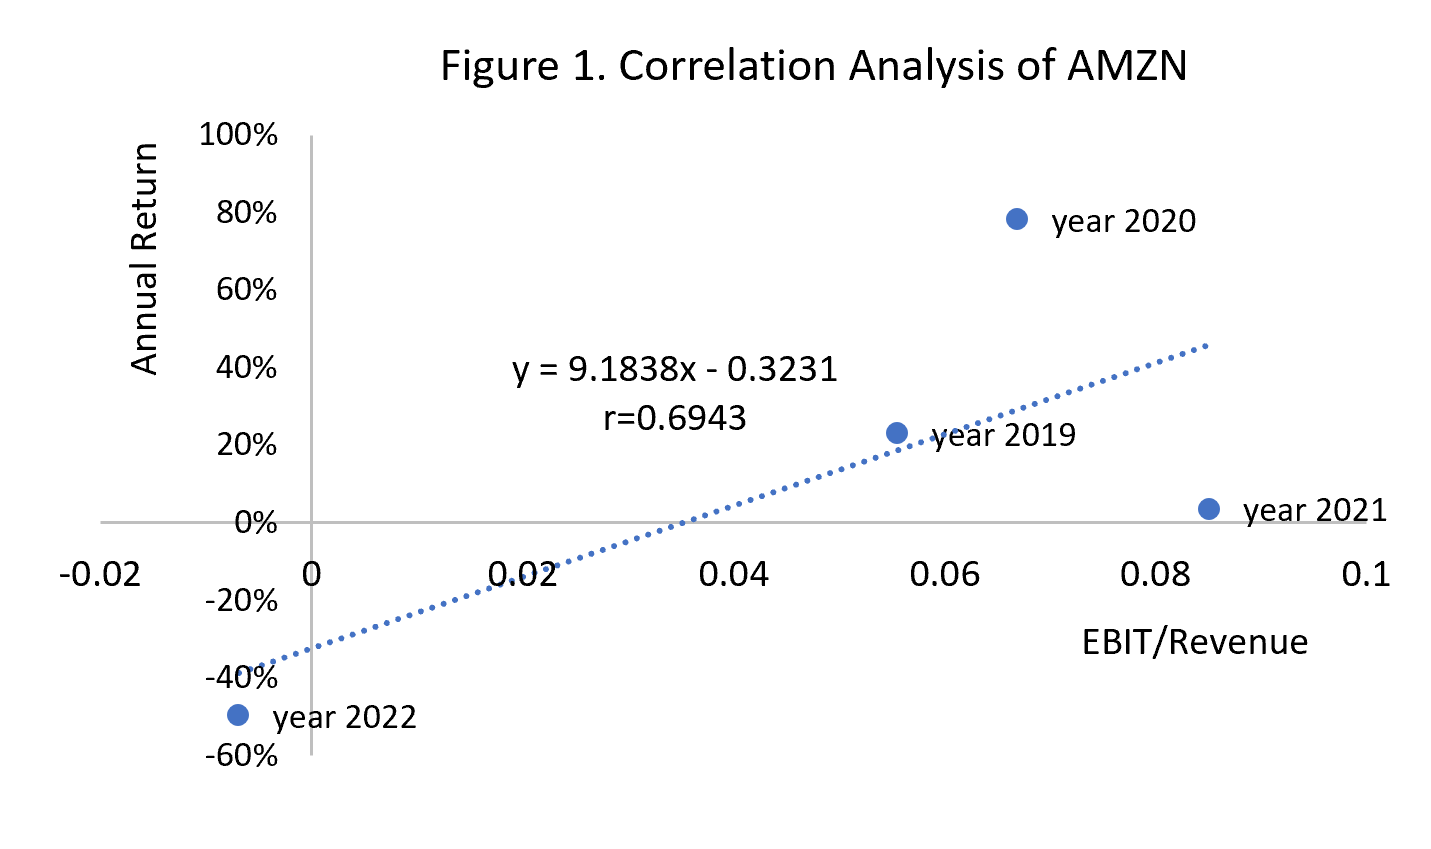
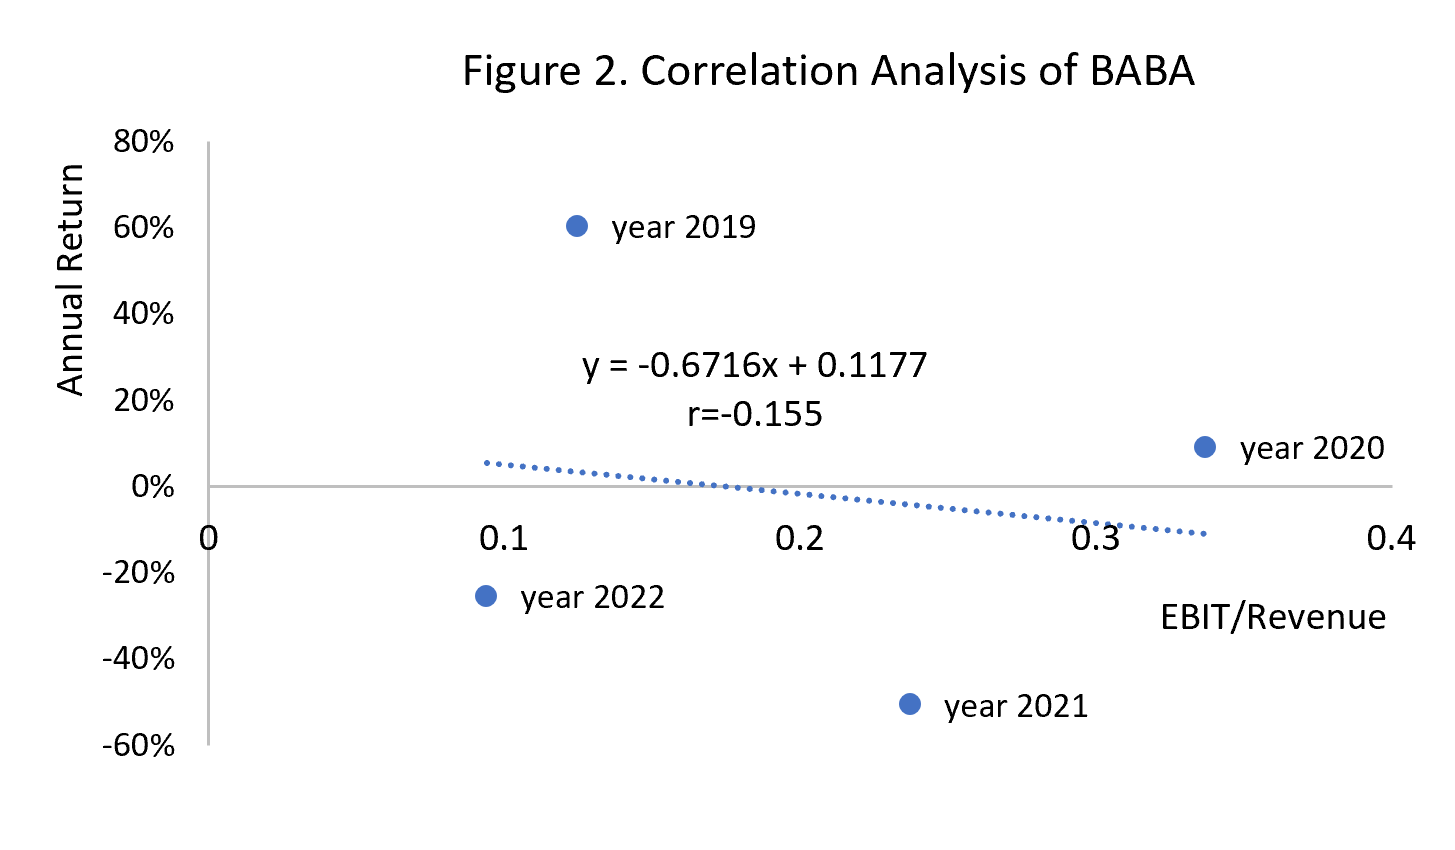
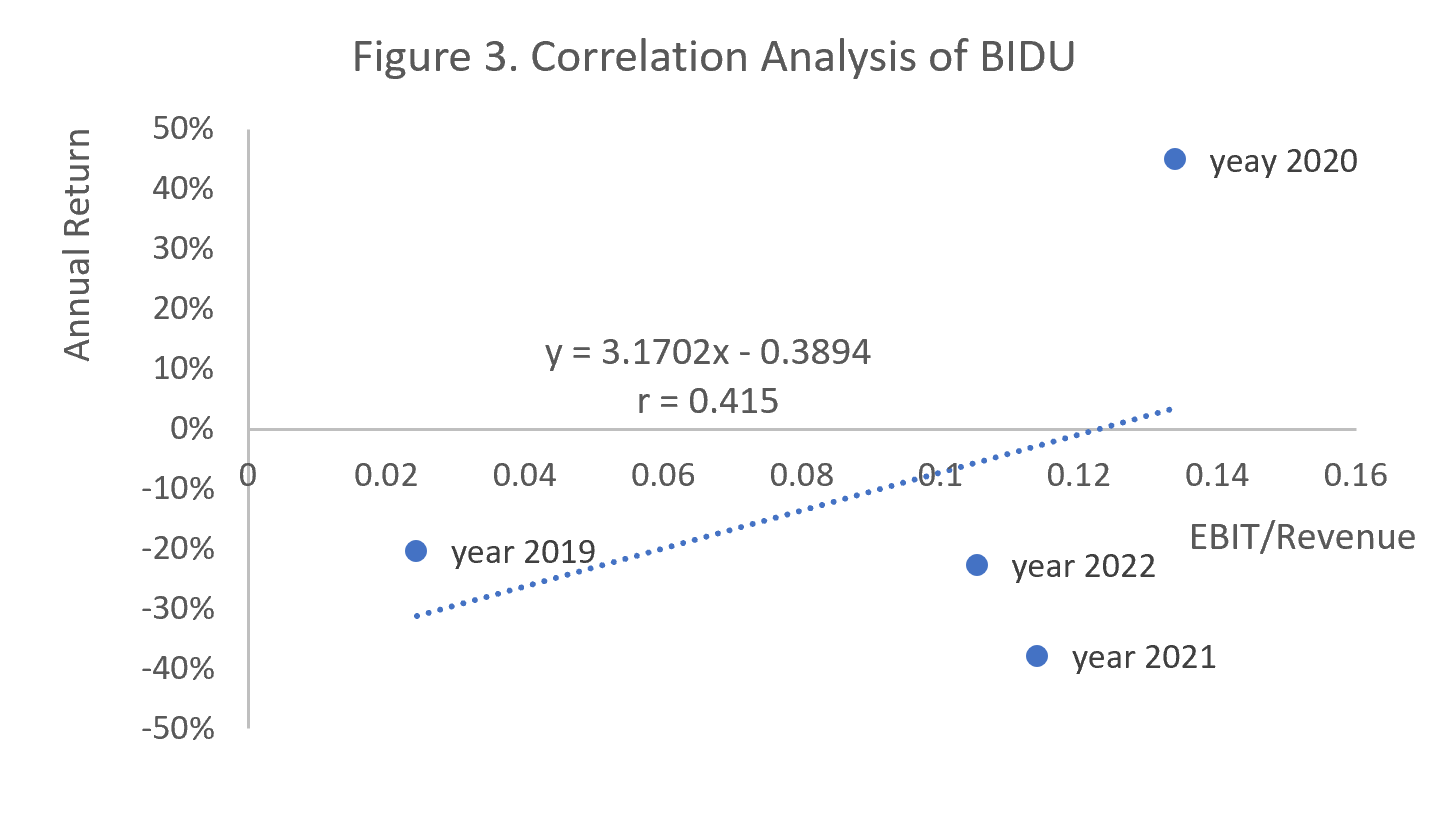
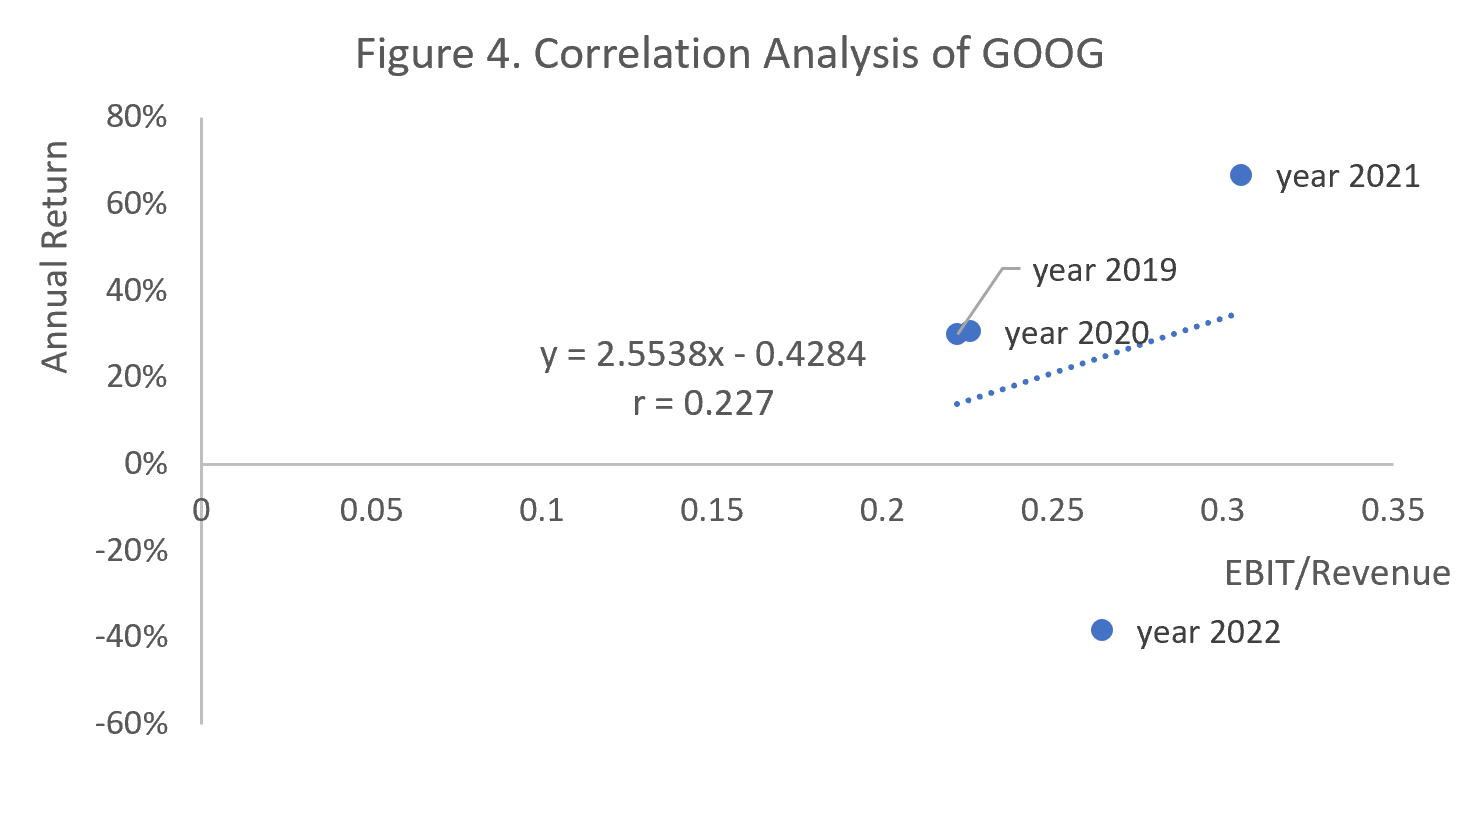
As shown in Figures 1-4, this study employed Pearson correlation analysis to examine relationships between EBIT/Total Revenue and Annual Return from 2019 to 2022, deriving insights from the datasets mentioned above. Amazon (AMZN) demonstrates a notably positive correlation of 0.694 between its EBIT/Total Revenue and Annual Return. This implies that as Amazon achieves greater operational efficiency, its overall returns tend to increase, signaling the market's appreciation for Amazon's efficiency. In contrast, Alibaba (BABA) exhibits a slight negative correlation of -0.155, suggesting a minor inverse relationship between its operational efficiency and returns. This could indicate other influential factors, market perceptions, other financial determinants, or external challenges affecting Alibaba's stock performance, irrespective of its operational efficiency. Meanwhile, Baidu (BIDU) showcases a moderate positive correlation of 0.4152, hinting that increases in operational efficiency are somewhat associated with improved returns, though not as robustly as seen with Amazon. Lastly, Google (GOOG) presents a weak positive correlation of 0.227, indicating that while a positive relationship exists between its operational efficiency and returns, other elements might also significantly impact its stock performance. These correlations offer insights into the potential interplay between a company's operational prowess and its market returns. However, it's paramount to remember that correlation doesn't equate to causation. While these figures provide valuable perspective, a comprehensive understanding requires delving into the broader context and various factors influencing each company's performance.
It should be noted that the use of Pearson correlation coefficient analysis here does not account for the autocorrelation present within each of the two variables, EBIT/Revenue and Annual Return, over the four-year period from 2019 to 2022. Additionally, the sample size of only four data pairs might be considered small, but it represents a relatively short time span, thus providing a stronger rationale for assuming linearity between the variables. In any specific scenario, every statistical analysis method has its limitations, stemming from its inherent assumptions, and the choice of statistical analysis method is a compromise made after considering various factors that could affect the outcomes. With these caveats in mind, this paper presents its conclusions.
6. Conclusions
This meticulous analysis delineated the financial trajectories of pivotal entities within the Internet Commerce and Search Engine domains, emphasizing Amazon, Alibaba, Google, and Baidu. While charting its distinctive growth arc, each of these corporations unveiled salient patterns and confronted industry-specific challenges. Profitability, a key metric of corporate success, varied among the companies. Compared with its EBIT fluctuations, Amazon's consistent revenue growth suggests robust revenue generation capabilities but potential challenges in cost containment or strategic investments. Alibaba's slight dip in revenue for a specific year, coupled with its EBIT trends, points towards external market pressures, possibly regulatory, impacting its profitability. Google's steady ascent in revenue and a subsequent plateau in EBIT signal potential saturation or increased operational expenditures, while Baidu's impressive EBIT surge suggests effective strategies driving operational profitability. The positive correlation between operational efficiency and market returns for firms like Amazon and Baidu underscores the market's valuation of enhanced functional competencies. On the other hand, Alibaba's marginal negative correlation indicates the potential influence of external factors on its financial performance, and Google's moderate correlation highlights the intricate balance of variables determining its market standing.
This comprehensive analysis provides a snapshot of these tech titans' immediate financial health and profitability. It emphasizes their intricate interplay with broader market dynamics, regulatory nuances, and overarching macroeconomic forces.
References
[1]. M. (2020, November 23). The History of Ecommerce: How Did It All Begin? Miva. https://blog.miva.com/the-history-of-ecommerce-how-did-it-all-begin
[2]. International Trade Administration (n.d.). Impact of COVID Pandemic on eCommerce. https://blog.miva.com/the-history-of-ecommerce-how-did-it-all-begin
[3]. Bilotta, N., & Romano, S. (2019). Tech Giants in Banking: The Implications of a New Market Power. Istituto Affari Internazionali (IAI). http://www.jstor.org/stable/resrep19672
[4]. ZHONG, R. (2020, December 24). China Opens Antitrust Investigation Into Alibaba. New York Times.
[5]. Palmer, A. (2022, December 19). Amazon stock gives up last of its pandemic gains after almost 50% slump in 2022. CNBC.
[6]. Reporter, S. (2022, October 19). Alibaba Group 2022 net income drops nearly 60% to US$9.77b. Retailasia.
Cite this article
Li,J. (2024). Titans of the Digital Age: A Profitability Analysis of Leading Search Engines and Internet Commerce Companies. Advances in Economics, Management and Political Sciences,77,15-20.
Data availability
The datasets used and/or analyzed during the current study will be available from the authors upon reasonable request.
Disclaimer/Publisher's Note
The statements, opinions and data contained in all publications are solely those of the individual author(s) and contributor(s) and not of EWA Publishing and/or the editor(s). EWA Publishing and/or the editor(s) disclaim responsibility for any injury to people or property resulting from any ideas, methods, instructions or products referred to in the content.
About volume
Volume title: Proceedings of the 3rd International Conference on Business and Policy Studies
© 2024 by the author(s). Licensee EWA Publishing, Oxford, UK. This article is an open access article distributed under the terms and
conditions of the Creative Commons Attribution (CC BY) license. Authors who
publish this series agree to the following terms:
1. Authors retain copyright and grant the series right of first publication with the work simultaneously licensed under a Creative Commons
Attribution License that allows others to share the work with an acknowledgment of the work's authorship and initial publication in this
series.
2. Authors are able to enter into separate, additional contractual arrangements for the non-exclusive distribution of the series's published
version of the work (e.g., post it to an institutional repository or publish it in a book), with an acknowledgment of its initial
publication in this series.
3. Authors are permitted and encouraged to post their work online (e.g., in institutional repositories or on their website) prior to and
during the submission process, as it can lead to productive exchanges, as well as earlier and greater citation of published work (See
Open access policy for details).
References
[1]. M. (2020, November 23). The History of Ecommerce: How Did It All Begin? Miva. https://blog.miva.com/the-history-of-ecommerce-how-did-it-all-begin
[2]. International Trade Administration (n.d.). Impact of COVID Pandemic on eCommerce. https://blog.miva.com/the-history-of-ecommerce-how-did-it-all-begin
[3]. Bilotta, N., & Romano, S. (2019). Tech Giants in Banking: The Implications of a New Market Power. Istituto Affari Internazionali (IAI). http://www.jstor.org/stable/resrep19672
[4]. ZHONG, R. (2020, December 24). China Opens Antitrust Investigation Into Alibaba. New York Times.
[5]. Palmer, A. (2022, December 19). Amazon stock gives up last of its pandemic gains after almost 50% slump in 2022. CNBC.
[6]. Reporter, S. (2022, October 19). Alibaba Group 2022 net income drops nearly 60% to US$9.77b. Retailasia.