


1. Introduction
Over the past two decades, the computational support provided by big data and cloud computing has greatly enhanced the ability to handle the vast amount of data in financial markets, and the integration of information technology and finance, such as data mining, machine learning and deep learning, has deepened, giving rise to the booming field of fintech. As a result, the effectiveness of traditional manual analysis has gradually declined, and the fundamental logic of classical economics and finance has demonstrated that the opportunity for excess returns is often more and more difficult to realise. The opportunity for excess returns is often more difficult to realise. Therefore, the development of investment strategies in the financial market, especially in the securities market, through data mining methods has attracted the attention of academics and industries around the world since the last century. As an emerging economy, China's financial market development has become increasingly attractive to researchers and investors.
In the long run, as China's national power and economic level continue to rise, its multi-layered financial markets are becoming more sophisticated, and the public and institutions are becoming more involved in the financial markets as their incomes grow and their demand for wealth-enhancing investments increases. However, in terms of short-term economic fluctuations, in the past two to three years, due to many unstable factors such as epidemics and wars, economic downward pressure has gradually increased, inflation expectations have risen, and the central bank has stimulated economic growth by lowering interest rates, which inevitably leads to the public transferring funds from banks and the bond market to the stock market due to low interest rates in the hope of obtaining a higher return. In both the short and long term, China's stock market will welcome a large number of investors at a much faster pace. Investors need to understand the risks and returns of the securities they invest in if they are to invest more rationally and avoid the herd effect of "chasing the bulls and killing the losers".
Emerging data mining methods break the constraints of the traditional linear model of econometrics, find the intrinsic relationship between each risk factor and return from a non-linear perspective, and approximate a potential law from a large sample of multi-dimensional financial data, thus helping investors to select individual stocks on a more informed basis and then build an equity investment capable of realising higher excess returns.
In this paper, the decision tree model will be used to screen the characteristic variables suitable for stock selection by combining the variables considered in the fundamental and technical aspects, after which the effectiveness of selecting stocks will be compared between different decision tree algorithms, which is currently lacking in academic research.
2. Literature Research
This paper focuses on applying data mining methods, represented by decision trees, to stock selection and investment portfolios. Conventional linear models that rely on the Capital Asset Pricing Model (CAPM) or the Fama-French three-factor model commonly exhibit poor performance in stock selection, primarily due to their limitations in identifying relevant features. The primary benefit of using the decision tree is its similarity with the human brain in its inherent logic and intuitive nature, thus making it a 'white-box' algorithm [1, 2]. The method of data mining dates to the 1960s and is an application of machine learning to extract the information latent in the explored data. The decision tree algorithm used in this paper was first proposed by Hunt Eael in the conceptual learning system, but there is no clear method for selecting the optimal features. After that, data scientists have made many useful explorations to find the method of selecting the optimal features, J. Ross Quinlan proposed to use "information gain" to select the optimal features in 1986, which formed the "ID3 algorithm", and then he realised the "ID3 algorithm" in 1993. In 1993, Ross Quinlan optimised the ID3 algorithm, i.e. the C4.5 algorithm, which adopts the "information gain ratio" to select the optimal features, and the shortcoming of the ID3 and C4.5 algorithms is that they can only be applied to classification, but not to regression, i.e. the variables to be interpreted are limited to discrete values, and to achieve this goal, they can only be used for classification [3]. In order to make the decision tree realise the application of regression, Leo Breiman used Gini impurity to select the optimal features, and thus proposed the CART (Classification and Regression Tree) algorithm [4]. Nottola and Naim from the perspective of value analysis, collected data through the ML algorithm. Nottola and Naim collected data through the ML algorithm, and then used the decision tree algorithm to train the model from the collected data, and input the fundamental information of randomly selected companies in the same industry, such as financial reports, significant events, organisational structure, etc., into the training model to determine the health of the company's financial status, thus realising the stock selection strategy of fundamental value analysis [5]. CF Tsai and SP Wang combined ANN and decision trees to create a stock price forecasting model and compared the accuracy of this with the ones of single method [6]. Nair B used a decision tree-based de-noised hybrid stock price selection strategy. Nair B used a noisy hybrid stock price prediction system based on decision tree to extract the explanatory variables using technical analysis, and then selected the optimal explanatory variables through the decision tree, and then realised the prediction of stock price through the ANFIS model [7]. Rezaul Karim, Md Khorshed Alam and Md Rezaul Hossain applied linear regression and decision tree regression models to data sets to reveal the predictive accuracy of stock price [8].
3. Data
The data used in this paper are from Wind, and some characteristics of the constituent stocks of the CSI 300 index are selected as the sample dataset. The reason for choosing the CSI 300 is that the index is composed of 300 stocks selected from the largest and most liquid stocks listed on the Shanghai Stock Exchange and the Shenzhen Stock Exchange, which to some extent can best represent the overall situation of the A-share market - in terms of size, the constituents of the CSI 300 index account for about 60% of the total market capitalisation of A-shares; in terms of industry distribution, the constituents of the CSI 300 index account for about 60% of the total market capitalisation of A-shares. In terms of size, the constituents of the CSI 300 Index account for approximately 60% of the total market capitalisation of A-shares; in terms of industry distribution, the constituents of the CSI 300 Index cover all the major industries of the A-share market.
Since this paper combines fundamental analysis and technical analysis, a number of fundamental and technical indicators of the constituent stocks of the CSI 300 Index from 2016 to 2021 are selected as the feature extraction sample set from wind, due to the impact of the new Crown Pneumonia epidemic in 2020, which has increased the impact of the financial data of major companies, resulting in a higher number of outliers in 2020, this paper will select the data from 2016 to 2019 as the training sample set. data from 2016 to 2019 as the training sample set and 2021 data as the test sample set. According to the investment strategy adopted in this paper, seven characteristics under the three factors such as valuation factor, growth factor and profitability factor related to fundamentals and three characteristics under the two factors such as price factor and risk factor related to technical analysis are specifically selected from the database, and the specific stock selection characteristics are demonstrated in Table 1:
Table 1: The Definition of Factors.
Strategy | Factor | Characteristic | Characteristic Explanation |
Fundamental Analysis | Value Factor | PB | Annualized P/B Ratio |
PE | Annualized Price-to-Earnings Ratio | ||
PS | Annualized price-to-sales ratio | ||
Profitability Factor | NP | Net Operating Profit Margin | |
ROE | Return on Equity | ||
Growth Factor | CF% | Year-on-year Growth Rate of Net Cash Flow from Operating Activities per Share | |
NP% | Year-on-year growth rate of net profit | ||
Technical Analysis | Market Factor | TR | Average Daily Turnover Rate |
amplitude | daily average amplitude | ||
Risk Factor | volatility | volatility |
In this paper, stocks are labelled 'long' or 'short' based on their relative gain or loss against the index - if a stock has a positive gain or loss against the CSI 300 index, it should be labelled 'long'; conversely, if the stock has a negative gain or loss against the CSI 300 index, it should be labelled 'short' - thus making stock selection a binary classification problem. If a stock has a positive gain or loss relative to the CSI 300 index, it means that the stock is outperforming the market and should be bought, labelled "long"; conversely, the stock is labelled "short" - thus stock selection becomes a binary classification problem, and due to the restrictions on shorting in the A-share market, it is only necessary to choose a stock that is "long" or "short". Due to the restrictions on short selling in the A-share market, only stocks labelled "long" are selected.
The distribution of stocks in the training set is demonstrated in Figure 1:

Figure 1: The Distribution of Stocks in the Training Set.
The distribution of stocks in the test set is demonstrated in Figure 2:
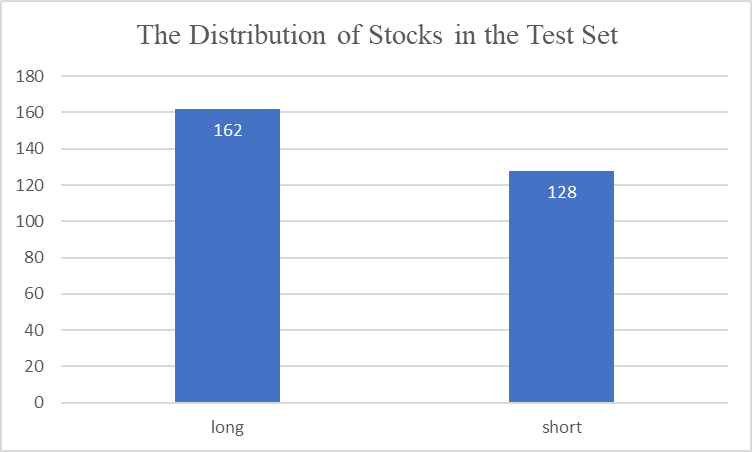
Figure 2: The Distribution of Stocks in the Test Set.
4. Methodology
4.1. Introduction to decision trees
Decision tree model is an algorithm that utilizes a tree structure and is effectively applied in classification as well as regression problems. Its fundamental principle is to summarize data characteristics using induction. In other words, it divides the sample space into several squareshaped intervals based on explanatory variables. Then, by using the mean value of the training samples in the sub-intervals of the explanatory variables, it predicts the estimated value of the samples in the test set. The inductive method used in decision trees is based on the mutually exclusive and complete 'If-Then' rule. This process mirrors the decision-making process of the human brain to a great extent, which makes it highly intuitive and easy to comprehend. As a result, the trained decision tree model is highly interpretable [9].
There are three prominent algorithms commonly used for decision tree modelling: namely, the ID3 algorithm, C4.5 algorithm and CART algorithm. These algorithms differ mainly in the criteria used to select the most suitable features. This is done by using information gain, information gain ratio, and Gini impurity measurements, among others. As both discrete and continuous variables can be handled by the C4.5 algorithm and the CART algorithm, and since the datasets used in this paper exclusively contain continuous variables, the latter two decision tree algorithms will be used for constructing the model and comparing the test outcomes.
Data mining terminology defines the fitted ability of the trained model to predict the sample data in the training set, while the generalization ability refers to the capability of predicting the unknown data. Frequently, a complete decision tree has excellent fitting to known data but inadequate generalization to unknown data, which is referred to as 'overfitting'. To balance the fitting and generalization abilities of the decision tree model, it is necessary to prune the decision tree. Pruning is divided into pre-pruning and post-pruning. In this article, the decision tree will be pruned using the post-pruning method.
4.2. ID3 Algorithm
As the basis of the C4.5 algorithm, we will first introduce the ID3 algorithm. The ID3 algorithm, proposed by J. Ross Quinlan in 1986, is a decision tree algorithm that employs 'information gain' to select the best features. Information gain is computed using Shannon's information entropy. Shannon introduced the concept of entropy from thermodynamics to information theory to quantify the uncertainty of random variables. The degree of uncertainty of a random variable increases as its Shannon entropy increases. The entropy is determined by the distribution of the random variable, and it can be expressed as:
\( H(p)=-\overset{\underset{n}{i=1}}{∑}{p_{i}}{{log_{2}}{{p_{i}}}} \) ⑴
Because it is unfeasible to collect and process all the data, we can only estimate the theoretical Shannon information entropy by using the empirical entropy calculated from the training dataset \( D \) .
Suppose that the original dataset, \( D \) , is divided into \( K \) subsets according to different classifications, but without any additional features. Let the number of samples in each subset be as noted, then \( H(D) \) represents the empirical entropy of the training dataset, and it can be expressed as:
\( H(D)=-\overset{\underset{K}{k=1}}{∑}\frac{|{C_{k}}|}{|D|}{log_{2}}{\frac{|{C_{k}}|}{|D|}} \) ⑵
Suppose the training set can be divided into these n subsets according to different values or intervals of the feature F. Let H(D|F) be the empirical conditional entropy of the training set D with respect to the feature F.
 ⑶
⑶
Define the information gain \( g(D,F) \) as the difference between the empirical entropy \( H(D) \) of the training sample set and the conditional empirical entropy \( H(D|F) \) of the training sample set given the feature \( F \) . Since the information entropy measures the uncertainty of the information, the uncertainty of the information gradually decreases with the addition of new features, and the degree of reduction in the uncertainty of the information brought about by the new features is measured in the ID3 algorithm by the information gain. A feature that is worth adopting should have the property of removing more uncertainty from the information, so the ID3 algorithm determines the optimal feature by selecting the feature with more information gain.
4.3. C4.5 Algorithm
The ID3 algorithm, which selects the optimal features based on the information gain criterion, tends to select features that take more values. This results in the final decision tree model being too fine-grained, increasing the likelihood of overfitting problems. To solve this problem, J. Ross Quinlan, who proposed the ID3 algorithm, implemented an optimisation algorithm, the C4.5 algorithm, in 1993.
Unlike the ID3 algorithm, the C4.5 algorithm uses the information gain ratio to select the optimal features, which emphasises the efficiency of the features in eliminating information uncertainty.
Let be the entropy of the training data set \( D \) with respect to the feature \( F \) :
\( {H_{F}}(D)=-\overset{\underset{n}{i=1}}{∑}\frac{|{D_{i}}|}{|D|}{{log_{2}}}\frac{|{D_{i}}|}{|D|} \) ⑷
The information gain ratio is a penalty term added to the information gain so that sub-trees with more branches can be avoided to some extent, let the information gain ratio of the training data set \( D \) with respect to the feature \( F \) be:
\( {g_{R}}(D,F)=\frac{g(D,F)}{{H_{F}}(D)} \) ⑸
4.4. CART Algorithm
In order to make the tree structure can be realised to solve the regression problem, Leo Breiman proposed to select the most characteristic indicator as the Gini impurity, and based on this created the CART (Classification and Regression Tree) algorithm.
One of the main features of the CART algorithm is that the characteristics take only two values, so its tree structure must be a binary tree model. This means that the CART algorithm represents the complex classification problem as a simple "yes or no" question.
As mentioned above, the criterion for selecting the optimal feature is the ability of a feature to reduce information uncertainty. Unlike the C4.5 algorithm, the CART algorithm measures information uncertainty using the Gini impurity, which is intuitively understood as the expected probability that a sample in the data will be misclassified.
Assuming that the samples are classified into \( K \) categories, the probability that a sample point belongs to category \( K \) is defined as the Gini impurity of the probability distribution:
\( \begin{matrix}Gini(p)=\overset{\underset{K}{k=1}}{∑}{p_{k}}(1-{p_{k}}) \\ =\overset{\underset{K}{k=1}}{∑}({p_{k}}-p_{k}^{2}) \\ =1-\overset{\underset{K}{k=1}}{∑}p_{k}^{2} \\ \end{matrix} \) ⑹
From the formula, Gini impurity is used instead of Shannon's information entropy, so Gini impurity and Shannon's information entropy are very similar in representing the role of information uncertainty.
For a given training data set \( D \) , the samples can be categorised into \( K \) classes, i.e. \( D \) is divided into \( K \) subsets: then the Gini impurity of the training data set is:
\( Gini(D)=1-\overset{\underset{K}{k=1}}{∑}{(\frac{|{C_{k}}|}{|D|})^{2}} \) ⑺
Which can be seen in the known sample data set under the empirical values instead.
Since the decision tree based on the CART algorithm is a binary tree model, in the feature A among the sample data set D is divided into, then the sample data set D on the Gini impurity of feature A is calculated as follows:
\( Gini(D,A)=\frac{|{D_{1}}|}{|D|}Gini({D_{1}})+\frac{|{D_{2}}|}{|D|}Gini({D_{2}}) \) ⑻
By traversing all the features in the training dataset and finding the one with the smallest Gini impurity, the optimal feature is selected, which generates a subtree, and then the above operation is repeated for the subtree until a complete CART decision tree is finally obtained.
4.5. Pruning Method
An ideal decision tree should be characterised by the ability to achieve both a good fit to known data and a good generalisation to unknown data. This requires that the generated decision tree model avoids both underfitting and overfitting problems. Overfitting refers to the situation where the decision tree model fits samples in a given training data set well, but does not fit the unknown data set, which usually occurs when the training model is too complex. Underfitting is the opposite and often occurs when the trained model is too simple.
According to the order of decision tree construction and pruning, pruning can be divided into pre-pruning and post-pruning. In this paper, we will use the post-pruning method: after a complete decision tree has been trained, the internal nodes are examined from the leaf nodes at the bottom up; if the generalisation ability of the decision tree model is improved after the internal nodes are transformed into leaf nodes, pruning is needed; if the generalisation ability of the decision tree does not change after the internal nodes are transformed into leaf nodes, according to Occam's razor principle, the model should be simplified. Therefore, pruning is also necessary.
In this paper, Cost Complexity Pruning will be used to perform a post-pruning operation on the entire decision tree. This pruning method is based on the loss function before and after pruning to determine whether to prune or not - if the decision tree after pruning decreases the loss function, then it needs to be pruned. The loss function is denoted as:
\( \begin{matrix}{C_{α}}(T)=C(T)+α|T| \\ α=\frac{C(t)-C({T_{t}})}{|{T_{t}}|-1} \\ \end{matrix} \) ⑼
\( C(T) \) denotes the cost, Shannon's information entropy in the C4.5 algorithm and Gini impurity in the CART algorithm, a measure of the prediction error on a known sample set, reflecting the fit of the decision tree model.
\( |T| \) is defined as the number of leaf nodes of the subtree ready for pruning, which is intuitively understood as the complexity of the model increases with the number of leaf nodes, so it reflects the generalisation ability of the decision tree model to the unknown data set.
The smallest is selected top-down by a recursive algorithm to determine a sequence of subtrees, and then an optimal subtree can be selected from this sequence of subtrees using cross-validation to complete the pruning [10].
4.6. Model Evaluation
In this paper, the effectiveness of decision tree model is evaluated through the confusion matrix. The confusion matrix for the decision tree model is demonstrated in Table 2:
Table 2: The Confusion Matrix for the Decision Tree.
Predicted Value | |||
Positive | Negative | ||
Real Value | Positive | TP | FN |
Negative | FP | TN | |
The following metrics are available to measure the effectiveness of the decision tree model:
\( accuracy=\frac{TP}{TP+FP} \) ⑽
\( recall ratio=\frac{TP}{TP+FN} \) ⑾
5. Empirical Analysis
5.1. Construct decision trees for stock selection
In this paper, it is assumed that the stability between stock categories and stock selection characteristics is maintained in the long run without exogenous variable shocks leading to stock market heterogeneity. The stock data of CSI 300 constituents from 2016 to 2019 is used as the training set, and after the complete decision tree is trained using C4.5 algorithm and CART algorithm, respectively, the cost complexity method is used to perform a post-pruning operation on the original decision tree. The complete decision tree trained using the C4.5 algorithm is demonstrated in Figure 3:

Figure 3: The Decision Tree of C4.5 Algorithm.
The complete C4.5 decision tree has a total of 13 leaf nodes with a depth of 6 layers, and the cost complexity is reduced from 0.294931 to 0.023041 by pruning, and the pruned decision tree is demonstrated in Figure 4:

Figure 4: The Pruned Decision Tree of C4.5 Algorithm.
The confusion matrix of the pruned C4.5 decision tree is demonstrated in Table 3:
Table 3: The Confusion Matrix for the C4.5 Decision Tree.
Predicted Value | |||
Positive | Negative | ||
Real Value | Positive | 136 | 26 |
Negative | 76 | 52 | |
This can be obtained by calculation:
\( accuracy=\frac{136}{136+76}≈64.15\% \) ⑿
\( recall ratio=\frac{136}{136+26}≈83.95\% \) ⒀
The decision tree model trained using the CART algorithm is demonstrated in Figure 5:
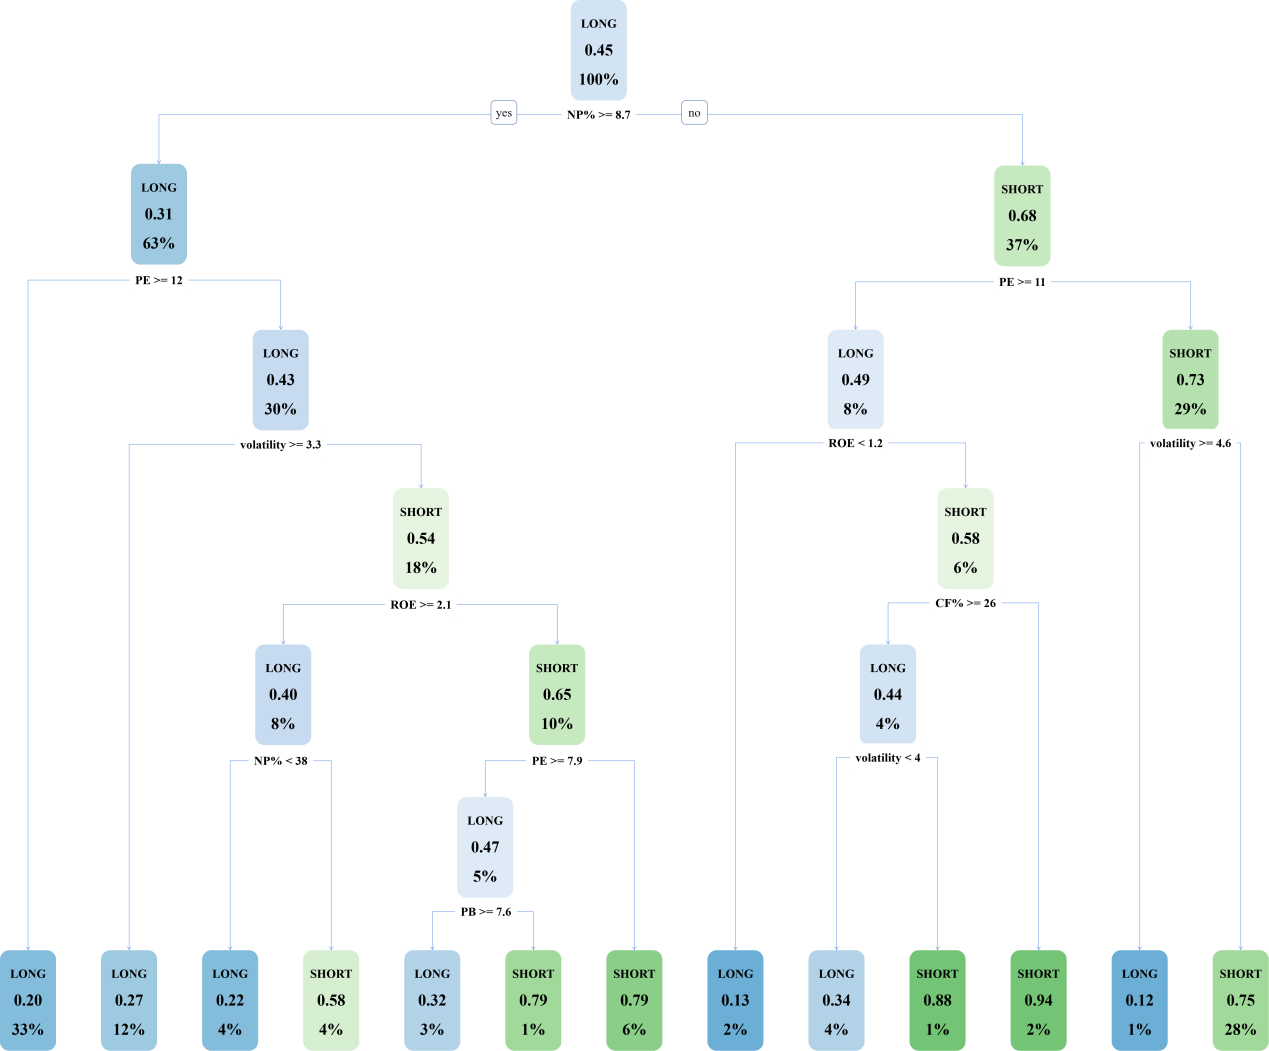
Figure 5: The Decision Tree of CART Algorithm.
The full CART decision tree has a total of 13 leaf nodes with a depth of 6. After pruning, it is found that the newly generated decision tree model has only one feature (as demonstrated in Figure 6), indicating that there is an underfitting problem, so pruning must be abandoned.
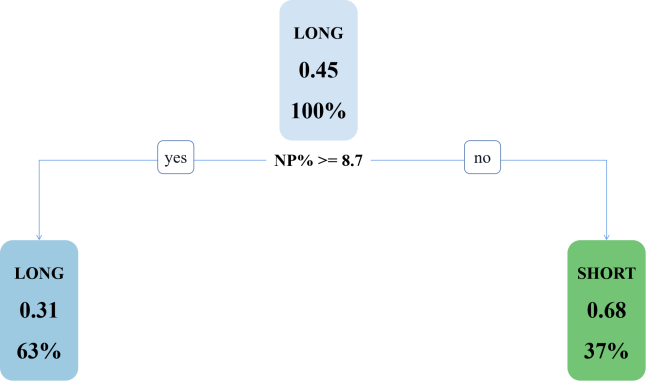
Figure 6: The Pruned Decision Tree of CART Algorithm.
The confusion matrix for the CART decision tree is demonstrated in Table 4:
Table 4: The Confusion Matrix for the CART Decision Tree.
Predicted Value | |||
Positive | Negative | ||
Real Value | Positive | 142 | 20 |
Negative | 86 | 42 | |
This can be obtained by calculation:
\( accuracy=\frac{142}{142+86}≈62.28\% \) ⒁
\( recall ratio=\frac{142}{142+20}≈87.65\% \) ⒂
Comparison from the evaluation index of the model effectiveness: from the precision, the decision tree generated by the C4.5 algorithm has; from the recall, the decision tree generated by the CART algorithm performs better. However, from the cost complexity of the model, this paper finally selected the decision tree generated by the simpler structure of the C4.5 algorithm for stock selection.
5.2. Construct a Stock Portfolio
According to the above decision tree model, the 2021 dataset can be used to select stocks labelled "more" with higher returns than the index, and the weights of each stock's market capitalisation to the total market capitalisation of the index can be used to construct a portfolio of stocks, and the returns of the portfolio generated based on the decision tree can be calculated by weighted summation to outperform the returns of the CSI 300 Index by approximately 13.4% in one year. 300 Index by 13.4% over one year
Part of the stocks in the portfolio and their weightings are demonstrated in Table 5:
Table 5: Part of the Stocks in the Portfolio.
Stock Code | Weight |
688981.SH | 0.005550167 |
688599.SH | 0.002838554 |
688396.SH | 0.00232921 |
688363.SH | 0.002285779 |
688169.SH | 0.001210016 |
688126.SH | 0.001821688 |
688111.SH | 0.003347177 |
688036.SH | 0.002896854 |
688012.SH | 0.002397317 |
603993.SH | 0.003141732 |
603986.SH | 0.002473649 |
603939.SH | 0.000959309 |
603899.SH | 0.001616258 |
603882.SH | 0.001217768 |
603833.SH | 0.00204299 |
603806.SH | 0.003090635 |
603799.SH | 0.003232111 |
603659.SH | 0.003061002 |
603658.SH | 0.000800806 |
6. Conclusion
This paper combines fundamental analysis and technical analysis to play the advantages of both in stock selection, respectively, selected on behalf of the valuation factor, growth factor, profitability factor, market factor and the risk factor of the 10 features, through the training of the decision tree based stock selection model, in its pruning, the main features are the year-on-year growth rate of net profit, price-earnings ratio, volatility and return on net assets, basically covering the scope of the preset stock selection factors in this paper. C4.5 algorithm and CART algorithm respectively form the decision tree in the effectiveness of advantages and disadvantages, but in this case, C4.5 algorithm trained decision tree is more concise, which also means that the generalisation ability is stronger. The long portfolio consisting of long stocks classified by the decision tree model has a more impressive return compared to the CSI 300 index, which concludes that the portfolio model based on the data mining method represented by the decision tree is more effective.
However, the model in this paper still has many limitations, although it does produce some results. The selection of factors may not have been fully considered, resulting in the absence of some features, which means that the fitting ability is not particularly good. The stock positions in this paper are constant for one year, which is not in line with the habits of the vast majority of individual investors, and the model is expected to be able to make the position habits more diversified in the future.
References
[1]. Huang, C. J., Yang, D. X., Chuang, Y. T. (2008) Application of wrapper approach and composite classifier to the stock trend prediction. Expert Systems with Applications, 34(4): 2870-2878.
[2]. Basak, S., Kar, S., Saha, S., Khaidem, L., Dey, S. R. (2019) Predicting the direction of stock market prices using tree-based classifiers. The North American Journal of Economics and Finance, 47: 552-567.
[3]. Quinlan, J. R. (1992) C4. 5: programs for machine learning. Morgan Kaufmann, San Mateo, CA.
[4]. Breiman, L. (2017) Classification and regression trees. Routledge, New York.
[5]. Nottola, C., Condamin, L., & Naim, P. (1991, November). On the use of hard neural networks for symbolic learning application to company evaluation. In: [Proceedings] 1991 IEEE International Joint Conference on Neural Networks. Singapore. pp. 509-522.
[6]. Tsai, C. F., Wang, S. P. (2009) Stock price forecasting by hybrid machine learning techniques. In: Proceedings of the international multiconference of engineers and computer scientists. Hong Kong. Vol. 1, No. 755, pp. 60.
[7]. Nair, B. B., Dharini, N. M., Mohandas, V. P. (2010) A stock market trend prediction system using a hybrid decision tree-neuro-fuzzy system. In: 2010 international conference on advances in recent technologies in communication and computing. Kottayam. pp. 381-385.
[8]. Karim, R., Alam, M. K., Hossain, M. R. (2021) Stock market analysis using linear regression and decision tree regression. In: 2021 1st International Conference on Emerging Smart Technologies and Applications (eSmarTA). Sana'a. pp. 1-6.
[9]. Wu, M. C., Lin, S. Y., & Lin, C. H. (2006). An effective application of decision tree to stock trading. Expert Systems with applications, 31(2): 270-274.
[10]. Chen, M. Y. (2011) Predicting corporate financial distress based on integration of decision tree classification and logistic regression. Expert systems with applications, 38(9): 11261-11272.
Cite this article
Wang,Y. (2024). A Comparative Study of Stock Selection Models Based on Decision Tree Algorithms. Advances in Economics, Management and Political Sciences,82,182-194.
Data availability
The datasets used and/or analyzed during the current study will be available from the authors upon reasonable request.
Disclaimer/Publisher's Note
The statements, opinions and data contained in all publications are solely those of the individual author(s) and contributor(s) and not of EWA Publishing and/or the editor(s). EWA Publishing and/or the editor(s) disclaim responsibility for any injury to people or property resulting from any ideas, methods, instructions or products referred to in the content.
About volume
Volume title: Proceedings of the 2nd International Conference on Financial Technology and Business Analysis
© 2024 by the author(s). Licensee EWA Publishing, Oxford, UK. This article is an open access article distributed under the terms and
conditions of the Creative Commons Attribution (CC BY) license. Authors who
publish this series agree to the following terms:
1. Authors retain copyright and grant the series right of first publication with the work simultaneously licensed under a Creative Commons
Attribution License that allows others to share the work with an acknowledgment of the work's authorship and initial publication in this
series.
2. Authors are able to enter into separate, additional contractual arrangements for the non-exclusive distribution of the series's published
version of the work (e.g., post it to an institutional repository or publish it in a book), with an acknowledgment of its initial
publication in this series.
3. Authors are permitted and encouraged to post their work online (e.g., in institutional repositories or on their website) prior to and
during the submission process, as it can lead to productive exchanges, as well as earlier and greater citation of published work (See
Open access policy for details).
References
[1]. Huang, C. J., Yang, D. X., Chuang, Y. T. (2008) Application of wrapper approach and composite classifier to the stock trend prediction. Expert Systems with Applications, 34(4): 2870-2878.
[2]. Basak, S., Kar, S., Saha, S., Khaidem, L., Dey, S. R. (2019) Predicting the direction of stock market prices using tree-based classifiers. The North American Journal of Economics and Finance, 47: 552-567.
[3]. Quinlan, J. R. (1992) C4. 5: programs for machine learning. Morgan Kaufmann, San Mateo, CA.
[4]. Breiman, L. (2017) Classification and regression trees. Routledge, New York.
[5]. Nottola, C., Condamin, L., & Naim, P. (1991, November). On the use of hard neural networks for symbolic learning application to company evaluation. In: [Proceedings] 1991 IEEE International Joint Conference on Neural Networks. Singapore. pp. 509-522.
[6]. Tsai, C. F., Wang, S. P. (2009) Stock price forecasting by hybrid machine learning techniques. In: Proceedings of the international multiconference of engineers and computer scientists. Hong Kong. Vol. 1, No. 755, pp. 60.
[7]. Nair, B. B., Dharini, N. M., Mohandas, V. P. (2010) A stock market trend prediction system using a hybrid decision tree-neuro-fuzzy system. In: 2010 international conference on advances in recent technologies in communication and computing. Kottayam. pp. 381-385.
[8]. Karim, R., Alam, M. K., Hossain, M. R. (2021) Stock market analysis using linear regression and decision tree regression. In: 2021 1st International Conference on Emerging Smart Technologies and Applications (eSmarTA). Sana'a. pp. 1-6.
[9]. Wu, M. C., Lin, S. Y., & Lin, C. H. (2006). An effective application of decision tree to stock trading. Expert Systems with applications, 31(2): 270-274.
[10]. Chen, M. Y. (2011) Predicting corporate financial distress based on integration of decision tree classification and logistic regression. Expert systems with applications, 38(9): 11261-11272.