


1. Introduction
1.1. Research Background and Motivation
In recent years, the banking sector in the A-share market has generally exhibited a cyclical downward trend due to its close linkage with macroeconomic indicators [1]. For instance, the sector experienced a decline during the recent epidemic-induced macroeconomic downturn [2]. To examine this phenomenon from a micro perspective, this paper will analyze the predictability and patterns of the individual stock 'Shanghai Pudong Development Bank' and its correlation with the banking sector [3].
1.2. Literature Review
Currently, some studies focus on the individual behavior of Shanghai Pudong Development Bank stock in the stock market [4]. Other studies suggest ways to improve stock behavior based on prior research, which is crucial for interpreting market behavior [5]. Besides that, studies also focus on the correlation between region and economics [6]. Moreover, several studies choose to emphasizes the role of China’s microeconomic characteristics in stock market [7]. Additionally, a few studies investigate the relationship between macroeconomic indicators and stocks [8]. As it is important to note that the previous study did not analyze the stock in relation to the market, this paper will discuss in depth the relationship between Shanghai Pudong Development Bank and the banking sector, based on a previous review of the individual stock.
1.3. Research Contents
This paper is divided into three parts to study the pattern of Shanghai Pudong Development Bank and its correlation with the banking sector. No changes in content have been made. The first part will focus on the stock forecasting methodology, specifically the autoregressive integrated moving average model, and its accuracy will be tested. The second part will analyze the pattern obtained from the accuracy and parameters of the model and test it against real-world situations. The final part will draw conclusions based on the findings. Last, the correlation between the closing price movement and the overall movement of the banking sector will be derived through comparison. The key part of the model will be the prediction, which needs to be fitted and tested.
2. Methodology
2.1. ARIMA
The AutoRegressive Integrated Moving Average (ARIMA) model is a powerful tool for predicting stock prices. Through seeking the closing prices of stocks as time series, it forecasts future values by combining the autoregressive components (AR), differencing (I), and moving average components (MA): AR is a model that shows a changing variable that regresses on its own lagged, or prior, values; I represents the differencing of raw observations to allow the time series to become stationary; and MA incorporates the dependency between an observation and a residual error from a moving average model applied to lagged observations [9]. Furthermore, the model is defined by three key parameters from the components: autoregressive order (p), integrated order (d), and moving average order (q).
2.2. Data Selection and Processing
The project aims for seeking the pattern of the financial sector of the Chinese market that focuses on banks through the application of ARIMA model in the stock “Shanghai Pudong Developing Bank” (symbol 600000).
The ARIMA model analysis focuses on Shanghai Pudong Developing Bank, with the primary goal of forecasting its future stock prices by examining the patterns and trends in the historical data. The analysis considers various data indicators, including open, high, low, and close prices, as well as trading volumes, and time-related indicators, such as dates or timestamps.
Through observing selected indicators, summarizing the stock's behavior, including open, high, low, and close prices, as well as trading volumes that offer a glimpse into market activity and liquidity associated with the stock, and using time-related indicators, such as dates or timestamps, this enables the identification of globular trends and patterns of the financial market over different time intervals.
After collecting the data, the processing phase begins [10]. The focus is on handling any missing or inconsistent data points using methods such as imputation or removal. The date column is converted to a datetime format to facilitate time series analysis. Visualization techniques are then applied to explore the data visually, aiding in the identification of trends, seasonality, and potential outliers. This exploratory phase provides valuable insights into the historical behavior of the stock and sets the stage for subsequent modeling steps (see figure 1).
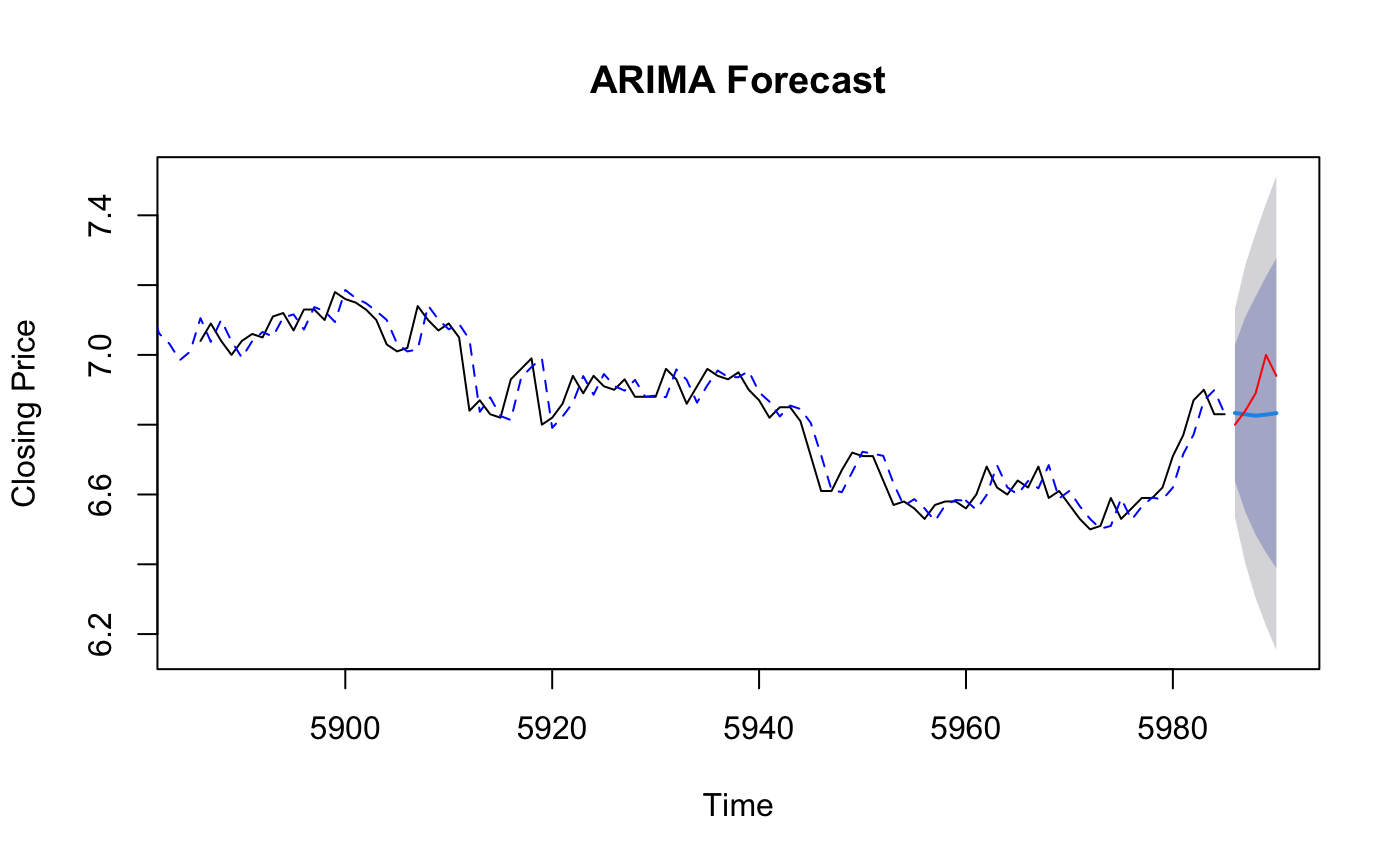
Figure 1: ARIMA Forecast of Shanghai Pudong Development Bank over 5 days
2.3. ADF test
To improve the accuracy of the ARIMA model, it is crucial to ensure that the time series data is stationary, which means that the statistical properties of the data, such as mean and variance, remain constant over time. To ensure the stationarity, differencing is necessary until there is no significant variation. This article uses Augmented Dickey-Fuller (ADF) to test the stationarity of the sequence, and the test results are shown in Table 1.
Table 1: Augmented Dickey-Fuller Test
data: | Closing price – Shanghai Pudong Development Bank |
Dickey-Fuller | -1.8326 |
Lag order | 18 |
p-value | 0.6493 |
alternative hypothesis | Non-stationary |
The Augmented Dickey-Fuller Test (ADF Test) shows that ARIMA with order (2,1,3) is stationary. The p-value (0.6493) is greater than the significant level (0.05) and the Dickey-Fuller statistics are negative, which not rejects the null hypothesis for the entire time series.
Based on this, this article applies first-order differencing to the original sequence and performs ADF test on the differenced sequence. The test results show that the sequence after first-order differencing is stationary.
3. Empirical Results Analysis
3.1. ARIMA Estimate Results
Once the data is processed and prepared, it is divided into training and testing sets. The training set is used to fit the ARIMA model, while the testing set is used to evaluate the model's predictive performance. Selecting appropriate values for the autoregressive order (p), integrated order (d), and moving average order (q) is crucial for model fitting. Statistical methods, such as the Akaike Information Criterion (AIC) or the Bayesian Information Criterion (BIC), guide this selection by identifying the most suitable model based on goodness of fit and complexity. The results of AIC and BIC are shown in table 2.
Table 2: Statistical Criterions
AIC | -5416.67 |
AICc | -5416.66 |
BIC | -5376.56 |
Through this, it can be simply seen through the autocorrelation function (ACF) and partial autocorrelation function (PACF) that the model choses the model ARIMA (2, 1, 3). The historical stock prices were fitted with the ARIMA (2,1,3) model, and the model's estimated coefficients are as shown in table 3.
Table 3: ARIMA fitted parameters
AR (1) | AR (2) | MA (1) | MA (2) | MA (3) | |
Coefficients: | 0.1439 | -0.9593 | -0.1199 | 0.9404 | 0.0364 |
s.e. | 0.0173 | 0.0480 | 0.0217 | 0.0550 | 0.0158 |
3.2. Prediction Results Based on ARIMA Model
After fitting the initial model, evaluate its predictive accuracy on the testing set. The evaluation compares the model's predictions with the actual stock prices from the testing set. If the model's performance is unsatisfactory, adjustments to the parameter values are made, and the modeling process is iteratively refined until a suitable model is achieved.
It is important to note that the ARIMA model is a valuable tool for time series forecasting, but it has limitations. Shanghai Pudong Developing Bank prices can be influenced by various factors, such as economic conditions, market sentiment, and unforeseen events. Therefore, it is important to approach predictions with caution as past performance does not guarantee future results.
Table 4: Training set error measures
ME | RMSE | MAE | MPE | MAPE | MASE | ACF1 |
0.000615 | 0.152955 | 0.089239 | -0.007605 | 1.340502 | 1.002359 | -0.000102 |
To determine the model with high accuracy, we conducted an examination of various error metrics. The model shows a mean error (ME) close to zero, indicating a minor average deviation between predicted and actual values. Additionally, both the root mean squared error (RMSE) and mean absolute error (MAE) are relatively small, signifying accurate forecasts with a limited average magnitude of errors. Although the mean absolute percentage error (MAPE) is approximately 1.34%, indicating a modest average percentage discrepancy, the mean percentage error (MPE) is negligible, suggesting a minimal average percentage deviation from actual values. The model's accuracy is supported by a mean absolute scaled error (MASE) close to 1, implying performance similar to a naïve forecast. Furthermore, the autocorrelation of forecast errors at lag 1 (ACF1) is insignificant, indicating no significant correlation between consecutive forecast errors. Additionally, there is minimal autocorrelation in forecast errors. Taken together, these error measures from the training set indicate that the model generates precise and unbiased forecasts, as evidenced by its performance that is close to ideal when compared to a naïve forecast. However, it is necessary to validate the model's generalizability beyond the training data by conducting further validation on an independent test set.
The error measures on the training set indicate a small mean error, low RMSE, and MAE, suggesting that the model performs well on the training data. However, it is important to evaluate the model's predictive accuracy on out-of-sample data.
To do so, the author compare the forecasts provided by the model with the actual stock prices for the test set. We present the point forecast, along with 80% and 95% prediction intervals, for multiple time points, as well as the actual stock prices for comparison (see table 5).
Table 5: Forecast Range
Point Forecast | Lower 80% | Higher 80% | Lower 95% | Higher 95% | |
2023/11/02 | 6.823526 | 6.627407 | 7.019646 | 6.523588 | 7.123465 |
2023/11/03 | 6.825400 | 6.544703 | 7.106097 | 6.396111 | 7.254688 |
2023/11/04 | 6.823345 | 6.479963 | 7.166727 | 6.298187 | 7.348502 |
2023/11/05 | 6.821251 | 6.423891 | 7.218612 | 6.213541 | 7.428962 |
… | … | … | … | … | … |
2024/02/05 | 6.823248 | 5.194417 | 8.452079 | 4.332166 | 9.314330 |
2024/02/06 | 6.822721 | 5.181599 | 8.463843 | 4.312842 | 9.332601 |
2024/02/07 | 6.823226 | 5.169803 | 8.476649 | 4.294534 | 9.351918 |
2024/02/08 | 6.823805 | 5.158234 | 8.489375 | 4.276535 | 9.371075 |
This analysis allows the assessment of the accuracy of the model's forecasts. The point forecasts align with the observed stock prices, indicating that the model captures the underlying patterns in the data. However, the prediction intervals provide a range of potential outcomes, acknowledging the inherent uncertainty in stock price forecasting.
It is important to note that while the ARIMA model provides a valuable tool for time series forecasting, it has limitations. Stock prices can be influenced by a variety of factors, such as market sentiment, economic conditions, and unexpected events. These external factors may not be fully captured by historical data, which can introduce uncertainties into the model's predictions.
In conclusion, the ARIMA (2,1,3) model performs well on the training set, and its forecasts align reasonably well with the actual stock prices in the test set. However, it is important for investors and analysts to exercise caution when relying solely on quantitative models. External factors and unforeseen events can impact stock prices, and predictions should be supplemented with qualitative insights and a broader understanding of the market and economic landscape. Investors should consider the outputs of the ARIMA model as a valuable input into their decision-making process rather than a definitive forecast. Thorough research and professional advice are recommended before making any investment decisions based on predictive models.
4. Discussion
The AutoRegressive Integrated Moving Average (ARIMA) model's interpretation provides valuable insights into its applicability for time series analysis. The ARIMA model is a robust tool for forecasting, especially in capturing linear trends and seasonality. However, it has limitations when dealing with non-linear trends and complex patterns. It is also sensitive to outliers and requires stationary data. To improve its applicability, it is important to consider these factors. This analysis highlights the importance of a nuanced approach, taking into account alternative models for situations where the limitations of ARIMA may impede accurate predictions.
The analysis reveals a strong correlation between the stock of Shanghai Pudong Development Bank and the broader banking sector in A share, highlighting the interconnected nature of individual stock performance with the sector. The analysis reveals a strong correlation between the stock of Shanghai Pudong Development Bank and the broader banking sector in A share, highlighting the interconnected nature of individual stock performance with the sector. It is important to consider macroeconomic factors when evaluating stock performance. Economic policies, market sentiment, and global financial trends have a significant impact on the performance of individual stocks and the banking sector as a whole. It is crucial for investors and policymakers to comprehend and navigate these intricate relationships.
5. Conclusion
In conclusion, this thorough analysis provides valuable insights into the capabilities and limitations of the ARIMA model, emphasizing the need for a balanced consideration of alternative forecasting methods. Furthermore, the study highlights a robust correlation between the stock of Shanghai Pudong Development Bank and the banking sector in A shares, underscoring the interconnectedness of individual stock performance with the overall sector dynamics. As financial markets continue to evolve, this study emphasizes the importance of adapting analytical approaches to navigate the complexities of the dynamic economic landscape. The observed strong correlation highlights the need for a comprehensive understanding of both micro and macroeconomic factors to make informed decisions in the financial domain.
References
[1]. Borja, B., & Ventura, M. (2021). Chapter 1: AutoRegressive Integrated Moving Average (ARIMA) — Time Series Analysis Handbook. Github.io.
[2]. Brandt, L., & Zhu, X. (2007). 2. China’s Banking Sector and Economic Growth. China’s Financial Transition at a Crossroads, 86–143.
[3]. Flush Finance. (2024). Flush Finance. 10jqka.com.cn. Retrieved from https://q.10jqka.com.cn/thshy/detail/code/881155/
[4]. Fu, X. (Maggie), & Heffernan, S. (2008). Economies of scale and scope in China’s banking sector. Applied Financial Economics, 18(5), 345–356.
[5]. Huang, W.-Q., Zhuang, X.-T., & Yao, S. (2009). A network analysis of the Chinese stock market. Physical A: Statistical Mechanics and Its Applications, 388(14), 2956–2964.
[6]. Li, F. (2020). Internal Control of Commercial Banks—Based on Case Study of Shanghai Pudong Development Bank. Modern Economy, 11(02), 230–238.
[7]. Tang, Z. (2019). A Study on Innovative Development of Investment Banking from Risks Perspective based on the Research of Shanghai Pudong Development Bank (SPD). Proceedings of the 2018 International Symposium on Social Science and Management Innovation (SSMI 2018).
[8]. Wu, K. (2019). Impact Analysis of Macroeconomic Factors on Stock Value of Shanghai Pudong Development Bank under PCA Regression. Economic Management Journal, 9(2).
[9]. Wu, V. (1998). The Pudong Development Zone and China’s economic reforms. Planning Perspectives, 13(2), 133–165.
[10]. Xu, C. K. (2000). The microstructure of the Chinese stock market. China Economic Review, 11(1), 79–97.
Cite this article
Huang,Y. (2024). Analysis of China's Banking Market: Based on ARIMA Model. Advances in Economics, Management and Political Sciences,88,131-136.
Data availability
The datasets used and/or analyzed during the current study will be available from the authors upon reasonable request.
Disclaimer/Publisher's Note
The statements, opinions and data contained in all publications are solely those of the individual author(s) and contributor(s) and not of EWA Publishing and/or the editor(s). EWA Publishing and/or the editor(s) disclaim responsibility for any injury to people or property resulting from any ideas, methods, instructions or products referred to in the content.
About volume
Volume title: Proceedings of the 2nd International Conference on Management Research and Economic Development
© 2024 by the author(s). Licensee EWA Publishing, Oxford, UK. This article is an open access article distributed under the terms and
conditions of the Creative Commons Attribution (CC BY) license. Authors who
publish this series agree to the following terms:
1. Authors retain copyright and grant the series right of first publication with the work simultaneously licensed under a Creative Commons
Attribution License that allows others to share the work with an acknowledgment of the work's authorship and initial publication in this
series.
2. Authors are able to enter into separate, additional contractual arrangements for the non-exclusive distribution of the series's published
version of the work (e.g., post it to an institutional repository or publish it in a book), with an acknowledgment of its initial
publication in this series.
3. Authors are permitted and encouraged to post their work online (e.g., in institutional repositories or on their website) prior to and
during the submission process, as it can lead to productive exchanges, as well as earlier and greater citation of published work (See
Open access policy for details).
References
[1]. Borja, B., & Ventura, M. (2021). Chapter 1: AutoRegressive Integrated Moving Average (ARIMA) — Time Series Analysis Handbook. Github.io.
[2]. Brandt, L., & Zhu, X. (2007). 2. China’s Banking Sector and Economic Growth. China’s Financial Transition at a Crossroads, 86–143.
[3]. Flush Finance. (2024). Flush Finance. 10jqka.com.cn. Retrieved from https://q.10jqka.com.cn/thshy/detail/code/881155/
[4]. Fu, X. (Maggie), & Heffernan, S. (2008). Economies of scale and scope in China’s banking sector. Applied Financial Economics, 18(5), 345–356.
[5]. Huang, W.-Q., Zhuang, X.-T., & Yao, S. (2009). A network analysis of the Chinese stock market. Physical A: Statistical Mechanics and Its Applications, 388(14), 2956–2964.
[6]. Li, F. (2020). Internal Control of Commercial Banks—Based on Case Study of Shanghai Pudong Development Bank. Modern Economy, 11(02), 230–238.
[7]. Tang, Z. (2019). A Study on Innovative Development of Investment Banking from Risks Perspective based on the Research of Shanghai Pudong Development Bank (SPD). Proceedings of the 2018 International Symposium on Social Science and Management Innovation (SSMI 2018).
[8]. Wu, K. (2019). Impact Analysis of Macroeconomic Factors on Stock Value of Shanghai Pudong Development Bank under PCA Regression. Economic Management Journal, 9(2).
[9]. Wu, V. (1998). The Pudong Development Zone and China’s economic reforms. Planning Perspectives, 13(2), 133–165.
[10]. Xu, C. K. (2000). The microstructure of the Chinese stock market. China Economic Review, 11(1), 79–97.