


1. Introduction
The stock market, as a core component of the global financial system, has undergone a long and rich history. The origins of the stock market can be traced back to the establishment of the Amsterdam Stock Exchange in the 17th century. Subsequently, other major exchanges such as the London Stock Exchange emerged, laying the foundation for global stock markets. In the early 20th century, with the advancement of the industrial revolution, the stock market rapidly developed into a primary platform for corporate financing and investment. With the development of the times, enterprise investment has experienced turbulence and crisis, but at the same time, it is also accelerating the integration and development of the international stock market, like the 1994 Mexican and 1997 South Asian crises [1]. The globalization wave of the 1980s and 1990s further accelerated this process. Today, global stock markets have become a cornerstone of the global financial system, providing companies with financing channels and offering investors diverse investment choices.
One of the characteristics of modern global stock markets is their high degree of interconnectivity. Through electronic trading systems, investors can swiftly trade stocks worldwide, making the market more liquid and efficient. The increasing interconnectedness between stock markets worldwide has become a prominent feature of the global stock market, with international capital flows playing a crucial role. However, global stock markets also face a range of challenges, including market volatility, financial crises, and continuously changing regulatory environments like COVID-19, an extreme periods holds significant practical implications for assessing investor sentiment [2]. With technological advancements, emerging technologies such as virtual currencies and blockchain are gradually influencing the landscape of stock markets.
In this diversified and complex environment, the future development of global stock markets remains uncertain. Nevertheless, as a vital engine for economic growth and a primary avenue for corporate financing, stock markets will continue to play a crucial role in the global financial system. Stock price prediction is a crucial task in the financial domain, aiming to forecast future market trends by analyzing various factors. Numerous factors influence stock prices, including market supply and demand, company financial performance, macroeconomic indicators, market sentiment, regulatory policies, commodity and more. Russia dropping oil prices have also affected the markets, make commodity affects stock prices [3]. Machine learning provides a powerful tool for stock price prediction. Common methods include regression analysis, time series analysis, and deep learning. Regression models can capture the relationship between specific factors and stock prices, while time series analysis helps identify trends and periodicity. Deep learning models, such as RNN and LSTM, handle complex nonlinear relationships. Different ML models have their own advantages in stock price prediction. For instance, the ANN and SVM are two algorithms that are widely used [4], Due to ANNs flexibility and multi-layered structure, they are applicable to diverse tasks. SVM demonstrates significant classification performance in high-dimensional spaces, making it suitable for dealing with data with complex boundaries. Random Forest is advantageous for dealing with nonlinear relationships. Various methods of Machine Learning all the aforementioned are utilized to more accurately forecast stock price [5]. Deep learning models generally outperform others in learning complex patterns but require more data and computational resources.
This paper aims to summarize and analyze the existing research on the application of Neural Networks for stock market prediction. It covers a range of NN architectures, including CNN, LSTM, and ANN. The paper also highlights the different approaches used in data preprocessing, model training, and evaluation. The review highlights the strengths and weaknesses of each NN architecture, as well as their relative performance in stock market prediction tasks. It also discusses the challenges and limitations encountered in this domain, such as data noise, overfitting, and the impact of market dynamics on prediction accuracy. By providing a comprehensive overview of the current state of the art in NN-based stock market prediction, this paper aims to inform future research and guide practitioners in their choice of appropriate models and methods. The primary goal is to review pertinent literature about neural network techniques to stock market prediction. To accomplish this, a systematic literature review (SLR) was conducted for this study. This SLR's study questions are basic Neural Network Descriptions and three NN models that are frequently utilized for stock market prediction. By offering a set of data and domain knowledge that can assist future researchers in broadening their research and creating a novel machine learning strategy using neural networks for stock market prediction, it is expected that this paper can further the field of stock market prediction. The rest structure of the paper is as follows. Section 2 is a basic description; and Section 3 through Section 5 explain the methodology utilized for this work. Section 6 contains the discussion and responses to the research questions; Section 7 is the conclusion.
2. Basic Descriptions of Neural Network
Every neuron doubles the value of its initial input by a predetermined weight. A sum is computed by adding additional input values to the neuron and merging other information values. This sum is then corrected for neuron bias. Finally, an excitation function is used to normalize the output value. Neural networks are essentially linked layer by layer by various processing units. As processing units, neurons are able to process and categorize data as output. The popularity of neural network models is the Multilayer Perceptron layer (MLP). MLP is a feedforward neural network with one or more hidden layers that can learn and adapt to complex nonlinear relational structures. Therefore, he excels in modeling financial data in the stock market. For instance, one study uses a sample of 179 stocks from the HOSE, produces MLP findings, and the model with five hidden layers yields the best result of 0.0268, as shown in Table 1 [6].
Another widely used neural network is Repetitive Neural Network (RNN). RNN has the advantage of repeated connections and can effectively process time series data. Considering the temporal nature of stock market data, stock prices and trading volumes exhibit systematic characteristics, and RNN can proficiently capture these temporal relationships, performing well in predicting future trends and generating trading signals. To address some of the drawbacks of short-term and long-term RNN memory networks (LSTM), it is a display. According to the research of Yadav et al. In 2020, the state stability of the LSTM model has improved, so it is recommended to apply it to time series prediction. In addition, the results indicate that the hidden layer of the model achieved the optimal RMSE [7]. The CNN, widely applied in image recognition, has also found some applications in the stock market. Despite its primary design for image processing, CNN is utilized for pattern recognition and feature extraction in the stock market. Through operations in convolutional layers, CNN efficiently captures graphical patterns, providing support for prediction and decision-making. Applying these neural networks to predict stock prices, generate trading signals, and manage risks. However, it is worth noting that the inherent complexity and uncertainty of the stock market require a cautious approach when applying neural network models. Challenges such as overuse, data noise, and future data leakage risks must be addressed. Therefore, the effectiveness of using neural network models requires a deep understanding of the theory and strict and appropriate validation of strategic risk monitoring.
Table 1: Results of MLP for HOSE [6].
Neurons in hidden layers | Epochs | Min.MSE |
32 | 7 | 0.0367 |
64 | 12 | 0.0332 |
128,64,32,8 | 12 | 0.0303 |
128,64,32,16,8 | 12 | 0.0268 |
128,64,32,16,8 | 20 | 0.0271 |
3. CNN
Convolutional Neural Networks (CNNs) provide an advanced method for leveraging the temporal patterns in financial data for stock price prediction. The first step of the procedure is gathering historical stock prices and pertinent indicators, which are then standardized to make training easier. Sequences including a window of historical price movements and other financial variables make up the data structure. These temporal dependencies are captured by the architecture of the CNN model. The sequence data is received by an input layer, which is succeeded by several convolutional layers. In order to detect local patterns and features, including price oscillations or volume spikes, these layers use a series of learnable filters that slide across the input sequence. By extracting these features, the convolution technique turns the raw data into a more abstract representation. Between the convolutional layers are pooling layers that control the amount of computation and avoid overfitting. They aggregate the data from the feature maps produced by the convolutional layers and execute a downsampling operation, keeping the most important patterns and removing the noise. The data is flattened and then sent through fully connected layers following feature extraction, which combine the high-level information to provide predictions. For regression tasks, the last layer usually consists of a single neuron that predicts the future stock price. Backpropagation throughout the network is used during CNN training in order to maximize connection weights. The loss function, which is commonly represented as mean squared error in regression issues, measures the variation between the actual and forecast stock prices and directs the model to reduce this difference. Next, a different validation dataset is used to test the model's generalization ability and suitability for practical use. Mathematically, CNN operations involve convolution, typically denoted as Y = X * W + b, where Y is the output, X is the input, W represents weights, and b is the bias. Pooling involves down-sampling, selecting the maximum or average value from a region, as shown in Fig 1. These operations collectively enable CNNs to learn hierarchical representations, crucial for pattern recognition.
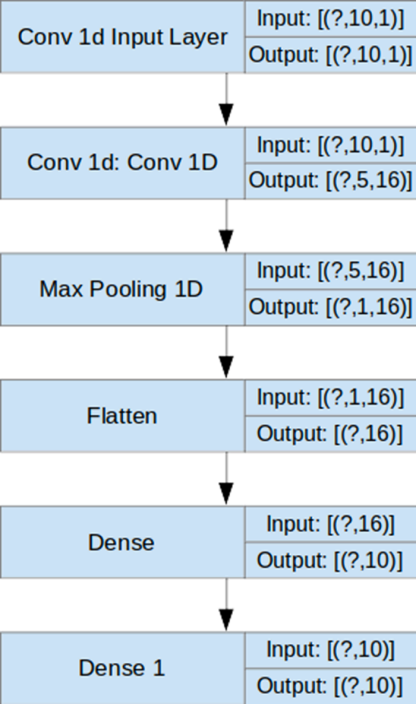

Figure 1: Mathematical model of CNN [8].
Chen et al. proposed a unique method for predicting market trends based on a neural network (GC-CNN) chart model. Empirical results indicate that CNN's approach based on overall leadership outperforms many market trend expectations. Scholars investigated how to use various prediction methods and other typical stocks in financial valuation [8]. Although the technology proposed based on GC-CNN requires longer training time, it is superior to algorithms in the direction of stock prediction. He concluded that technologies with excellent computing performance may not always produce excellent business metrics. Compared to other methods, this approach can achieve greater consistency, stability, and returns. Soleymani and Paquet presented the Deep Breath approach to portfolio management [9]. The depth of reinforcement learning is the foundation of this approach. This method seeks to maximize investment returns by forecasting stock patterns based on particular attributes. Convolutional networks are used to identify investment-related risks and extract the most salient information from a dataset. For a single month, the return on investment is 2.83%; for two months, it is 11.14%; and for three months, it is 11.93%. This was safer and more accurate than the Dow Jones Industrial Average throughout the same time period. Based on the research results that show our system's efficacy in the end, one can also conclude that improved deep learning is a very accurate long-term investment strategy [9].
4. LSTM
A specific kind of RNN called LSTM was created to solve the vanishing gradient issue and enable it to recognize long-term dependencies in sequential input. A thorough examination of the framework, guiding ideas, mathematical formulas, application to stock markets, and benefits analysis are provided below. Seen from Fig. 2, LSTM is made up of memory cells with a complex structure that incorporate three gates: the input, forget, and output gates [10]. The information that is transferred to the next layer is controlled by the output gate, while the forget gate handles the retention or discarding of prior information. The input gate controls the flow of fresh information. since of their architecture, LSTM systems are useful for time-series analysis since they can store and retrieve data selectively across long sequences. In stock price prediction, LSTMs leverage historical price data, technical indicators, and other relevant features as input sequences. The model learns patterns in the time-series data, capturing both short-term fluctuations and long-term trends. LSTMs' ability to retain information over extended periods makes them effective in predicting stock prices over diverse time horizons.
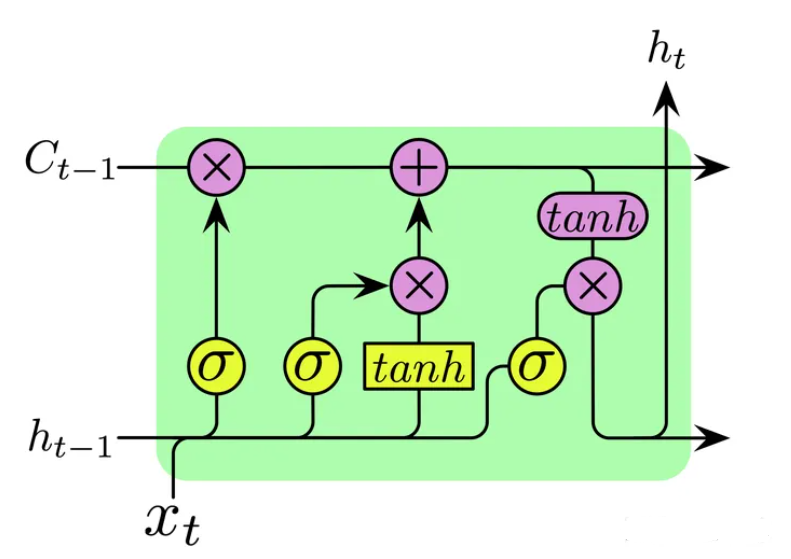
Figure 2: Mathematical model of LSTM [10].
Li et al, By studying the impact of various factors on price fluctuations in 2020, investors can continue to apply these factors to the real world business environment. (1) Manual extraction function from fluctuation cycles; (2) Traditional technical trading indicators; and (3) DAEs derivative functions that can be implicitly expressed. The accuracy of this method is 55.19% and 55.16%. Among them, Hashish et al, In 2019, Markov's hidden model was used to characterize the historical behavior of cryptocurrencies, in order to use long-term memory and long-term networks to predict future behavior. MSE is 59.04, with an absolute deviation (LSTM) of 0.044. Consider other models. In addition, the traditional trade indicator techniques used in this study - the results showed that the MOS, RMS, and MAE (seen from Table 2) were the lowest among all models [11].
Istiake et al. evaluated LSTM trend models using public datasets, high and low closing prices in 2020. In both directions of the LSTM model, the increase in the number of dense layers and neurons decreases, thereby improving the accuracy of test data and reducing training time [12]. For the advantages: (1) Long-Term Dependencies: LSTMs excel in capturing and remembering long-term dependencies in sequential data. (2) Adaptability: The model adapts well to varying time horizons, making it suitable for both short and long-term stock price predictions. (3) Complex Pattern Recognition: LSTMs effectively learn and recognize complex patterns, enhancing their predictive capabilities.
Table 2: HMAE of Different Hybrid LSTM and Deep feed-forward Network is used to calculate errors in standardization [11].
Standardization of 1 day | Standardization of 14 days | Standardization of 21 days | |||||||
7 | 15 | 22 | 7 | 15 | 22 | 7 | 15 | 22 | |
DFN | -70.0938 | -70.0938 | -70.0938 | -55.6855 | -55.6855 | -55.6855 | -41.8263 | -41.8263 | -41.8263 |
LSTM | -34.0446 | -34.0446 | -34.0446 | -35.8013 | -35.8013 | -35.8013 | -30.0856 | -30.0856 | -30.0856 |
W-DFN | -51.3889 | -51.3889 | -51.3889 | -46.0621 | -46.0621 | -46.0621 | -48.4043 | -48.4043 | -48.4043 |
G-DFN | -59.4327 | -59.4327 | -59.4327 | -46.1522 | -46.1522 | -46.1522 | -41.8428 | -41.8428 | -41.8428 |
E-DFN | -35.0952 | -35.0952 | -35.0952 | -52.8462 | -52.8462 | -52.8462 | -60.1509 | -60.1509 | -60.1509 |
W-LSTM | -65.1429 | -65.1429 | -65.1429 | -24.6262 | -24.6262 | -24.6262 | -21.4409 | -21.4409 | -21.4409 |
G-LSTM | -20.6723 | -20.6723 | -20.6723 | -16.5129 | -16.5129 | -16.5129 | -22.7076 | -22.7076 | -22.7076 |
E-LSTM | -20.4522 | -20.4522 | -20.4522 | -14.2413 | -14.2413 | -14.2413 | -17.9137 | -17.9137 | -17.9137 |
GW-LSTM | -18.1538 | -18.1538 | -18.1538 | -12.8910 | -12.8910 | -12.8910 | -11.8483 | -11.8483 | -11.8483 |
EW-LSTM | -31.8286 | -31.8286 | -31.8286 | -20.8394 | -20.8394 | -20.8394 | -18.6612 | -18.6612 | -18.6612 |
GE-LSTM | -55.5190 | -55.5190 | -55.5190 | -34.8125 | -34.8125 | -34.8125 | -25.1056 | -25.1056 | -25.1056 |
GEW-LSTM | -148.8966 | -148.8966 | -148.8966 | -59.5270 | -59.5270 | -59.5270 | -40.0090 | -40.0090 | -40.0090 |
5. ANN
An input layer, hidden layers, and output layer are the three interconnected layers of nodes that make up an ANN. Weights are used to connect neurons within layers, and each connection has a corresponding weight parameter. Activation functions are used in the model to add non-linearity. During training, these weights are modified using backpropagation, which optimizes the network for precise predictions. An example of the generic structure depicted in Figure 3 is an artificial neural network structure with four neurons in the first layer and one neuron in the second layer. For a single-layer perceptron, the operation of an ANN can be stated as follows: y=f(∑Wi*Xi+b). The input features are represented by Xi, the weights are represented by Wi, the bias term is b, and the activation function is f.
ANNs have been extensively applied to predict stock prices by learning patterns from historical data. The model considers various financial indicators and market variables as input features. Its capability to discern non-linear patterns and adapt to dynamic market conditions makes it suitable for capturing intricate relationships. Numerous studies applying ANNs to stock price prediction have reported varying degrees of success. ANNs often outperform traditional models, offering improved accuracy in short to medium-term predictions. However, the model's performance is sensitive to factors such as the choice of features, training data quality, and market volatility. ANNs excel at capturing non-linear relationships inherent in financial data. The model adapts well to changing market conditions, making it suitable for dynamic stock markets. ANNs automatically extract relevant features, eliminating the need for manual feature engineering.
Selvamuthu et al. used the ANN algorithm to eliminate obstacles in data time series [13]. This algorithm combines analysis and prediction of the direction of stock exchange prices. The aim of this study is to explore whether the algorithm can accurately predict stock prices, even if stock prices have the characteristics of dynamic changes and rapid fluctuations. Thanks to abundant data resources and rapid technological development, people have been able to construct ideal algorithms. This study used three algorithms: Levenberg Marquardt (L.M.), Scale Conjugate Gradient (SCG), and Bayesian Regularization. The study found that in 103 (54) repeated experiments, the SCG algorithm performed better than L.M algorithm. However, in terms of time efficiency, the SCG algorithm outperforms L.M algorithm, which is more efficient, although the latter has a faster computational speed. Assuming that organizational theory provides the smallest error box in all datasets. Wamkaya and Muchemi's research has found that when the configuration ratio is 5:21:21:1, the prediction accuracy is improved. This study concluded that to obtain these results, at least 1000 registered copies were trained in 130000 courses. These records account for approximately 80% of the training data. Use this model to predict 60 future values. After training, the artificial neural network can accurately predict. Then, he used the model to predict three stocks on the New York Stock Exchange. This model can accurately predict prices, with an error range of 0.71% to 2.77% (validated using Encog and Neuroph) [14].
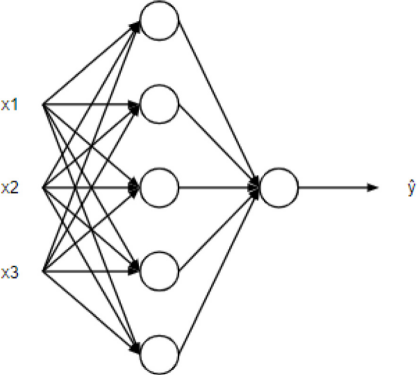
Figure 3: Generic structure of ANN [13].
6. Comparison, Limitations and Prospects
Each neural network model exhibits distinct characteristics influencing their effectiveness in stock price prediction. CNNs are proficient in recognizing spatial patterns, making them highly suitable for short-term prediction. They perform well in identifying local features and are particularly effective in volatile market conditions. LSTMs, designed to capture long-term dependencies, exhibit proficiency in understanding and predicting trends over extended periods. They outperform in scenarios where temporal relationships play a crucial role. ANNs, with their versatile architecture, strike a balance between temporal and spatial features. They are adaptable to various timeframes, offering competitive performance across different prediction horizons. Performance metrics, such as MSE and MAPE, vary based on the characteristics of the data and the chosen time horizon. CNNs often excel in minimizing short-term prediction errors, while LSTMs demonstrate strengths in reducing errors over more extended periods. ANNs, with their flexibility, provide a balanced performance across various timeframes.
While these models exhibit strengths, they also face limitations in the context of stock price prediction. CNNs may struggle with capturing long-term trends due to their focus on local patterns. They might not effectively adapt to market shifts occurring over extended periods. LSTMs, while powerful in capturing long-term dependencies, can be sensitive to hyperparameters and may be prone to overfitting, especially with limited data. Rapid market shifts can pose challenges for prompt adaptation. ANNs, despite their adaptability, may not explicitly handle temporal dependencies, potentially limiting their effectiveness in capturing evolving market conditions. The future of stock price prediction lies in addressing current limitations and optimizing the models for enhanced performance. To enhance CNNs, incorporating attention mechanisms or combining them with LSTMs in hybrid models could improve the capture of both short and long-term patterns. Ensuring adaptability to diverse market conditions is key. Advanced architectures, such as incorporating attention mechanisms or utilizing different LSTM variants like Gated Recurrent Units (GRUs), can mitigate overfitting and improve the model's ability to capture long-term dependencies. Further research into ensemble methods and hyperparameter tuning can contribute to enhanced performance. For ANNs, integrating temporal features or employing attention mechanisms can help address limitations related to time-series data. Hybrid models that combine the strengths of CNNs, LSTMs, and ANNs could provide a holistic approach. Additionally, ongoing research into optimizing activation functions and weight initialization methods can further improve ANN performance.
7. Conclusion
In conclusion, for the field of stock price prediction, the comparative analysis of Convolutional Neural Networks (CNN), Long Short-Term Memory (LSTM) networks, and Artificial Neural Networks (ANN) has yielded insightful results. CNNs, with their ability to capture local patterns, have shown promise in identifying trends within financial data. LSTMs, known for their temporal sequence processing capabilities, have demonstrated superior performance in handling time series data, which is crucial for stock prices. Meanwhile, ANNs, with their versatility, have provided a solid baseline for comparison. The study indicates that LSTMs generally outperform CNNs and ANNs in terms of prediction accuracy, attributed to their ability to model long-term dependencies effectively. However, the complexity of LSTMs can lead to overfitting if not properly managed. The study's limitations include the reliance on historical data, which may not fully capture the unpredictable nature of financial markets. Future research could explore the integration of additional data sources, such as macroeconomic indicators, to enhance model robustness. Moreover, the computational expense of LSTMs presents a challenge for real-time applications, suggesting a need for more efficient architectures. This research contributes to the financial analytics field by providing a structured comparison of three prominent machine learning models. It offers valuable insights for practitioners and researchers seeking to optimize their predictive models for stock market analysis.
References
[1]. Bekaert, G. and Harvey, C.R. (2003) Emerging markets finance. In: Journal of Empirical Finance, 10(1-2), 3-55.
[2]. Xing, S., Cheng, T. and Sun, S. (2024) Do investors herd under global crises? A comparative study between Chinese and the United States stock markets. In: Finance Research Letters, Volume 62, Part A, April 2024, 105120.
[3]. Shah, Y., Liu, Y., Shah, F., Shah, F., Satti, M.I., Asenso, E., Shabaz, M. and Irshad, A. (2024) COVID-19 and commodity effects monitoring using financial & machine learning models. In: School of Business, Zhengzhou University, 450001, China.
[4]. Mintaryaa, L.N., Halima, J.N.M., Angiea, C., Achmada, S., Kurniawana, A. and Kurniawana, A. (2022) Machine learning approaches in stock market prediction: A systematic literature review. In: Expert Systems With Applications, 197, 116659.
[5]. Shah, J., Vaidya, D. and Shah, M. (2022) A comprehensive review on multiple hybrid deep learning approaches for stock prediction. In: Intelligent Systems with Applications, 16, 200111.
[6]. Khang, P.Q., Kaczmarczyk, K., Tutak, P., Golec, P., Kuziaka, K., Depczyński, R., Hernes, M. and Rot, A. (2021) Machine learning for liquidity prediction on Vietnamese stock market. In: Procedia Computer Science, 192, 3590–3597.
[7]. Yadav, A., Jha, C. K. and Sharan, A. (2020) Optimizing LSTM for time series prediction in Indian stock market. In: Procedia Computer Science, 167, 2091–2100.
[8]. Chen, W., Jiang, M., Zhang, W.G. and Chen, Z. (2021) A novel graph convolutional feature based convolutional neural network for stock trend prediction. In: Information Sciences, 556, 67–94.
[9]. Soleymani, F. and Paquet, E. (2020) Financial portfolio optimization with online deep reinforcement learning and restricted stacked autoencoder—DeepBreath. In: Expert Systems with Applications, 156, Article 113456.
[10]. Li, Y., Zheng, Z. and Dai, H.N. (2020) Enhancing Bitcoin Price Fluctuation Prediction Using Attentive LSTM and Embedding Network. Applied Sciences, 10, 14.
[11]. Kim, H.Y. and Won, C.H. (2018) Forecasting the volatility of stock price index: A hybrid model integrating LSTM with multiple GARCH-type models. Expert Systems with Applications, 103, 25–37.
[12]. Sunny, I., Maswood, M.M.S. and Alharbi, A.G. (2020) Deep learning-based stock price prediction using LSTM and Bi-Directional LSTM model. In: 2nd Novel Intelligent and Leading Emerging Sciences Conference, NILES 2020, 87–92.
[13]. Selvamuthu, D., Kumar, V. and Mishra, A. (2019) Indian stock market prediction using artificial neural networks on tick data. In: Financ. Innov., 5(1), 1–12.
[14]. Wamkaya, B. and Muchemi, L. (2014) ANN Model to Predict Stock Prices at Stock Exchange Markets. Retrieved from https://arxiv.org/abs/1502.06434.
Cite this article
Wen,H. (2024). Prediction of Stock Price by Neural Network Based on CNN, LSTM, ANN. Advances in Economics, Management and Political Sciences,87,229-237.
Data availability
The datasets used and/or analyzed during the current study will be available from the authors upon reasonable request.
Disclaimer/Publisher's Note
The statements, opinions and data contained in all publications are solely those of the individual author(s) and contributor(s) and not of EWA Publishing and/or the editor(s). EWA Publishing and/or the editor(s) disclaim responsibility for any injury to people or property resulting from any ideas, methods, instructions or products referred to in the content.
About volume
Volume title: Proceedings of the 2nd International Conference on Management Research and Economic Development
© 2024 by the author(s). Licensee EWA Publishing, Oxford, UK. This article is an open access article distributed under the terms and
conditions of the Creative Commons Attribution (CC BY) license. Authors who
publish this series agree to the following terms:
1. Authors retain copyright and grant the series right of first publication with the work simultaneously licensed under a Creative Commons
Attribution License that allows others to share the work with an acknowledgment of the work's authorship and initial publication in this
series.
2. Authors are able to enter into separate, additional contractual arrangements for the non-exclusive distribution of the series's published
version of the work (e.g., post it to an institutional repository or publish it in a book), with an acknowledgment of its initial
publication in this series.
3. Authors are permitted and encouraged to post their work online (e.g., in institutional repositories or on their website) prior to and
during the submission process, as it can lead to productive exchanges, as well as earlier and greater citation of published work (See
Open access policy for details).
References
[1]. Bekaert, G. and Harvey, C.R. (2003) Emerging markets finance. In: Journal of Empirical Finance, 10(1-2), 3-55.
[2]. Xing, S., Cheng, T. and Sun, S. (2024) Do investors herd under global crises? A comparative study between Chinese and the United States stock markets. In: Finance Research Letters, Volume 62, Part A, April 2024, 105120.
[3]. Shah, Y., Liu, Y., Shah, F., Shah, F., Satti, M.I., Asenso, E., Shabaz, M. and Irshad, A. (2024) COVID-19 and commodity effects monitoring using financial & machine learning models. In: School of Business, Zhengzhou University, 450001, China.
[4]. Mintaryaa, L.N., Halima, J.N.M., Angiea, C., Achmada, S., Kurniawana, A. and Kurniawana, A. (2022) Machine learning approaches in stock market prediction: A systematic literature review. In: Expert Systems With Applications, 197, 116659.
[5]. Shah, J., Vaidya, D. and Shah, M. (2022) A comprehensive review on multiple hybrid deep learning approaches for stock prediction. In: Intelligent Systems with Applications, 16, 200111.
[6]. Khang, P.Q., Kaczmarczyk, K., Tutak, P., Golec, P., Kuziaka, K., Depczyński, R., Hernes, M. and Rot, A. (2021) Machine learning for liquidity prediction on Vietnamese stock market. In: Procedia Computer Science, 192, 3590–3597.
[7]. Yadav, A., Jha, C. K. and Sharan, A. (2020) Optimizing LSTM for time series prediction in Indian stock market. In: Procedia Computer Science, 167, 2091–2100.
[8]. Chen, W., Jiang, M., Zhang, W.G. and Chen, Z. (2021) A novel graph convolutional feature based convolutional neural network for stock trend prediction. In: Information Sciences, 556, 67–94.
[9]. Soleymani, F. and Paquet, E. (2020) Financial portfolio optimization with online deep reinforcement learning and restricted stacked autoencoder—DeepBreath. In: Expert Systems with Applications, 156, Article 113456.
[10]. Li, Y., Zheng, Z. and Dai, H.N. (2020) Enhancing Bitcoin Price Fluctuation Prediction Using Attentive LSTM and Embedding Network. Applied Sciences, 10, 14.
[11]. Kim, H.Y. and Won, C.H. (2018) Forecasting the volatility of stock price index: A hybrid model integrating LSTM with multiple GARCH-type models. Expert Systems with Applications, 103, 25–37.
[12]. Sunny, I., Maswood, M.M.S. and Alharbi, A.G. (2020) Deep learning-based stock price prediction using LSTM and Bi-Directional LSTM model. In: 2nd Novel Intelligent and Leading Emerging Sciences Conference, NILES 2020, 87–92.
[13]. Selvamuthu, D., Kumar, V. and Mishra, A. (2019) Indian stock market prediction using artificial neural networks on tick data. In: Financ. Innov., 5(1), 1–12.
[14]. Wamkaya, B. and Muchemi, L. (2014) ANN Model to Predict Stock Prices at Stock Exchange Markets. Retrieved from https://arxiv.org/abs/1502.06434.