


1. Introduction
With the increasingly serious problem of global climate change, realizing sustainable economic development has become an urgent challenge for countries worldwide. The contradiction between economic growth and environmental protection, especially how to effectively manage the environment and reduce carbon emissions and pollution while promoting economic development, has become an issue that needs to be closely watched and resolved. Rogelj emphasized in their study that the Paris Agreement aims to limit global warming to well below 2 degrees Celsius and strives to limit it to 1.5 degrees Celsius [1]. To achieve the goal of the Paris Agreement, which is to complete the world's balance of carbon emissions and elimination in the second half of this century, countries have submitted their nationally owned contributions and outlined their upcoming climate actions after 2020. Still, the intensity of the actions will need to be strengthened to accomplish the original goal within the specified time frame [1]. This provides a contextual reference for the world's quest to balance economic growth with environmental protection: the world will need to take additional action to reduce greenhouse gas emissions in the future to meet the temperature targets of the Paris climate agreement.
The motivation for this study stems from the real world's urgent need to balance the global issues of economic development and environmental protection, and the dynamic stochastic general equilibrium model (DSGE model), with its strong micro foundation and flexibility in analyzing economic policies, is an ideal choice for studying such issues. By applying the DSGE model, this paper not only highly summarizes the interactions between economic growth and environmental protection, but also analyzes in detail how factors including production technology, carbon tax policy, bank lending rates, and governmental fiscal policy affect economic growth, environmental protection, and social welfare in an integrated manner. The results of the study show that appropriate macroeconomic policies can promote economic growth while reducing carbon emissions, thus improving social welfare.
The significance of the research in this paper is that constructing and analyzing the DSGE model provides a theoretical framework and a tool aimed at providing theoretical support and policy recommendations for solving the problem of balance between economic growth and environmental protection.
2. Model Setting
2.1. Households
The household sector is formulated based on the findings of Gertler and Karadi [2]. It is assumed that the caliber of utility measurements is the same across household sectors and that the lifespan of each household sector is infinite and continuous. Infinite duration is a concept that is specific to terminal values or cross-sectional conditions, and such an assumption brings the path of capital change closer to reality. In this way, each household has at least one family member who is the subject of a continuous unit measure. Where  proportion of members within the household sector are workers and another
  are bankers, and the roles are interchangeable. Workers spend their controlled leisure time providing labor to energy-based and ecological firms and earn wages that are returned to the household sector. Bankers each manage a separate financial intermediary, the bank. Bankers perform financial intermediation services through the bank and transfer the interest margins earned to households. Households, as economic agents, share household expenditures and income between bankers and workers within them. It should be particularly emphasized that the household sector has no direct access to lending to enterprises for income or savings and that the only way to save is to deposit the funds earned in the bank.
The household utility function is expressed as follows:
 (1)
(1)
Where  is the household's consumption in period t,
 is the household's savings in the form of bank deposits in period t, and
  , denotes labor time in the different sector. The household sector is expected to maximize utility across periods by controlling consumption and labor time. The household sector's economic activity in each period is constrained by the budget constraint.
 (2)
(2)
Where  and
and  are the real wage levels of energy-based and ecological firms, respectively
  is the risk-free interest rate,
  is the distribution of profits received by households from banks and the sum of the interest differentials transferred by bankers to households,
  is the returns received by households from non-financial firms, and
  is the lump-sum transfer payment from the government to households. The parameter
  ∈ ( 0, 1 ) is the intertemporal discount factor for the household, with each period t corresponding to a separate
  ,
,  > 0 is the weight parameter for the negative utility of labor, and
  > 0 is the relative risk aversion coefficient, which allows the curvature of the utility function.
Refer to Horvath on labor time [3]. There is imperfect substitutability of labor across sectors. Normalize each household's labor time to 1 in each period t.  denotes the total number of hours of work accumulated by the household in period t.
  is the elasticity of substitution parameter, and when
  = 0, the labor hours of energy-based and ecological firms are perfectly substitutable for households. When
  > 0, the labor hours of the two firms are imperfectly substitutable across sectors.
  is the inverse of the Frisch labor supply elasticity.
Also let  be the household stochastic discount factor, where
  denotes the marginal utility of consumption in period t. The household's optimal consumption and sector-specific labor supply decisions are derived from the Lagrangian first-order conditions:
 (3)
(3)
 (4)
(4)
2.2. Banking Sector/Bankers
To implement the carbon emission reduction target, optimize the specific measures for financial institutions to hold green assets, encourage the development of ecological enterprises, to achieve the purpose of energy-based industrial transformation, energy saving, and emission reduction, the establishment of the banking sector considers the introduction of government macro-regulation policy. Macro-regulation refers to specific practices in Paoli [4]. Corresponding to the reality of the policy on the commercial banks of capital adequacy, leverage, provision coverage ratio, liquidity ratio, and other indicators of regulation, although different from the direct taxation of assets, in essence, is to strengthen the financial intermediaries of the anti-risk capacity, to maintain a stable and sustainable development of the economic chain. As mentioned earlier, each banker manages a separate bank. Bankers can provide green credit loans to firms by summing up their own household's internal funds with external funds raised from other households in the form of bank deposits and using the summed funds to provide green credit loans to firms.
Suppose that at moment t, individual bankers  purchase securities
  issued by final goods firms at a unit price
  ,
,  . The government can impose a macroprudential tax on the bank's eco- and energy-based assets at a rate of
  ,
,  . The rates of macroprudential taxes levied on different types of assets vary. This could reflect the government's consideration as a regulator in the regulation of the types of capital held by banks to support banks in holding eco-friendly assets to meet emission reduction targets. The cost of managing bank assets is small compared to assets. Bankers offset expenses with the sum of household net worth (own capital)
  and new deposits
 from depositors.
The balance sheet or flow of funds constraints for each bank are as follows:
 (5)
(5)
Where  is the cost function of asset management for each type of asset, inscribed in terms of the variance of the current ecological asset share of total assets versus the long-term steady-state value of the period, total assets, and the adjustment cost parameter,
  . Where
  represents it's for is the total value of portfolio assets held by banker
  at moment t. Parameter
  denotes the long-run steady state parameter of the ratio of ecological security assets to total security assets held by the banking sector, and
  > 0 is the adjustment cost parameter. In calibration, the administrative costs are small and they are set up so that the bank's steady-state portfolio choice is deterministic.
  and
and  denote the bank's energy-based and ecological asset returns, respectively. t is the period in which the moment of total return is realized.
The asset accumulation equation for bank  , managed by banker
  , is as follows:
 (6)
(6)
According to Gertler and Karadi, making banks endogenously financially risky and introducing a moral hazard problem for bankers to limit each bank's ability to obtain external funding [2]. Normalizing all assets held by a bank to 1, after raising deposits and purchasing assets at time t, a banker managing an independent bank can choose to supply part  of the exogenous portion of the total assets for his use, with
  being the proportion of funds that can be misappropriated, or it can be a financial friction factor that means that the assets are diverted to the banker's household sector. The cost of this behavior is that if the misappropriation of assets becomes known to the various depositors, the bank immediately declares bankruptcy and begins liquidation, and each depositor closes the bank after recovering the remaining part
  of the assets in proportion to the deposits made. Depositors need to be aware of the possibility of ethical problems with bankers. Depositors will consider saving with bank
  only if they are informed that the misappropriation of assets by banker
  is unprofitable and if they are assured of the integrity of banker
  .
.  denotes the value of the bank's going concern at the end of period t. The following incentive constraints must be satisfied if depositors are to be willing to deposit with banker
  .
.
 (7)
(7)
The above equation expresses that the present value of the bank's going concern value  discounted future honest operating profit is greater than the gain from misappropriation of funds, which satisfies the condition that depositors are willing to deposit funds with bankers. The endogenous risk of the bank can be reflected in the fall in the price of assets will lead to a surplus on the liability side of the bank, which will lead to a reduction in the supply of loans to enterprises, bringing financial risk and triggering a downturn in the economy. However, the above equation always holds in equilibrium, so banks do not go into liquidation and bankers do not misappropriate funds.
To make it impossible for banks to operate exclusively with bankers' funds, assume that at the end of each period t, bankers exit the banking industry with exogenous probability  , while the transformation of a worker into a banker has the same exogenous probability. Upon exit, the banker transfers retained earnings to his household in cash and becomes a worker. The continuing banker reinvests all of the assets he or she currently owns. The ultimate goal of the banker is to maximize the expected present value of his or her wealth. The banker chooses to maximize the summed asset holdings of securities
  ,
, , and deposits
  , in the production sector consisting of energy-based and ecological firms. Since bankers belong to households, the ultimate equity holders of the bank are the household sector, and the problem of maximizing the discounted terminal value is written in the form of Bellman's equation as follows for a discounting operation using the household stochastic discount factor:
 (8)
(8)
The meaning expressed at the right end of the above equation is the sum of the multiplication of the probability of surviving previously and exiting the banking sector in the current period with the discounted value it receives in each period. Where the household stochastic discount factor ,
, denotes the ecological asset share of the total portfolio. where the total assets held by the banker are
  and the share of ecological assets in the total portfolio is
  in each period.
Referring to most of the literature, the bank value is assumed to be linear for the banker's assets, with the following expression:
 (9)
(9)
Where  ≥ 1 is the coefficient of own assets on the value of the bank.
Combining (7) (9) the incentive constraint is expressed as:
 (10)
(10)
The above equation indicates that the social demand for bank loans  receives the bank net worth
  constraint, and the exogenous shocks will have an effect by affecting the bank's net worth.
The following equation determines the total capital requirements of polluting and non-polluting firms, where the proportion of green capital to total capital is:
 (11)
(11)
In the above equation  is the bank's stochastic discount factor, and the right-hand side of the equal sign in the above equation represents the discounted excess return of ecological corporate capital over energy corporate capital. When
  rises and
  falls, the share of ecological capital in total capital will rise. Thus changes in government taxes can affect the market share of capital held by ecological and energy-based firms.
Suppose that the initial working capital of all new banks joining the banking industry is  . where the total assets of the banking sector are determined by the following equation:
 (12)
(12)
The bank pays households a profit is as follows:
 (13)
(13)
Define total leverage in the banking sector as the ratio of total capital to bank net worth, i.e.,  . Similarly, the bank's loan premium is the difference in the yields of different types of assets over the risk-free asset, i.e.,
2.3. Final Product Enterprises
Two types of firms are assumed to produce final goods, the energy-based firms produce requiring emissions as by-products, while the eco-based firms have no by-products. Both production sectors depend on the banking sector for funds to purchase capital or means of production.
2.3.1. Production Technology
It is assumed that carbon emissions hurt the productivity of both ecological and energy-based firms. Both types of firms use a C-B production function and invest in capital  and labor
  .
.
 (14)
(14)
where  is the stock of carbon emissions,
  ∈ ( 0, 1 ) is the increasing loss function,
  is the weight of the share of capital in the output, and
  is the Total Factor Productivity ( TFP ) shock for the aggregate economy, which is consistent with:
 (15)
(15)
There is an imperfect substitution between eco-commodities and energy commodities. The amount of product  that eventually circulates to the market for consumption is a CES elasticity of aggregation of outputs in each sector.
 (16)
(16)
where  > 0 is the elasticity of substitution parameter for the two intermediate goods, and
  is the proportion of energy-based goods in the final goods. The demand functions for the two types of output are:
 (17)
(17)
Where  and
and  denote the relative prices of energy-based and ecological commodities, respectively, and normalized to 1 for final consumer goods.
2.3.2. Energy-based Enterprises
The production of energy-based firms requires carbon emissions as a by-product. The stock of carbon emissions  is expressed as follows:
 (18)
(18)
where  denotes domestic emissions in the current period and
  is emissions from the rest of the world. Domestic emissions depend on the amount of production in the energy-based sector
  and the proportion of emission reductions
 (19)
(19)
The abatement cost  is set up as
  . Referring to the approach of Nordhaus and Heutel, the exponential function form of the carbon emission elasticity with respect to output,
  , and the abatement cost function,
  [5, 6]. Since energy-based firms do not internalize the impact of the carbon emission stock
  and the associated damages
  in their production on total output, an externality from the environmental point of view arises.
It is assumed that at the end of period t, the final goods firms of the energy-based firms purchase capital  from the capital goods manufacturers at the market price
  . Referring to Gertler and Karadi, firms finance their capital purchases by issuing financial securities
  to banks [2]. Each unit of the security has the same price
  as the corresponding unit of capital such that
  . When production ends at moment t + 1, the firm can sell depreciated capital
  in the market for
  . At the same time, firms offer a payoff
  on securities held by banks conditional on their profitability status.
The energy-based firm is constrained by the carbon tax rate  imposed by the government. Then its profit function in period t is:
 (20)
(20)
The payoff first-order conditions for labor  , emission reductions
  , and energy-based assets with respect to the profitability state condition are as follows:
 (21)
(21)
 (22)
(22)
 (23)
(23)
2.3.3. Ecologically Based Enterprises
In contrast to the construction method for energy-based firms, the first-order conditions for ecological firms are as follows:
 (24)
(24)
 (25)
(25)
2.4. Capital Goods Manufacturers
Refer to Christiano, Eichenbaum, and Evans, Capital Goods Manufacturers purchase depreciated capital from two firms [7]. This capital is used to produce investment goods for both firms, denoted as  ,
,  . Conditional on the convexity of capital adjustment costs, the capital-producing firm produces ecological and energy-based investment goods. The optimization objective of the manufacturer is to choose the optimal quantity of investment goods to be produced to achieve the profit maximization objective, $
 $ denotes the return on the investment, $
 denotes the cost of producing the investment well, and the parameter
  ≥ 0 controls the size of the adjustment cost.
  denotes the price of the investment good. The utility maximization problem for the capital goods manufacturer transforms into:
 (26)
(26)
Its first-order condition is as follows.
 (27)
(27)
2.5. The Government Sector
Government revenues include a carbon tax from energy companies and a tax on capital profits from energy-based and eco-businesses. Government expenditures include transfers to households and general government expenditures.
 (28)
(28)
 (29)
(29)
 (30)
(30)
 (31)
(31)
 , denote the pulse duration parameters, respectively.
 , denote exogenous shocks, respectively.
3. Parameter Calibration
The frequency of the steady state values of the parameters and variables of this model is quarterly. The calibration parameters include three categories: static parameters, environmental parameters, and policy-related parameters. The actual economic conditions, mainstream literature calibration, reference to other DSGE model calibration, and actual economic conditions calibration are used respectively. Data sources: People's Bank of China, Choice Financial Terminal Macroeconomic Database, National Bureau of Statistics, CEIC China Economic Database, International Energy Agency, etc.
3.1. Static Parameters
The calibration of the household sector parameters is performed first. The household intertemporal discount factor  is set to 0.995, corresponding to a quarterly interest rate of 1%, and the elasticity of substitution parameter
  is set to 1. The inverse of the elasticity of supply of Frisch's labor
  is calibrated 1 concerning the Ziguan Zhuang. Assuming that the value of the household's labor in the steady-state is 1/3, which corresponds to an 8-hour day of work, the weight parameter
  of negative utility of labor is calibrated to 8.3849. The relative risk aversion coefficient
  is set to 2 concerning Li Kang.
The parameters are calibrated for the banking sector. The probability of bank survival per quarter  is 0.972 concerning Chen Xiong. the parameter of bank transfers to households
  is set to 0.0001 and the parameter of elasticity of substitution for the two intermediate goods
 is calibrated to 2 concerning Papageorgiou, C., Saam, M., and Schulte [8].
Parameter calibration for the final goods manufacturer sector. The parameter of the index function of production and carbon emissions, i.e., the output elasticity  , is calibrated to 1. The weights of capital's share of output,
  , and
, and  , are often set to 0.35 and 0.33, respectively, in an RBC model. energy-based firms are slightly more likely than ecological firms to have a slightly higher, carbon-emission decay technique
  is calibrated to 0.9965. The energy-based and ecological investment adjustment cost parameters
  ,
,  are consistent with most E-DSGEs, and calibrated to 10 concerning Heutel [6]. Matching the value of the divertible funds ratio
  and the transfer parameter ζ to the banking sector's steady state leverage ratio of 4.5, calibrated concerning Gertler and Karadi
  = 0.3409 [2]. assets, the adjustment cost parameter
  for banks is very small and calibrated to 0.0001.
  is the proportion of energy-based goods in final goods, and to make the ratio of ecological capital stock to total stock
  in steady state 0.60, it is calibrated to
  = 0.3326 .
3.2. Environmental Parameters
The loss function parameters  refer to Gibson and Heutel while dividing by the corresponding power of the carbon emission stock, converted to dimensionless and set to -0.0076, 8.10*10^(-6),1.05*10^(-8) [9]. The abatement cost coefficient
  is calibrated to
  =0.00335 after adjusting for the ratio of energy-based sectoral output to total output in steady state [9]. According to Nordhaus, the exponential part of the abatement cost function
  is calibrated to 2.6 [5]. The capital depreciation rate
  for energy-based and eco-firms is calibrated to 0.025 concerning Qi Liang and Yi Hao. The calibration is based on the policy instrument being close to 0, so the steady state value of all tax rates
  is calibrated to 0.0001.The other national carbon emissions
  are calibrated to 3.1499.
3.3. Dynamic Parameters
The pulse duration parameters  are all taken to be 0.8.
The exogenous shock perturbation terms  are all taken to be 0.0007.
4. Analysis of Impact Effects
The economic significance of all the variables in the following charts is mentioned in the previous section, with the horizontal coordinates representing the unit period and the vertical coordinates representing the values of the variables.
4.1. One Unit of Positive Technological Shock
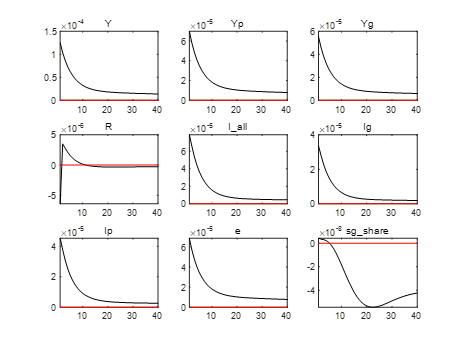
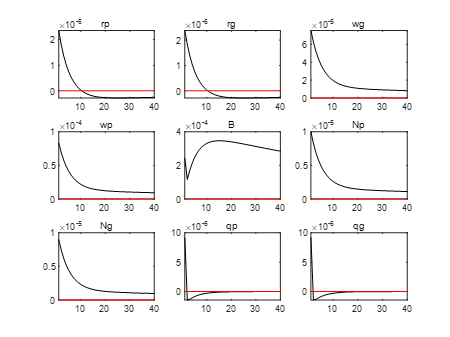
Figure 1: Macroeconomic impact of positive technology shocks
Under a one-unit positive technology shock, as shown in Figure 1, both eco-firms and energy firms increase their demand for labor supply, which leads to a rise in wages, labor use, capital compensation, and capital use in both eco-firms and energy firms. At the same time, asset prices rise, which leads to a rise in bank lending and a rise in the share of capital in total capital for eco-firms. In the end, both total output and energy or eco-firms grow, and since emissions are positively related to output, output growth also leads to growth in carbon emissions.
4.2. One-Unit Tax Shock on Interest Rates on Loans to Energy-Based Firms
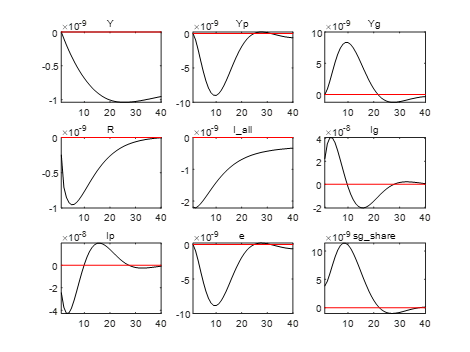
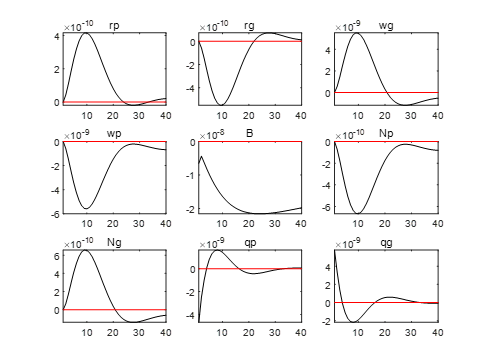
Figure 2: Macroeconomic impact of a tax shock on lending rates for energy-based firms (Original).
Figure 2 shows that total output rises when the government taxes the lending rate of energy-based firms, but because the government taxes the lending rate of energy-based firms, energy-based firms face higher lending costs, and energy-based firms' demand for both capital and labor declines, which results in a downward trend in the wages of the polluting firms but a rise in the compensation of capital. On the contrary, since the ecological firms have an interest rate advantage over the energy firms, the ecological firms can increase their demand for both labor and capital, and the share of capital in the total capital of the ecological firms increases. On the other hand, as the share of energy-based firms declines, the overall level of carbon emissions in the economy decreases, suggesting that the policy is effective in reducing carbon emissions.
4.3. One Unit of Carbon Tax Shock
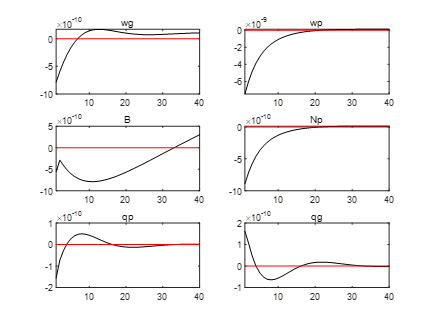
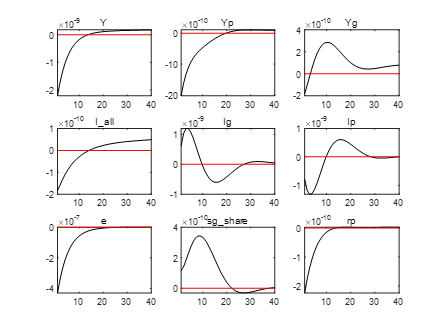
Figure 3: Macroeconomic impact of carbon tax shocks (Original).
As shown in Figure 3, under the one-unit carbon tax shock, which indicates that the government has increased the tax on carbon emissions, the demand for labor and capital of energy-based firms tends to decline under this policy, and thus wages and capital compensation decline to varying degrees, which leads to a decline in the output of energy-based firms. On the other hand, as the carbon tax has a stronger restrictive effect on energy-based enterprises, the proportion of eco-enterprise capital in the total social capital rises, which leads to a rise in the output of eco-enterprises around the third period, and as a result of the rise in the capital of eco-enterprises, the overall level of social emissions can be reduced, and the environment improves under this policy.
4.4. One-Unit Government Expenditure Shock
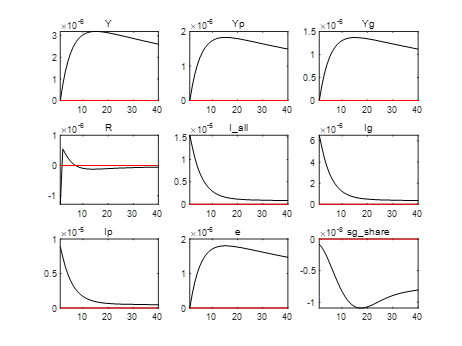
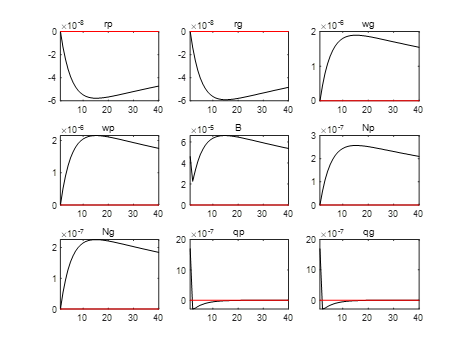
Figure 4:Macroeconomic impact of government spending shocks (Original).
Figure 4 illustrates that under a government spending shock, an increase in government spending causes the level of demand to rise across society, which leads to a rise in the demand for capital and labor by both ecological and energy-based firms, in which case the compensation of capital falls and labor grows, which leads to a rise in total output as well as in the level of output for both types of firms. However, an increase in the level of government spending will, in one respect, lead to a decrease in the ratio of ecological firms' capital to total capital; in short, an increase in the level of government spending is more likely to lead to the redevelopment of energy-based firms.
5. Conclusion
This study confirms that economic growth and environmental protection are not irreconcilable opposites. Appropriate policy tools, such as carbon tax, industry-specific fiscal policy adjustments, and an active role of the government in environmental protection, can effectively promote the transformation of the economy to a sustainable development model. At the same time, the positive effects of technological progress are not only reflected in economic growth but also in its potential to reduce environmental pollution and enhance resource use efficiency. Therefore, policymakers should emphasize the synergistic effect between scientific and technological innovation and environmental protection, and encourage the research, development, and application of clean technologies through the formulation of reasonable policies.
Future research could delve into the following areas:
Integration of technological innovation and environmental policies: further study the economic effects of different types of technological innovations under the framework of environmental policies, and innovate and refine the expression of different types of technological innovations and policy formulas, as well as how these technologies affect the restructuring and transformation of society as a whole and of the local economy.
Policy Refinement: Further modeling of macroeconomic policies to encompass most of the mainstream policies to study the changes in macroeconomic indicators and environmental quality under different policies.
Multi-dimensional assessment of social welfare: In addition to economic growth and environmental protection, future research should also focus on the impact of policies on various aspects of social welfare, including health, education, employment, etc., which can create a more refined household utility function and thus provide a more comprehensive policy assessment framework.
References
[1]. Christiano, L., Eichenbaum, M., & Evans, C. (2001). Nominal Rigidities and the Dynamic Effects of a Shock to Monetary Policy, 113(1), 1–45.
[2]. Gertler, M., & Karadi, P. (2011). A model of unconventional monetary policy. Journal of Monetary Economics, 58(1), 17–34.
[3]. Gibson, J., & Heutel, G. (2023). Pollution and labor market search externalities over the business cycle. Journal Of Economic Dynamics & Control, 151, 104665. Amsterdam: Elsevier.
[4]. Heutel, G. (2012). How should environmental policy respond to business cycles? Optimal policy under persistent productivity shocks. Review of Economic Dynamics, 15(2), 244–264.
[5]. Horvath, M. (2000). Sectoral shocks and aggregate fluctuations. Journal of Monetary Economics, 45(1), 69–106.
[6]. Nordhaus, W. D. (2014). A Question of Balance:Weighing the options on global warming policies. Yale University Press.
[7]. Paoli, B. D., & Paustian, M. (2017). Coordinating monetary and macroprudential policies. Journal of Money, Credit and Banking, 49(2–3), 319–349.
[8]. Papageorgiou, C., Saam, M., & Schulte, P. (2017). Substitution between Clean and Dirty Energy Inputs: A Macroeconomic Perspective. The Review of Economics and Statistics, 99(2), 281–290.
[9]. Rogelj, J., Den Elzen, M., Höhne, N., & Fransen, T. (2016). Paris Agreement climate proposals need a boost to keep warming well below 2 °C. Nature, 534(7609), 631–639.
Cite this article
Peng,L. (2024). Macroeconomic Policy Adjustments on Environmental Protection Effectiveness Research - Based on the DSGE Model. Advances in Economics, Management and Political Sciences,95,27-39.
Data availability
The datasets used and/or analyzed during the current study will be available from the authors upon reasonable request.
Disclaimer/Publisher's Note
The statements, opinions and data contained in all publications are solely those of the individual author(s) and contributor(s) and not of EWA Publishing and/or the editor(s). EWA Publishing and/or the editor(s) disclaim responsibility for any injury to people or property resulting from any ideas, methods, instructions or products referred to in the content.
About volume
Volume title: Proceedings of the 2nd International Conference on Management Research and Economic Development
© 2024 by the author(s). Licensee EWA Publishing, Oxford, UK. This article is an open access article distributed under the terms and
conditions of the Creative Commons Attribution (CC BY) license. Authors who
publish this series agree to the following terms:
1. Authors retain copyright and grant the series right of first publication with the work simultaneously licensed under a Creative Commons
Attribution License that allows others to share the work with an acknowledgment of the work's authorship and initial publication in this
series.
2. Authors are able to enter into separate, additional contractual arrangements for the non-exclusive distribution of the series's published
version of the work (e.g., post it to an institutional repository or publish it in a book), with an acknowledgment of its initial
publication in this series.
3. Authors are permitted and encouraged to post their work online (e.g., in institutional repositories or on their website) prior to and
during the submission process, as it can lead to productive exchanges, as well as earlier and greater citation of published work (See
Open access policy for details).
References
[1]. Christiano, L., Eichenbaum, M., & Evans, C. (2001). Nominal Rigidities and the Dynamic Effects of a Shock to Monetary Policy, 113(1), 1–45.
[2]. Gertler, M., & Karadi, P. (2011). A model of unconventional monetary policy. Journal of Monetary Economics, 58(1), 17–34.
[3]. Gibson, J., & Heutel, G. (2023). Pollution and labor market search externalities over the business cycle. Journal Of Economic Dynamics & Control, 151, 104665. Amsterdam: Elsevier.
[4]. Heutel, G. (2012). How should environmental policy respond to business cycles? Optimal policy under persistent productivity shocks. Review of Economic Dynamics, 15(2), 244–264.
[5]. Horvath, M. (2000). Sectoral shocks and aggregate fluctuations. Journal of Monetary Economics, 45(1), 69–106.
[6]. Nordhaus, W. D. (2014). A Question of Balance:Weighing the options on global warming policies. Yale University Press.
[7]. Paoli, B. D., & Paustian, M. (2017). Coordinating monetary and macroprudential policies. Journal of Money, Credit and Banking, 49(2–3), 319–349.
[8]. Papageorgiou, C., Saam, M., & Schulte, P. (2017). Substitution between Clean and Dirty Energy Inputs: A Macroeconomic Perspective. The Review of Economics and Statistics, 99(2), 281–290.
[9]. Rogelj, J., Den Elzen, M., Höhne, N., & Fransen, T. (2016). Paris Agreement climate proposals need a boost to keep warming well below 2 °C. Nature, 534(7609), 631–639.