


1. Introduction
In the burgeoning era of digital transactions, the emergence of cryptocurrencies like Bitcoin has redefined the dynamics of investment ecosystems. While traditional commodities, such as copper, have long been used to gauge market stability and economic health, the rapid rise and inherent volatility of Bitcoin present both a challenge and an opportunity for discerning investors. Bitcoin Options Bitcoin (Satoshi Nakamoto 2008) is a P2P digital currency. It uses proof-of-work to record a public history of transactions [1]. Peer-to-peer networks imply a decentralized electronic transaction system. Bitcoin does not have a specific issuer; instead, it is generated by network nodes based on a specific algorithm, with a total fixed quantity of 21 million. It's expected to be fully issued by 2140. In recent years, the unofficial digital currency system, represented by Bitcoin, has steadily grown in transaction volume. As an emerging investment class, Bitcoin assets have caught the attention of an increasing number of investors. With the growth of the Bitcoin market and its unique high volatility, the demand for its derivatives, like options, is also growing. At 5:00 PM Central Time on December 10, Bitcoin futures began trading on the Chicago Board Options Exchange (CBOE). Within a week of its listing, Bitcoin futures saw dramatic fluctuations, triggering multiple circuit breakers. A week later, the Chicago Mercantile Exchange (CME) issued Bitcoin futures contracts. On January 13, 2020, at 3:00 PM, the CME opened trading for Bitcoin options, with a trading volume of $2.19 million on the first day. In 2015, the CFTC classified Bitcoin as a commodity, arguing that it's interchangeable with traditional commodities and that each Bitcoin holds the same value. Given that Bitcoin is recognized as a commodity, this article will study Bitcoin options in comparison to copper commodity options, observing the similarities and differences in their implied volatility smiles.
In the 1960s and 70s, financial markets began to be analyzed and explained using more rigorous methods, such as Markowitz [2], Sharpe and Lintner [3]. Building on earlier research, Black, Scholes, and Merton [4] constructed the option pricing framework. The model assumes that the continuous compounded returns of stocks follow a log-normal distribution with constant volatility. Historical volatility can be determined through historical data and then input into mathematical formulas to determine option prices. By plugging the market price of an option back into the pricing formula, one can deduce the market's evaluation of the asset's volatility [5]—this is the option's implied volatility. It's often used in derivative option pricing, risk hedging, or investment decisions. However, LAUTERBACH, B., & SCHULTZ, P. warned that assuming price volatility and the risk-free rate remain constant throughout an option's duration [6], along with other factors, can lead the option prices to deviate from the predicted distribution. Hull and White found that when the volatility of call option prices is unrelated to the price, prices inferred have estimation biases: at-the-money options are overvalued while out-of-the-money or in-the-money options are undervalued. This phenomenon is known as the implied volatility smile [7]. Rubinstein found that the volatility "smile" has term structure, meaning the "smile effect" systematically depends on the option's expiration and is more evident in short-term options than in long-term ones [8].
For the BS model, the option price is determined by factors like the current asset price, volatility, risk-free rate, option expiration, and strike price. Changes in these variables will result in changes in the option price, leading to investment risk in the option. Greeks are often used as indicators to measure financial risk, common ones being Delta, Gamma, Theta, Vega, and Rho. Each letter represents the impact of different variables on the option price. For instance, Delta measures the change in the option price due to a change in the asset price. The Greeks can effectively manage financial risks.
Contribution & Importance: This study bridges the knowledge gap in the market by contrasting the volatility dynamics of a pioneering digital asset with a traditional tangible commodity. As markets evolve and diversification strategies become paramount, understanding the risk perceptions between such distinct assets becomes crucial for both individual and institutional investors. Moreover, by analyzing their respective Greeks and their implied volatility, we provide actionable insights that can potentially shape future investment strategies, fostering optimal portfolio diversification. In a world transitioning to digital realms, this research underscores the importance of synergizing the old with the new, guiding investors through the intricacies of modern investment landscapes.
2. Data Specification
This article empirically compares Bitcoin options and copper options. The transaction data for Bitcoin in this study is sourced from Deribit, a Bitcoin options trading platform. The empirical data utilized includes the daily closing prices of Bitcoin and Bitcoin options, spanning from December 2016 to February 2020. On the other hand, the trading data for copper options is sourced from the Shanghai Futures Exchange, with the sample period identical to that of Bitcoin options.
To simulate and analyze, this study employs the classic Black-Scholes (BS) model to derive the implied volatility of options from the daily closing prices of copper and Bitcoin options. We have chosen the implied volatilities of Bitcoin and copper options that are set to expire in 14 days within the timeframe of November 15, 2019, to November 29, 2019. During this period, ten trading days of data were used, excluding weekend trading data.
We selected these periods for the following reasons:
1) A comparison of the price trends of Bitcoin and copper futures within the sample period reveals that the Bitcoin price trend became relatively stable towards the end of 2019 (as depicted in Figure 1), while the copper futures price remained stable throughout. Given this, the time frame with the highest congruence in market trend was chosen, which corresponded to a stable oscillation period. Considering the high volatility in Bitcoin options trading, we finally selected the option data with the most substantial information content within the specified range.
2) The selected data set was taken some time after the options had been listed, ensuring stable market trading volumes and ample market liquidity. This is conducive to enhancing the accuracy and rigor of the comparative study.
Following established literature practices, we made selective adjustments to the raw option data to minimize the influence of liquidity, market noise, and pricing anomalies:
1) We excluded data that violated the theoretical price constraints of options.
2) The remaining term was set at half a month (specifically, 14 days). Options with very short terms contain minimal time value or volatility information. Additionally, the selected copper options include out-of-the-money options. As the expiration date of an out-of-the-money call option approaches, if the price of the underlying asset remains below the strike price, the value of the option can depreciate significantly.
3) Copper options traded on the Shanghai Futures Exchange exclude weekends [9]. Since this study aims to empirically compare the two types of options and to depict the market's evolution over time, data from Bitcoin market trades on Saturdays and Sundays were also excluded.
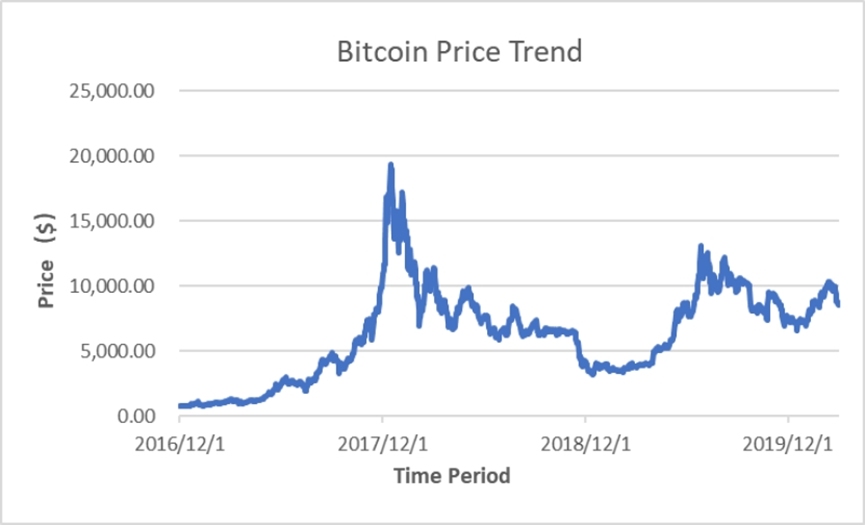
Figure 1: Evolution of Bitcoin price over time
3. Methodology
3.1. BSM
In the early 1970s, three university professors Fisher Black, granted Myron Scholes, Robert Merton in the European-style stock option pricing to obtain a major breakthrough, the invention of the famous BSM model, which is still widely used option pricing standards. However, strict model assumptions and subjectivity in parameter selection often lead to models with volatility smiles, skew, smirks, and leptokurtic behavior of the return distributions. These key features are not captured by the simplest Black-Scholes-Merton formula. Nevertheless, the Black-Scholes-Merton option pricing model is still considered the cornerstone of option pricing research [10]. We also adopt this traditional model to study the key features of option pricing in the cryptocurrency derivatives market, particularly the Bitcoin options market, and in the Chinese copper options market. The specific model is as follows:
\( c = SN({d_{1}}) - K{e^{-rτ}}N({d_{2}}) \)
\( {d_{1}} = \frac{ln{(S/K)}+(r+({σ^{2}}/2))τ}{σ\sqrt[]{τ}} \)
\( {d_{2}} = {d_{1}} - σ\sqrt[]{τ} \)
In the equation c is the call option price, S is the bitcoin price, K is the bitcoin option strike price, r is the risk-free rate, τ is the remaining time to expiration, σ is the volatility of the option return, and N (.) is the cumulative normal density function. This model can also estimate implied volatility through the recovery process and using the observed market price of the traded call option. By setting the model call price c to the observed market price CM, the implied volatility is then found.
3.2. Newton Raphson
The Newton Raphson method is a powerful numerical iteration technique for determining the roots of the equation g (y) = 0. To use the Newton Raphson method well, we need to set a starting point for the iteration first. In this study, the initial starting point for the Newton Raphson method was chosen based on Mannerist and Kohler's approach [11].
\( {σ_{0}} = \sqrt[]{\frac{2}{τ}‖ln{(\frac{S}{K}})+rτ‖} \)
The new reference point for each iteration is calculated by computing the tangent zeros of the previous reference point. The mathematical explanation is as follows.
The tangent equation of the function g(y) at the test value yj is:
\( g(y) ≈ g({y_{j}}) + {g^{ \prime }}({y_{j}})(y-{y_{j}}) + ⋯ . \)
The x-intercept of the tangent (i.e., g(y)=0) can be taken as the next approximation (yj+1) of the root
\( g({y_{j+1}}) = 0 =g({y_{j}}) + ({y_{j+1}} - {y_{j}}){g^{ \prime }}({y_{j}}) \)
This implies that
\( {y_{j+1}} = {y_{j}}-\frac{g({y_{j}})}{{g^{ \prime }}({y_{j}})} j = 0,1,2,3,⋯. \)
3.3. Greeks
Greeks are important indicators for portraying the characteristics of options, each Greek letter is used to measure a particular risk of an option, and this paper also examines the characteristics of Bitcoin options with the help of Greek letters
Delta :Indicates the amount of change in the option value resulting from a 1-unit change in the underlying price. The delta formula for a call option is as follows:
\( δ = N({d_{1}}) \)
Gamma :Indicates the change in delta brought about by a 1-unit change in the underlying price, and the Gamma formula is as follows:
\( γ = {N^{ \prime }}({d_{1}})\frac{1}{Sσ\sqrt[]{τ}} \)
Theta :Expressing the change in option value brought about by a 1-unit change in time, the Theta formula for a call option is as follows:
\( θ = -S{N^{ \prime }}({d_{1}})\frac{σ}{2\sqrt[]{τ}} - rK{e^{-rτ}}N({d_{2}}) \)
Rho :This refers to the sensitivity of the option price to changes in the risk-free rate, and the Rho formula for a call option is as follows:
\( ρ = Xτ{e^{-rτ}}N({d_{2}}) \)
Vega :Indicates the change in option value resulting from a 1-unit change in volatility. The volatility here is an expected volatility and is usually replaced by the historical volatility of the underlying. The formula is as follows:
\( Vega = S\sqrt[]{τ}{N^{ \prime }}({d_{1}}) \)
4. Figures and Tables
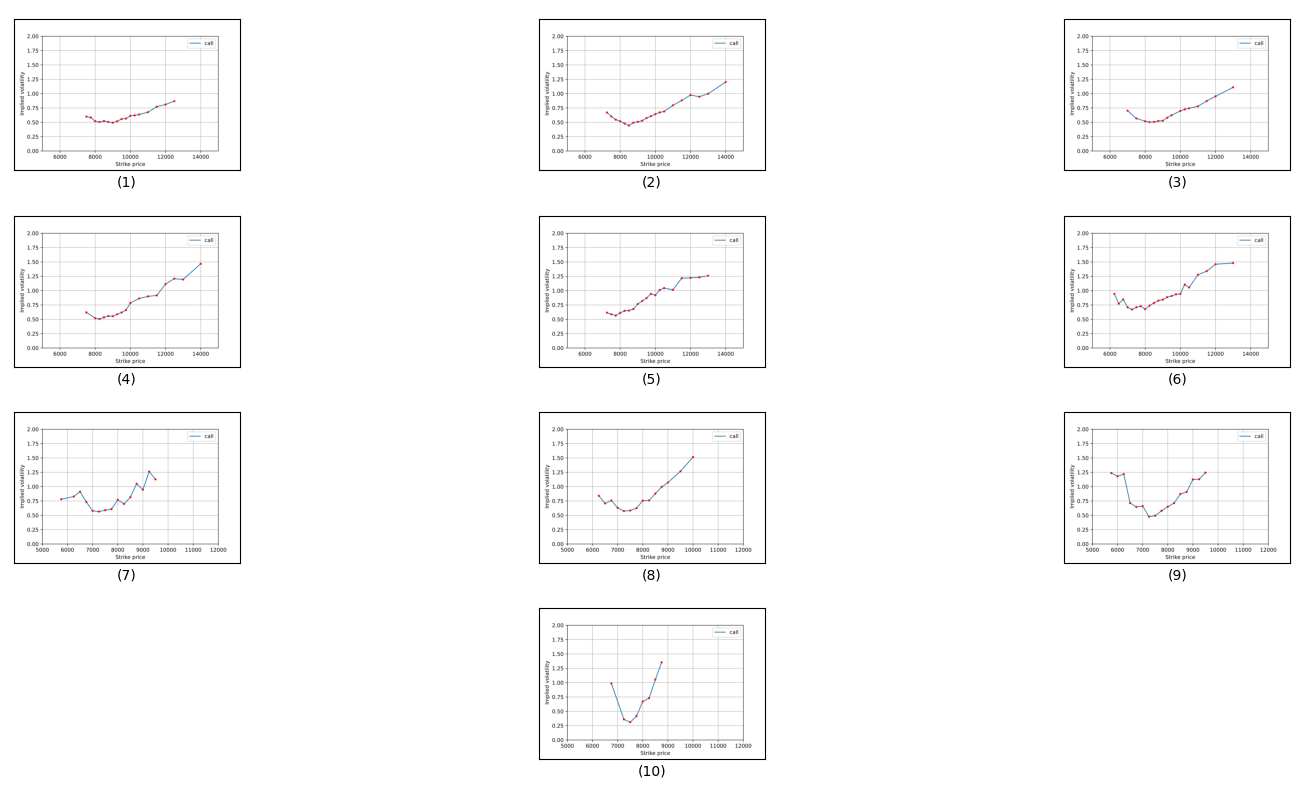
Figure 2: Volatility smile of bitcoin options
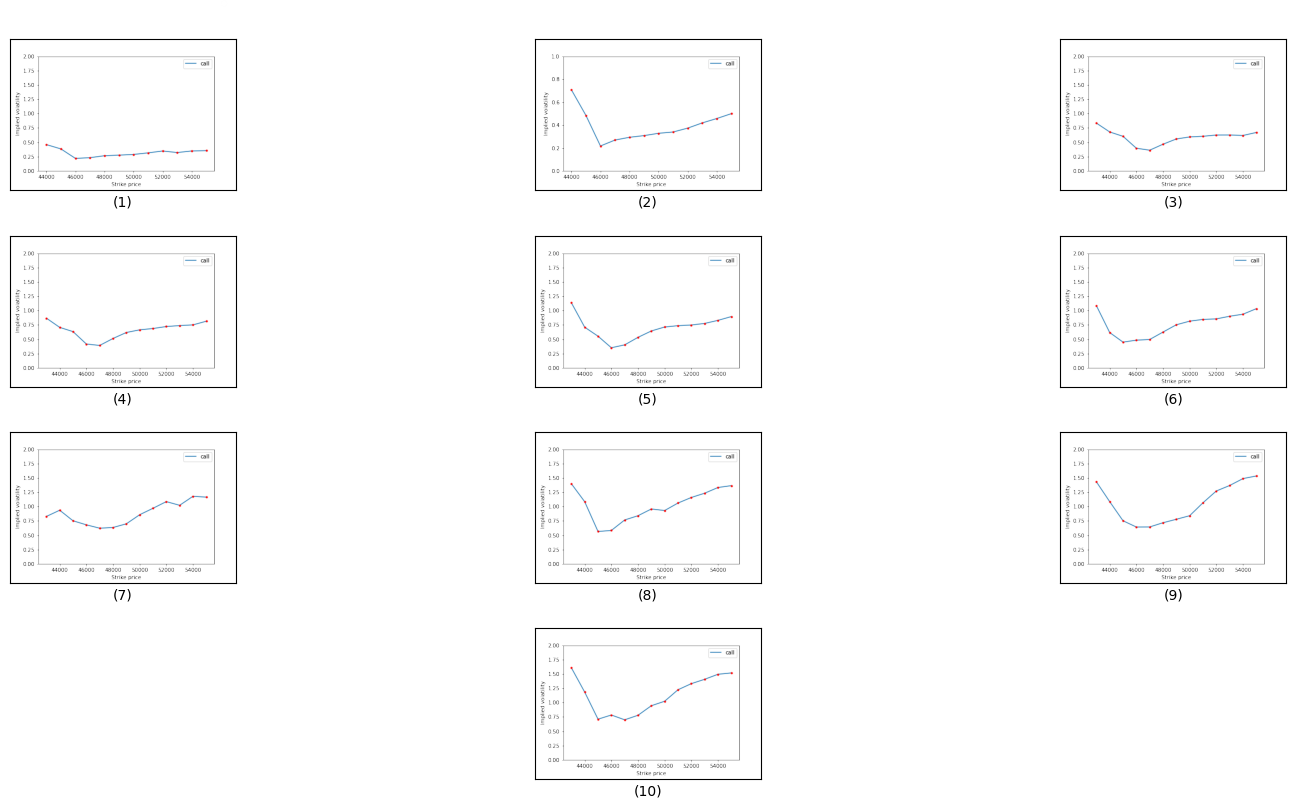
Figure 3: Volatility smile of Copper options
14-10 Days to maturity
From November 15th to 19th (Figs 1-3, first row), both Bitcoin and Copper options displayed intriguing volatility dynamics. Bitcoin options consistently showcased a U-shaped "smile" pattern, signifying higher implied volatilities at deep ITM and OTM strikes, with the peak volatilities on November 19th reaching 1.1105 and 0.7006 at the farthest OTM and ITM options respectively. In contrast, Copper, especially on November 15th and 19th, presented a skew towards the lower end of strike prices, peaking at an implied volatility of 0.8355 on November 19th for a 43000 strike. Over these days, Bitcoin's implied volatility largely increased, suggesting escalating market uncertainty or anticipated significant price movements. Concurrently, Copper's implied volatility displayed mixed movements; while it increased from November 15th to 18th, it exhibited diverging trends on the 19th, with the lower-end strike prices increasing and middle to upper-end somewhat stabilizing. The consistent high volatility for Bitcoin options compared to Copper indicates a market perception of Bitcoin being inherently more volatile and uncertain in the near term. This comparative analysis underscores a sharper market anticipation of major price movements for Bitcoin, while Copper's skew suggests expectations leaning towards an uptick in its prices.
9-7 Days to maturity
From November 20th to 22nd (Figs 4-6), Bitcoin options demonstrate an evolving and broadening volatility smile. On the 20th, the highest implied volatility of 1.4676 is seen at the farthest OTM option with a strike price of 14,000. As we progress to the 22nd, this volatility intensifies, peaking at 1.8019 for a strike price of 14,000, suggesting a heightening anticipation of price movement in the market. This upward trend also emerges within the core strikes, hinting at escalating market uncertainty. In contrast, the Copper options over these days display considerable inconsistency. On November 20th, the implied volatilities suggest a slight skew towards the lower end of strike prices, hitting a peak at 0.8684 for a 43,000 strike. But by the 22nd, a sharper skew has materialized with the highest volatility of 1.0870 at a 43,000 strike, revealing a steeper anticipated rise in Copper prices. This is in stark contrast to its previously observed mixed movements and highlights an evolving bullish sentiment.
4-Days to maturity
Upon scrutinizing the data for Bitcoin and Copper call options from the 25th to the 28th (Figs 7-10), leading up to the November 29th maturity date, alongside prior data trends, distinct observations surface. For Bitcoin, as we approach maturity, there's a marked transformation in implied volatility (IV). On the 25th, IV peaks for a strike price of 12000. However, by the 28th, such high volatility seems to have abated for comparable strike prices, indicating a potential decline in anticipated price fluctuations. This is consistent with typical behavior, as options often display diminishing volatility as they edge closer to their maturity date. Throughout these days, we consistently observe spikes in IV around the strike prices of 9500, 10000, and 13000, emphasizing persistent market unpredictability around these levels. The 28th presents a more confined range of strike prices, hinting at a possible market trend congealment, a pattern often seen as options approach expiration. In the Copper options space, there's a general upward trend in IV with ascending strike prices over these days, reflecting market expectations of pronounced price shifts at elevated levels. A consistent range of strike prices is maintained for Copper from the 25th to the 28th, denoting stable trading interest. However, a notable transition occurs: the IV for a 43000 strike price on the 25th stands at 0.8278, but skyrockets to 1.6069 by the 28th. Such volatility surge, especially as we inch closer to the maturity date, indicates dynamic market sentiments and potentially anticipates crucial price movements for Copper leading up to November 29th.
Delta
As Bitcoin and Copper options approached maturity, their delta values increased, signifying a market shift towards deeper in-the-money positions. Bitcoin’s delta values rose from 0.848 to 0.973 between the 15th and 28th, while Copper's increased from 0.816 to 0.907. Notably, Bitcoin’s delta values converged closer to 1, suggesting a stronger market consensus about its future. In contrast, Copper’s values displayed greater variability, such as on the 25th, with Bitcoin ranging between 0.968 and 0.616 and Copper varying more broadly from 0.881 to 0.125. By the 28th, Bitcoin showed a marked delta decrease, whereas Copper presented a diverse sentiment. In essence, Bitcoin's delta showcased a more consistent market outlook, while Copper revealed varied market expectations as the maturity date neared.
Gamma
Between November 15 and 28, 2019, BTC's Gamma varied notably from 0.000235693 to 0.001326565, showing significant options-related shifts. In contrast, Copper's Gamma, after starting with a missing value, peaked at 0.000177961 and ended at 0.000105337, indicating a more stable options market compared to BTC.
Theta
Throughout the given period, Copper generally had larger negative theta values in comparison to BTC. While both assets exhibited negative trends in their theta values, the magnitude and volatility in Copper's theta were notably more pronounced. It underscores a period of heightened activity or sensitivity for Copper compared to BTC during this timeframe.
Vega
In November 2019, BTC's vega ranged from 669.757 to 4.498, highlighting its varying sensitivity to market volatility. Conversely, copper's vega exhibited a broader range, from 3,664.137 to 215.746, suggesting greater volatility sensitivity. This indicates that copper's options pricing may have been more unpredictable in relation to volatility shifts compared to BTC during that period.
Rho
Throughout the sampled dates in November 2019, Copper consistently exhibited higher `rho` values relative to BTC. While both assets displayed fluctuations in their `rho` values, the amplitude and volatility in Copper's `rho` were distinctly more prominent. This highlights a period of elevated sensitivity or activity for Copper in comparison to BTC.
5. Conclusion
In November 2019, the volatility dynamics of Bitcoin and Copper options unveiled a multifaceted tale of how the market perceives risks associated with a leading digital asset versus a fundamental commodity. The consistent U-shaped "smile" pattern in Bitcoin's options emphasized the market's anticipation of greater price movements and inherent volatility, indicating a higher risk associated with digital assets in the short term, while its delta nearing 1 highlights a converging market outlook on its future price, emphasizing its speculative nature. Copper, on the other hand, with its fluctuating implied volatilities and broader vega range, aligns with tangible economic demands, offering insights into real-world demand-supply dynamics. Furthermore, Copper's larger negative theta values and higher rho values indicate a period of heightened activity, pointing to its pronounced sensitivity to factors like time decay and interest rate changes.
This comparative landscape directly speaks to the risk perception dynamics. Digital assets, represented by Bitcoin, are consistently seen as more volatile, bearing the hallmarks of speculative nature and technological shifts. In contrast, Copper, as a tangible asset, displays volatility anchored more in real-world demand-supply dynamics, making it a barometer of tangible economic activities. Thus, the market perceives the risks of Bitcoin as being more speculative and responsive to short-term changes, while Copper's risks align with broader economic shifts.
From an investment perspective, these volatility nuances can be instrumental for diversification strategies. Recognizing Bitcoin's heightened short-term volatility suggests that it offers both potential high rewards and associated risks. Copper, with its grounding in tangible economic indicators, offers more stability. Consequently, an investor might balance the speculative allure of Bitcoin with the foundational stability of Copper, ensuring both potential growth and hedging against overarching economic trends in a diversified portfolio.
Acknowledgement
Fu Chai, Mingzhi Fei, Neng Chai, and Xinyan Zhang contributed equally to this work and should be considered co-first authors.
References
[1]. Nakamoto, Satoshi, and A. Bitcoin. "A peer-to-peer electronic cash system." Bitcoin.–URL: https://bitcoin. org/bitcoin. pdf 4.2 (2008): 15.
[2]. Markowitz, Harry. "The utility of wealth." Journal of political Economy 60.2 (1952): 151-158.
[3]. Sharpe, William F. "Capital asset prices: A theory of market equilibrium under conditions of risk." The journal of finance 19.3 (1964): 425-442.
[4]. Black, F., & Scholes, M. (1973). The Pricing of Options and Corporate Liabilities. Journal of Political Economy, 81(3), 637–654. doi:10.1086/260062
[5]. Mayhew, S. (1995). Implied Volatility. Financial Analysts Journal, 51(4), 8–20. doi:10.2469/faj.v51.n4.1916
[6]. LAUTERBACH, B., & SCHULTZ, P. (1990). Pricing Warrants: An Empirical Study of the Black-Scholes Model and Its Alternatives. The Journal of Finance, 45(4), 1181–1209. doi:10.1111/j.1540-6261.1990.tb02432.x
[7]. HULL, J., & WHITE, A. (1987). The Pricing of Options on Assets with Stochastic Volatilities. The Journal of Finance, 42(2), 281–300. doi:10.1111/j.1540-6261.1987.tb02568.x
[8]. RUBINSTEIN, M. (1985). Nonparametric Tests of Alternative Option Pricing Models Using All Reported Trades and Quotes on the 30 Most Active CBOE Option Classes from August 23, 1976 through August 31, 1978. The Journal of Finance, 40(2), 455–480. doi:10.1111/j.1540-6261.1985.tb04967.x
[9]. Zulfiqar, Noshaba, and Saqib Gulzar. "Implied volatility estimation of bitcoin options and the stylized facts of option pricing." Financial Innovation 7 (2021): 1-30.
[10]. Rebonato R (2004) Volatility and correlation: the perfect hedger and the fox, 2nd edn. Wiley Online Library, New York. https://doi.org/10.1002/9781118673539
[11]. Manaster S, Koehler G (1982) The calculation of implied variances from the Black Scholes Merton model: a note. J Finance 37:227–230
Cite this article
Chai,F.;Fei,M.;Chai,N.;Zhang,X. (2024). Volatility Juxtaposition: Deciphering Market Risk Perceptions Between Bitcoin and Copper Options . Advances in Economics, Management and Political Sciences,82,246-254.
Data availability
The datasets used and/or analyzed during the current study will be available from the authors upon reasonable request.
Disclaimer/Publisher's Note
The statements, opinions and data contained in all publications are solely those of the individual author(s) and contributor(s) and not of EWA Publishing and/or the editor(s). EWA Publishing and/or the editor(s) disclaim responsibility for any injury to people or property resulting from any ideas, methods, instructions or products referred to in the content.
About volume
Volume title: Proceedings of the 2nd International Conference on Financial Technology and Business Analysis
© 2024 by the author(s). Licensee EWA Publishing, Oxford, UK. This article is an open access article distributed under the terms and
conditions of the Creative Commons Attribution (CC BY) license. Authors who
publish this series agree to the following terms:
1. Authors retain copyright and grant the series right of first publication with the work simultaneously licensed under a Creative Commons
Attribution License that allows others to share the work with an acknowledgment of the work's authorship and initial publication in this
series.
2. Authors are able to enter into separate, additional contractual arrangements for the non-exclusive distribution of the series's published
version of the work (e.g., post it to an institutional repository or publish it in a book), with an acknowledgment of its initial
publication in this series.
3. Authors are permitted and encouraged to post their work online (e.g., in institutional repositories or on their website) prior to and
during the submission process, as it can lead to productive exchanges, as well as earlier and greater citation of published work (See
Open access policy for details).
References
[1]. Nakamoto, Satoshi, and A. Bitcoin. "A peer-to-peer electronic cash system." Bitcoin.–URL: https://bitcoin. org/bitcoin. pdf 4.2 (2008): 15.
[2]. Markowitz, Harry. "The utility of wealth." Journal of political Economy 60.2 (1952): 151-158.
[3]. Sharpe, William F. "Capital asset prices: A theory of market equilibrium under conditions of risk." The journal of finance 19.3 (1964): 425-442.
[4]. Black, F., & Scholes, M. (1973). The Pricing of Options and Corporate Liabilities. Journal of Political Economy, 81(3), 637–654. doi:10.1086/260062
[5]. Mayhew, S. (1995). Implied Volatility. Financial Analysts Journal, 51(4), 8–20. doi:10.2469/faj.v51.n4.1916
[6]. LAUTERBACH, B., & SCHULTZ, P. (1990). Pricing Warrants: An Empirical Study of the Black-Scholes Model and Its Alternatives. The Journal of Finance, 45(4), 1181–1209. doi:10.1111/j.1540-6261.1990.tb02432.x
[7]. HULL, J., & WHITE, A. (1987). The Pricing of Options on Assets with Stochastic Volatilities. The Journal of Finance, 42(2), 281–300. doi:10.1111/j.1540-6261.1987.tb02568.x
[8]. RUBINSTEIN, M. (1985). Nonparametric Tests of Alternative Option Pricing Models Using All Reported Trades and Quotes on the 30 Most Active CBOE Option Classes from August 23, 1976 through August 31, 1978. The Journal of Finance, 40(2), 455–480. doi:10.1111/j.1540-6261.1985.tb04967.x
[9]. Zulfiqar, Noshaba, and Saqib Gulzar. "Implied volatility estimation of bitcoin options and the stylized facts of option pricing." Financial Innovation 7 (2021): 1-30.
[10]. Rebonato R (2004) Volatility and correlation: the perfect hedger and the fox, 2nd edn. Wiley Online Library, New York. https://doi.org/10.1002/9781118673539
[11]. Manaster S, Koehler G (1982) The calculation of implied variances from the Black Scholes Merton model: a note. J Finance 37:227–230