


1. Introduction
The concept of diversification strategy was first proposed by the famous American strategist Ansoff in his "Diversification Strategy". He believes diversification strategy refers to a development strategy in which an enterprise simultaneously operates more than two kinds of products or services with different basic economic uses [1]. It is one of the most important ways of enterprise strategic layout and plays an important role in enterprises occupying and developing new markets and effectively avoiding risks. However, recently, Gree Group, which is undergoing a strategic transformation through diversification, unexpectedly fell out of the Fortune 500 rankings due to declining performance. It can be seen that not all enterprises can benefit from the diversification strategy, and some enterprises' performance declines or even verges of bankruptcy because of the diversification strategy.
In academic circles, there is no unified consensus on the relationship between diversification strategy and firm performance. Existing views can be roughly divided into four categories: positive relationship, reverse relationship, non-existent relationship, and nonlinear correlation.
Some scholars believe that a diversification strategy can improve the performance of enterprises and bring benefits to enterprises. Weston, J.F. et al., proposed that companies adopting diversification strategies have higher economic performance than other companies [2]. Zhou Qiang et al. believe that enterprises adopting diversified strategies can gain benefits brought by synergies, such as information advantages and economies of scale from multiple product markets [3].
Some scholars believe that diversification strategy will drag down the performance of enterprises and bring negative effects to enterprises. Comment, R. et al., believe that the higher the degree of diversification, the lower the return rate of stock prices [4]. Zhou Shancheng believes that resources are dispersed which may lead to the decline of the original core competitiveness of the enterprise [5].
Some scholars believe that there is no relationship between diversification strategy and corporate performance. Gort, M. argued that there was no correlation between the degree of corporate diversification and corporate performance [6].
Some other scholars believe that there is an optimal degree of diversification, exceeding or below the optimal degree of diversification will lead to the decline of corporate performance: Markides, C.C. pointed out that the relationship between corporate performance and diversification strategy is a U-shaped [7].
Based on introducing the theory of diversification strategy, including the diversification strategy performance evaluation methods and Diversity dominates classification, this paper will take the relationship between Gree Group's diversification strategy and corporate performance as an example, and analyze corporate performance from the perspectives of financial indicators, Tobin's Q value and share of revenue.Through our analysis we draw the conclusion that Gree's diversification strategy did not play a good role in improving corporate performance
2. Performance Evaluation of Enterprises with Diversified Strategies
The performance of enterprises under a diversification strategy is one of the most important factors to evaluate the effectiveness of the strategy. This paper adapts two diversification strategy performance evaluation methods which is often used in academic circle.
The first is to evaluate enterprise performance through the combination of financial indicators and diversified time points. Jiang Fan evaluated the corporate performance of Yunnan Baiyao during its diversification strategy through financial indicators such as profitability and solvency [8].
The second is to measure the performance by calculating Tobin’s Q value of the enterprise. Tobin, Q. et al. concluded that Tobin’s Q value of diversified companies is lower than that of specialized companies, and the value created by diversified companies is relatively low [9].
3. Analysis of the Diversified Strategies of Gree
Zhuhai Gree Electric Appliance Co., LTD. (hereinafter referred to as Gree ), founded in 1991, is an international appliance enterprise integrating R&D, production, sales, and service. It has three brands, Gree, TOSOT, and Jinghong, and is mainly engaged in household air conditioners, central air conditioners, air energy water heaters, mobile phones, household appliances, refrigerators, and other products.
3.1. Gree Diversification Strategy Classification
The whole diversification strategy process of Gree, it can be divided into related diversification and non-related diversification in two ways:
(1) Unrelated diversification:
Unrelated diversification refers to the strategy of an enterprise to enter a field that is not related to the current industry and market. Gree Group's unrelated diversification mainly includes real estate, finance, medical health, mobile phones, and new energy industries.
(2) Related diversification:
Relevant diversification refers to the strategy of an enterprise to enter a related industry or market based on its existing business or market. Gree Group's related diversification mainly includes intelligent equipment, household appliances, and other industries.
3.2. Performance Analysis of Diversification Strategy based on Financial Indicators
This paper selects the financial data of Gree Electric Appliances from 2000 to 2022 to evaluate the corporate performance of Gree Electric Appliances under the diversification strategy from three aspects: profitability, solvency, and operating capacity.
(1) Profitability
Profitability refers to the ability of enterprises to obtain profits. This paper analyzes the profitability of enterprises by selecting four indicators: GPM(gross profit margin), ROE(return on equity), sales growth rate, and EPS(earning per share) growth rate.
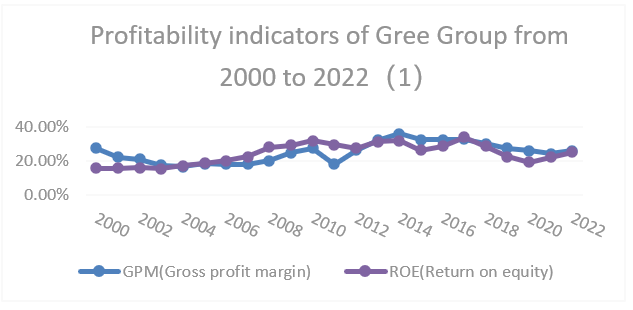
Figure 1: Profitability indicators of Gree Group from 2000 to 2022(1)
It can be seen from Figure 1 that the variation trend of ROE is consistent with that of GPM on the whole, and the variation trend of ROE is mainly analyzed here. ROE showed an overall upward trend from 2000 to 2010 (a rapid upward trend from 2007 to 2008). The main reason is that before 2010, Gree Group mainly focused on the development of air conditioning industry, and its diversification is also related to existing production lines such as refrigerators and washing machines. This makes the ROE of Gree Group stable. In addition, ROE showed a rapid upward trend from 2015 to 2017 and began to decline overall from 2017 to 2020. Since Gree launched the smart home product line in 2015 and entered the retail appliance industry in 2017, the ROE has increased. However, due to the intensification of market competition, the ROE has declined.
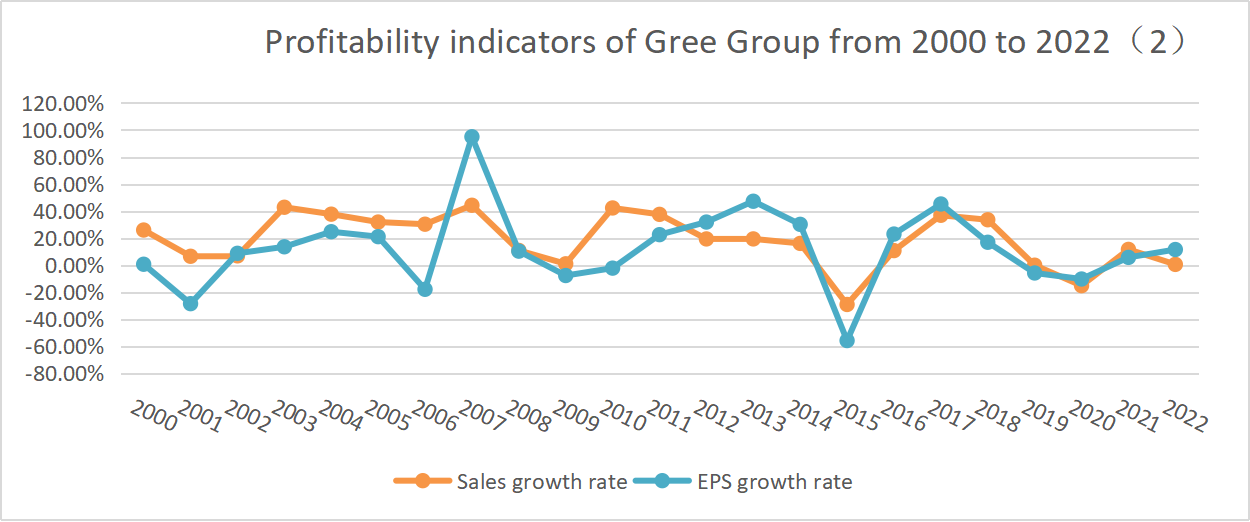
Figure 2: Profitability indicators of Gree Group from 2000 to 2022(2)
As can be seen from Figure 2, the change trends of EPS growth rate and sales growth rate are similar. Here, we mainly focus on the EPS growth rate. From 2006 to 2007 EPS growth rate increased significantly, Gree said that the main reason is the company's main business operating momentum. From 2013 to 2015, the EPS growth rate showed a sharp decline, mainly because Gree began to enter the pharmaceutical and financial fields after 2013, and entered the mobile phone industry in 2015. As an unrelated diversified field, the company has a large span between industries and lacks relevant experience, resulting in poor overall performance. Between 2015 and 2017, the overall EPS growth rate rebounded to a higher level, mainly due to the growth of home appliances and smart homes as related diversified industries.
In general, unrelated diversification has a negative impact on profitability, while related diversification has a more positive impact.
(2) Operational capacity
Operating capacity refers to the ability of an enterprise to use its assets to earn profits. In this paper, inventory turnover, receivable turnover, and total asset turnover are selected to analyze the operating capacity of enterprises.
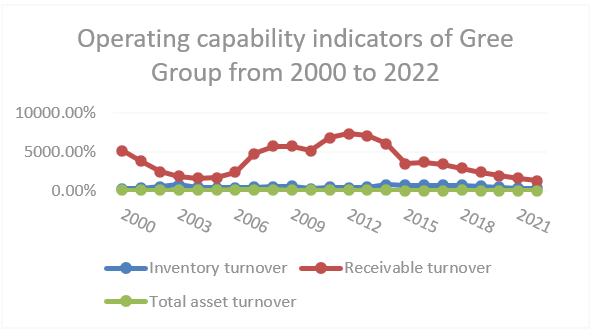
Figure 3: Operating capability indicators of Gree Group from 2000 to 2022
It can be seen from Figure 3 that receivable turnover changes greatly, while inventory turnover and asset turnover change slightly, so this paper focuses on the trend of receivable turnover. Although there was a downward trend from 2000 to 2004, it was generally maintained at a high level. In particular, during the period from 2004 to 2014, the receivable turnover increased significantly under the related diversification of smart equipment and household appliances.
It shows that both related and non-related diversification can improve the operation ability of enterprises, but the role of related diversification is more obvious.
(3) Solvency
Solvency refers to the ability of a business to repay its long-term and short-term debts with its assets. This paper mainly selects two indicators, the Current ratio and Asset-liability ratio, to analyze the solvency of enterprises.

Figure 4: Solvency indicators of Gree Group from 2000 to 2022
As can be seen from Figure 4, the asset-liability ratio of Gree has always been high and has shown a downward trend since 2011. The current ratio is around 1-1.4 and has shown a gradual upward trend since 2015. After the implementation of the diversification strategy, the solvency of Gree on the whole shows a better and better trend, indicating that the diversification strategy transformation has a positive impact on the solvency.
In general, through the analysis of Gree's financial indicators, we can draw a conclusion: the diversification strategy has improved the solvency and operational ability of the enterprise, but the role of related diversification is stronger. Related diversification plays a positive role in profitability and industry development, while non-related diversification plays a negative role.
3.3. Performance Analysis of Diversification Strategy based on Tobin’s Q
Tobin's Q is the ratio of the market value of capital to its replacement cost.
Its calculation formula is as follows:
Tobin’s Q = Market value of the enterprise ÷ total assets (1)
When Q is less than 1, managers will tend to establish enterprises through acquisition to achieve enterprise expansion. When Q is greater than 1, the investment demand of enterprises increases.
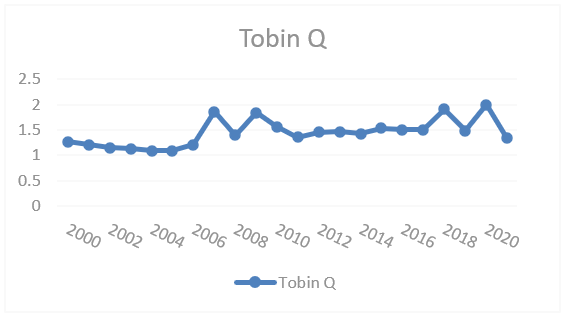
Figure 5: Tobin Q of Gree Group from 2000 to 2021
As can be seen from Figure 5, Tobin's Q value showed a downward trend in the three stages from 2000 to 2005, 2007 to 2008 and 2009 to 2011, mainly due to the influence of irrelevant diversification strategies. From 2011 to 2018, the Tobin’s Q value of the enterprise showed an upward trend, and the enterprise continuously improved the development of the original industry while implementing the relevant diversification strategy, which improved the operating performance of the company. Since 2018, enterprises have been affected by non-diversification strategies, especially the new energy industry, and Tobin's Q value has shown an overall downward trend.
3.4. Performance Analysis of Diversification Strategy based on Share of Revenue
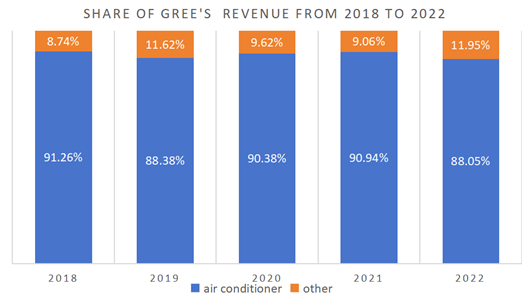
Figure 6: Share of Gree's revenue from 2018 to 2022
As can be seen from Figure 6, since the past five years (2018-2022), Gree has experienced slow diversification development. Although the proportion of air conditioning business revenue has declined, it still accounts for more than 80% of the total revenue, and the total income of "other" accounts for less than 20%. This means that Gree Electric Appliances is highly dependent on a single item of air conditioning, and behind this is the failure of Gree’s diversification strategy.
4. Suggestions for Gree's Diversified Strategic Development
Through the analysis of Gree's performance under the diversification strategy, it can be found that Gree's diversification strategy has not brought great success to the company's performance. The main reasons can be divided into two aspects: First, the scale development of Gree's diversified strategy is slow, and the air conditioning business is still dominant. Second, non-related diversified industries have caused great damage to corporate performance.
In response to the above problems, Gree could consider take the following measures:
4.1. Consider Giving Up Some Unrelated Diversified Industries
Due to lack of experience and poor management, Gree mobile phone and new energy and other non-related diversified industries have had a negative impact on Gree's overall performance. Gree should give up development in these areas in time to avoid greater losses.
4.2. Make Use of Existing Production Lines, Vigorously Develop Related Diversified Industries
Under the trend of upgrading consumption and diversified and personalized customer demands, the multi-category small home appliance market has experienced explosive growth. Gree could consider utilizing its existing home appliance production lines and relevant experience to vigorously develop the small home appliance and smart home industry, fully leverage the synergy between industries, and expand market share.
4.3. Shift the Focus of Development and Reduce the Investment in the Air Conditioning Industry
The air conditioning industry has passed a period of rapid growth. The growth rate has shown a slowing trend. In China's first and second-tier cities, air conditioning is already in a saturated state, with most of the demand from replacement. Compared with the Midea, and Haier respectively devoted to the smart home, Gree has not explored a more clear second growth curve path in recent years; Gree needs to invest more in the development of other industries.
5. Conclusion
This paper discusses the relationship between diversification strategy and corporate performance with specific examples and evaluates corporate performance under the diversification strategy of Gree using financial indicators, Tobin's Q, and share of revenue. We draw a conclusion that the implementation effect of Gree's diversification strategy is not successful, the development scale of Gree's diversification is slow, and the irrelevant diversification strategy has a great negative effect on corporate performance. Gree could consider giving up the non-related diversified industries that are poorly operated in time and vigorously develop related diversified industries according to the existing production lines.
References
[1]. Ansoff, H.I. (1957) Diversification Strategy. Harvard Business Review
[2]. Weston, J.F. and ManSinghka, S.K. (1971) Tests of the Efficiency Performance of Conglomerate Firms. Journal of Finance, 34, 919-936.
[3]. Zhou, Q., Xie, S.-L. and Liu, F. (2014) Organizational Structure and Firm Performance of Diversified Firms—Based on Research in Sichuan and Chongqing. Journal of Chongqing Jiaotong University (Social Science Edition), No. 5, 51-54.
[4]. Comment, R. and Jarrel, G. (1995) Corporate Focus and Stock Returns. Journal of Financial Economics, 37, 67-87.
[5]. Zhou Shancheng(2006) Specialization Strategy and Diversification Strategy Choice Analysis Engineering Science and Technology II series; Economics and management science Enterprise economy; Sichuan Water Conservancy,2006.05
[6]. Gort, M. (1962) Diversification and Integration in American. Princeton University Press, Princeton, New Jersey.
[7]. Markides, C. C.(1995)Diversification, Restructuring and Economic Performance. Strategic Management Journal, 16, 101-118.
[8]. Jiang Fan(2023)Research on diversification Strategy based on financial Performance analysis -taking Yunnan Baiyao Group as an example Economy and Management Science Industrial Economy; Economics and Management Science Accounting; Rental and Sales Intelligence,2023.06 issue
[9]. Lang, I.H., Stulz, R.M. and Tobin, Q. (1994) Corporate Diversification and Firm Performance. Journal of Political Economy, 102, 1248-1280.
Cite this article
Li,Z. (2024). The Relationship Between Diversification Strategies and Corporate Financial Performance: Taking Gree Group as an Example. Advances in Economics, Management and Political Sciences,97,1-7.
Data availability
The datasets used and/or analyzed during the current study will be available from the authors upon reasonable request.
Disclaimer/Publisher's Note
The statements, opinions and data contained in all publications are solely those of the individual author(s) and contributor(s) and not of EWA Publishing and/or the editor(s). EWA Publishing and/or the editor(s) disclaim responsibility for any injury to people or property resulting from any ideas, methods, instructions or products referred to in the content.
About volume
Volume title: Proceedings of the 2nd International Conference on Financial Technology and Business Analysis
© 2024 by the author(s). Licensee EWA Publishing, Oxford, UK. This article is an open access article distributed under the terms and
conditions of the Creative Commons Attribution (CC BY) license. Authors who
publish this series agree to the following terms:
1. Authors retain copyright and grant the series right of first publication with the work simultaneously licensed under a Creative Commons
Attribution License that allows others to share the work with an acknowledgment of the work's authorship and initial publication in this
series.
2. Authors are able to enter into separate, additional contractual arrangements for the non-exclusive distribution of the series's published
version of the work (e.g., post it to an institutional repository or publish it in a book), with an acknowledgment of its initial
publication in this series.
3. Authors are permitted and encouraged to post their work online (e.g., in institutional repositories or on their website) prior to and
during the submission process, as it can lead to productive exchanges, as well as earlier and greater citation of published work (See
Open access policy for details).
References
[1]. Ansoff, H.I. (1957) Diversification Strategy. Harvard Business Review
[2]. Weston, J.F. and ManSinghka, S.K. (1971) Tests of the Efficiency Performance of Conglomerate Firms. Journal of Finance, 34, 919-936.
[3]. Zhou, Q., Xie, S.-L. and Liu, F. (2014) Organizational Structure and Firm Performance of Diversified Firms—Based on Research in Sichuan and Chongqing. Journal of Chongqing Jiaotong University (Social Science Edition), No. 5, 51-54.
[4]. Comment, R. and Jarrel, G. (1995) Corporate Focus and Stock Returns. Journal of Financial Economics, 37, 67-87.
[5]. Zhou Shancheng(2006) Specialization Strategy and Diversification Strategy Choice Analysis Engineering Science and Technology II series; Economics and management science Enterprise economy; Sichuan Water Conservancy,2006.05
[6]. Gort, M. (1962) Diversification and Integration in American. Princeton University Press, Princeton, New Jersey.
[7]. Markides, C. C.(1995)Diversification, Restructuring and Economic Performance. Strategic Management Journal, 16, 101-118.
[8]. Jiang Fan(2023)Research on diversification Strategy based on financial Performance analysis -taking Yunnan Baiyao Group as an example Economy and Management Science Industrial Economy; Economics and Management Science Accounting; Rental and Sales Intelligence,2023.06 issue
[9]. Lang, I.H., Stulz, R.M. and Tobin, Q. (1994) Corporate Diversification and Firm Performance. Journal of Political Economy, 102, 1248-1280.