


1. Introduction
One of the world’s most famous sports business leagues, the National Basketball Association (NBA), has over 400 players. It is found that some players are well paid for brilliant performance while some players are well paid for poor performance. For example, Collins has been on a downward trend over the last two seasons; in 71 games in 2022-23, Collins averaged just 13.1 PTS and 6.5 RPG while Collins still got over 25 million dollars, which was the worst performance since Collins’ rookie season [1]. The objective of this study is to identify and compare NBA players who perform poorly and have high player salaries to those who perform great and have high salaries to analyze what factors contribute to differences in salaries. This report will partly help players to purposefully improve their’ performance in certain areas of the sport to get a higher salary, and it will also help managers to evaluate the value of a player better to discover potential players in the player market.
Accordingly, the null hypothesis is the factors of game played (GP), minutes per game (MIN), field goal percentage (FG%), 3-point field goal percentage (FG3%), point per game (PTS), usage rate (USG), rebound rate (REBR), real plus/minus (RPM), nationality, ins fans do not affect great performance and poor performance with high salary. The alternative hypothesis is the factors mentioned above affect great performance and poor performance with high salaries [2].
This report begins by analyzing the league's salaries for the 2022-2023 season. The salaries higher than the mean salaries were defined as high salaries, and 33 players who performed well with high salaries and those who performed well with low salaries were selected through random sampling. Next, listing the match data, i.e., average point, field goal percentage… of 100 NBA players, finding out their respective nationalities, and the players' number of Instagram followers. Finally, to figure out factors that affect different players’ salaries.
2. Methodology
This report utilized Excel to process the data. This report collected salary data for 533 players for the season 2022-2023 [3], then eliminated 9 short-term contracts data and ended up with 524 valid data. By calculating the descriptive statistics of these data above, we obtained his mean: $8,138,313., mode: $1,836,090 and median: $3,518,080. We ended up with a skewed right distribution. Hence the report considered salaries greater than the mean as “High Salaries.” The Figure 1 and Table 1 are as follows.
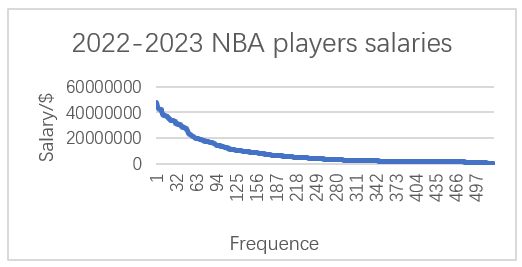
Figure 1: 2022-2023 NBA players' salaries
Table 1: Descriptive statistic of 524 NBA players’ salaries
Mean | 8138312.948 |
Median | 3518080 |
Mode | 1836090 |
Minimum | 140384 |
Maximum | 48070014 |
Count | 524 |
Of the 159 players defined as “High Salary”, we eliminated invalid data such as data of players without ins, data of players too young, etc., and finally got valid data of 103 players and analyzed the data as follows. According to Sisneros [4], RPM is an essential factor that contributes to court performance. Consequently, this report considered USG greater than and RPM greater than 0 as great performance players. Next, the samples above are divided into two groups: great performance with high-salaried players (G1) and poor performance with high-salaried players (G2). We distinguish player performance by whether the player's RPM value is greater than zero. Group 1 and Group 2 multiple linear regressions were first examined, whose independent variable was PTS, MIN, FG%, FG3%, and FT%, and the dependent variable was NBA players’ salaries. Then, the linear regressions of age, RPM, and Ins Fans contributed to salaries and were analyzed separately because what we want to find is which factors influence players' salaries. Some players have high salaries and perform well because they play well and can help the team win the game. The other parts of players who get high salaries but have bad on-court performance may probably benefit the team in another way (sharing experiences with young players, inspiring teammates, gathering fans for the team……). Then, the effect of nationality on salary was studied using a T-test [5]
3. Result
Table 2: High Salary and Great Performance Players Stats Multiple Linear Regression
Regression Statistics | ||||||||
Multiple R | 0.740366685 | |||||||
R Square | 0.548142828 | |||||||
Adjusted R Square | 0.505781218 | |||||||
Standard Error | 8574355.121 | |||||||
Observations | 71 | |||||||
ANOVA | ||||||||
df | SS | MS | F | Significance F | ||||
Regression | 6 | 5.70789E+15 | 9.51315E+14 | 12.93961277 | 1.61608E-09 | |||
Residual | 64 | 4.70525E+15 | 7.35196E+13 | |||||
Total | 70 | 1.04131E+16 | ||||||
Coefficients | Standard Error | t Stat | P-value | Lower 95% | Upper 95% | Lower 95.0% | Upper 95.0% | |
Intercept | -40869314.28 | 19172495.85 | -2.131663743 | 0.036879575 | -79170777.79 | -2567850.767 | -79170777.79 | -2567850.767 |
PTS | 609853.7972 | 239706.1566 | 2.54417244 | 0.013378066 | 130985.6999 | 1088721.895 | 130985.6999 | 1088721.895 |
MIN | 929725.3303 | 376819.3253 | 2.46729737 | 0.016299518 | 176942.1897 | 1682508.471 | 176942.1897 | 1682508.471 |
FG% | 432774.3529 | 216941.0185 | 1.994894078 | 0.050316413 | -615.1529161 | 866163.8588 | -615.1529161 | 866163.8588 |
FG3% | 149183.3813 | 140193.0626 | 1.064128129 | 0.291269163 | -130884.4571 | 429251.2198 | -130884.4571 | 429251.2198 |
FT% | 58019.27108 | 143300.5997 | 0.404878076 | 0.68691724 | -228256.5864 | 344295.1285 | -228256.5864 | 344295.1285 |
GP | -79326.46141 | 84649.64508 | -0.937115109 | 0.352222311 | -248433.5676 | 89780.64479 | -248433.5676 | 89780.64479 |
Result: In our research, according to Table 2, we found out that the player who performs well and are paid well is highly connected to their points per game, minutes per game, and field goal percentage; table 3 showed that Instagram fans have a positive relationship with Players’ salaries [6].
Table 3: High Salary and Great Performance Players Ins Fans Linear Regression
Regression Statistics | ||||||||
Multiple R | 0.347159294 | |||||||
R Square | 0.120519575 | |||||||
Adjusted R Square | 0.107773482 | |||||||
Standard Error | 11520714.31 | |||||||
Observations | 71 | |||||||
ANOVA | ||||||||
df | SS | MS | F | Significance F | ||||
Regression | 1 | 1.25499E+15 | 1.25499E+15 | 9.455413064 | 0.00301567 | |||
Residual | 69 | 9.15815E+15 | 1.32727E+14 | |||||
Total | 70 | 1.04131E+16 | ||||||
Table 3: (continued) | ||||||||
Coefficients | Standard Error | t Stat | P-value | Lower 95% | Upper 95% | Lower 95.0% | Upper 95.0% | |
Intercept | 25107542.39 | 1437852.974 | 17.46182875 | 5.05214E-27 | 22239104.2 | 27975980.59 | 22239104.2 | 27975980.59 |
Ins Fans | 0.224907622 | 0.07314151 | 3.074965539 | 0.00301567 | 0.078994302 | 0.370820942 | 0.078994302 | 0.370820942 |
Those players can help their team win games to attract more and more people to purchase shoes, clothes, and other team-related products, which can increase the value of the players’ team. As for players who perform badly but get good salaries according to Table 4,
Table 4: High Salary and Poor Performance Players Ins Fans Linear Regression
Regression Statistics | ||||||||
Multiple R | 0.400784596 | |||||||
R Square | 0.160628292 | |||||||
Adjusted R Square | 0.132649235 | |||||||
Standard Error | 7266624.437 | |||||||
Observations | 32 | |||||||
ANOVA | ||||||||
df | SS | MS | F | Significance F | ||||
Regression | 1 | 3.03148E+14 | 3.03148E+14 | 5.741018808 | 0.023013103 | |||
Residual | 30 | 1.58411E+15 | 5.28038E+13 | |||||
Total | 31 | 1.88726E+15 | ||||||
Coefficients | Standard Error | t Stat | P-value | Lower 95% | Upper 95% | Lower 95.0% | Upper 95.0% | |
Intercept | 7292980.909 | 1520256.782 | 4.797203337 | 4.1283E-05 | 4188202.356 | 10397759.46 | 4188202.356 | 10397759.46 |
Ins Fans | 2.054705798 | 0.85754153 | 2.396042322 | 0.023013103 | 0.303372352 | 3.806039244 | 0.303372352 | 3.806039244 |
We found out that their Instagram number is highly related to their salaries. This makes sense because the team can also benefit from a player who owns a lot of fans. While the on-court performance seemed to have an impact on these players’ salaries.
4. Discussion
Within the group of high performance with salaries players, according to Table 2, this report found out that there are two factors that are strongly related to player salaries: PTS and MIN. One factor’s P-value is near 0.05, which is closely related to player salaries, and there are three factors that are not related to player salaries: 3PT%, FT%, and GP. The three-point percentage may not influence a player's salary; it is not necessary for some good-performing players to have a high three-point percentage. Giannis Antetokounmpo is obviously one of the best players in the league; he scored an average of 31.1 points per game, he signed 6th highest contract in the league, he scored most of his points in the paint area, he seldom threw 3 points, which makes 3PT% not influence him to get high paid. Free Throw rate does not closely relate to player salaries because free throw is not the main reason for players to get good performances. Luka Doncic got 32.4 points on average last season, and he has the 17th-highest salary in the league, but he only has a 74.2% free throw shooting percentage. Games played do not influence high-performing players' salaries much because some of them struggle with dealing with injuries, which makes them not play many games. Karl-Anthony Towns has the 23rd highest salary in the league, but he only played 29 games last season because he had a serious calf injury; during that time, he could not play for his team. Players born in the US or not are not the factor that can influence players’ salary, which is shown in Table 5.
Table 5: High Salary and Great Performance Players Age Linear Regression
Foreign players | native players | |
Mean | 26067625.9 | 26647396.72 |
Variance | 1.20674E+14 | 1.63157E+14 |
Observations | 21 | 50 |
Hypothesized Mean Difference | 0 | |
df | 43 | |
t Stat | -0.193154914 | |
P(T<=t) one-tail | 0.42387356 | |
t Critical one-tail | 1.681070703 | |
P(T<=t) two-tail | 0.84774712 | |
t Critical two-tail | 2.016692199 |
This makes sense because nationality does not influence players' market value. There are many players who perform well and were born in the US, like Lebron James and Stephen Curry, etc. Also, there are many foreign players who perform well, like Luka Doncic, Nikola Jocic, ext. These players come from another great market size economy that could also bring a decent salary. International players from large economies have the advantage of receiving a wage premium brought on by foreign market effects [7]. Table 6 represents the number of RPMs positively related to the players' salaries.
Table 6: High Salary and Great Performance Players Real Plus/Minus Linear Regression
Regression Statistics | |||||||||||||||||||||||
Multiple R | 0.422096992 | ||||||||||||||||||||||
R Square | 0.178165871 | ||||||||||||||||||||||
Adjusted R Square | 0.166255231 | ||||||||||||||||||||||
Standard Error | 11136748.31 | ||||||||||||||||||||||
Observations | 71 | ||||||||||||||||||||||
ANOVA | |||||||||||||||||||||||
df | SS | MS | F | Significance F | |||||||||||||||||||
Regression | 1 | 1.85527E+15 | 1.85527E+15 | 14.95854779 | 0.000245948 | ||||||||||||||||||
Residual | 69 | 8.55787E+15 | 1.24027E+14 | ||||||||||||||||||||
Total | 70 | 1.04131E+16 | |||||||||||||||||||||
Coefficients | Standard Error | t Stat | P-value | Lower 95% | Upper 95% | Lower 95.0% | Upper 95.0% | ||||||||||||||||
Intercept | 18209746.66 | 2512924.125 | 7.24643712 | 4.74781E-10 | 13196600.2 | 23222893.12 | 13196600.2 | 23222893.12 | |||||||||||||||
RPM | 2277976.895 | 588985.4931 | 3.867628187 | 0.000245948 | 1102982.986 | 3452970.804 | 1102982.986 | 3452970.804 | |||||||||||||||
However, Table 7 shows that the salary of players is not related to age.
Table 7: High Salary and Great Performance Players Age Linear Regression
Regression Statistics | ||||||||
Multiple R | 0.159374636 | |||||||
R Square | 0.025400275 | |||||||
Adjusted R Square | 0.011275641 | |||||||
Standard Error | 12127728.35 | |||||||
Observations | 71 | |||||||
ANOVA | ||||||||
df | SS | MS | F | Significance F | ||||
Regression | 1 | 2.64497E+14 | 2.64497E+14 | 1.798296172 | 0.184316478 | |||
Residual | 69 | 1.01486E+16 | 1.47082E+14 | |||||
Total | 70 | 1.04131E+16 | ||||||
Coefficients | Standard Error | t Stat | P-value | Lower 95% | Upper 95% | Lower 95.0% | Upper 95.0% | |
Intercept | 12248160.12 | 10706945.94 | 1.143945266 | 0.256599439 | -9111612.586 | 33607932.82 | -9111612.586 | 33607932.82 |
Age | 485192.4167 | 361812.3565 | 1.341005657 | 0.184316478 | -236603.4849 | 1206988.318 | -236603.4849 | 1206988.318 |
For example, Stephen Curry has the highest salary in the league, but he is now over 35 years old. From the same table, it can be found that many players who perform well and earn high salaries are paid according to the number of Instagram fans they have. The number of followers on Instagram fans is positively correlated with the salary of players. It also found that for every additional 1 million social media followers a player had, Players tended to get nearly $400,000 more [8].
Within the group of poor performance with high salaries players, Tables 8 and 9 showed that all seven factors (Age, PTS, MIN, FG%, FG3%, FT% and RPM) that we found on ESPN Stats are not related to their salaries, one of the main reasons is their performance decreased after they signed a nice contract.
Table 8: High Salary and Poor Performance Players Real Plus/Minus Linear Regression
Regression Statistics | ||||||||
Multiple R | 0.191529054 | |||||||
R Square | 0.036683378 | |||||||
Adjusted R Square | 0.004572824 | |||||||
Standard Error | 7784667.697 | |||||||
Observations | 32 | |||||||
ANOVA | ||||||||
| df | SS | MS | F | Significance F | |||
Regression | 1 | 6.92312E+13 | 6.92312E+13 | 1.142408763 | 0.293669101 | |||
Residual | 30 | 1.81803E+15 | 6.06011E+13 | |||||
Total | 31 | 1.88726E+15 | ||||||
Coefficients | Standard Error | t Stat | P-value | Lower 95% | Upper 95% | Lower 95.0% | Upper 95.0% | |
Intercept | 11530211.13 | 2545704.834 | 4.52928045 | 8.76924E-05 | 6331188.27 | 16729234 | 6331188.27 | 16729234 |
RPM | 960172.9358 | 898335.7797 | 1.068835237 | 0.293669101 | -874473.4835 | 2794819.355 | -874473.4835 | 2794819.355 |
Table 9: High Salary and Poor Performance Players Stats Multiple Linear Regression
Regression Statistics | ||||||||
Multiple R | 0.434664773 | |||||||
R Square | 0.188933465 | |||||||
Adjusted R Square | -0.005722503 | |||||||
Standard Error | 7824821.082 | |||||||
Observations | 32 | |||||||
ANOVA | ||||||||
df | SS | MS | F | Significance F | ||||
Regression | 6 | 3.56567E+14 | 5.94278E+13 | 0.970601963 | 0.465140796 | |||
Residual | 25 | 1.5307E+15 | 6.12278E+13 | |||||
Total | 31 | 1.88726E+15 | ||||||
Coefficients | Standard Error | t Stat | P-value | Lower 95% | Upper 95% | Lower 95.0% | Upper 95.0% | |
Intercept | 6680904.824 | 14098263.7 | 0.473881392 | 0.63969698 | -22355012.79 | 35716822.44 | -22355012.79 | 35716822.44 |
PTS | 474909.1885 | 744459.5211 | 0.637924797 | 0.529322957 | -1058333.896 | 2008152.273 | -1058333.896 | 2008152.273 |
MIN | 257245.0734 | 330704.0884 | 0.777870859 | 0.443944886 | -423852.7462 | 938342.893 | -423852.7462 | 938342.893 |
FG% | 101956.7059 | 172190.5882 | 0.59211544 | 0.55909086 | -252676.4489 | 456589.8607 | -252676.4489 | 456589.8607 |
FG3% | -159764.7947 | 150644.2173 | -1.060543827 | 0.299036227 | -470022.368 | 150492.7785 | -470022.368 | 150492.7785 |
FT% | -116359.4294 | 146163.0268 | -0.796093458 | 0.433472556 | -417387.818 | 184668.9592 | -417387.818 | 184668.9592 |
GP | 145221.156 | 200768.7473 | 0.723325507 | 0.476193695 | -268269.8192 | 558712.1312 | -268269.8192 | 558712.1312 |
For many players, it’s hard to keep on performing well; some players played well and signed a 4-year high salary contract, and then they became less competitive after it. The other reason that Shaquill O’Neal mentioned is players are now more clever than ever in negotiating a better and more valuable contract, even though these players do not deserve it [9]. From Table 10, we found that nationality is not related to players who perform poorly but have high salaries because their nationality didn’t influence them to sign their high-salary contracts. For example, Rudy Gobert, who is a France center, owns the 11th highest salary in the league, but he only scored 12.5 points per game.
Table 10: High Salaries Poor Performance Nationality T-test
Foreign players | native players | |
Mean | 11792442.25 | 8390651.042 |
Variance | 9.38575E+13 | 5.04707E+13 |
Observations | 8 | 24 |
Hypothesized Mean Difference | 0 | |
df | 10 | |
t Stat | 0.914567937 | |
P(T<=t) one-tail | 0.190970863 | |
t Critical one-tail | 1.812461123 | |
P(T<=t) two-tail | 0.381941726 | |
t Critical two-tail | 2.228138852 |
Referring to Table 11, there is another factor that is not highly related to a poorly performed player's salary, which is age. This finding surprised us because what we thought was age was the main reason influencing players' salaries. Then we find out there are some players who own a high-salary contract but perform badly. Cris Paul is an iconic one; he owns a 28M contract at the age of 38. He owns his high contract by his high basketball IQ and he an inspire his teammates because he is an experienced veteran.
Table 11: High Salary and Poor Performance Players Age Linear Regression
Regression Statistics | ||||||||
Multiple R | 0.008365 | |||||||
R Square | 7E-05 | |||||||
Adjusted R Square | -0.03326 | |||||||
Standard Error | 7931227 | |||||||
Observations | 32 | |||||||
ANOVA | ||||||||
df | SS | MS | F | Significance F | ||||
Regression | 1 | 1.32E+11 | 1.32E+11 | 0.002099 | 0.96376 | |||
Residual | 30 | 1.89E+15 | 6.29E+13 | |||||
Total | 31 | 1.89E+15 | ||||||
Coefficients | Standard Error | t Stat | P-value | Lower 95% | Upper 95% | Lower 95.0% | Upper 95.0% | |
Intercept | 8683163 | 12258119 | 0.70836 | 0.48419 | -1.6E+07 | 33717582 | -1.6E+07 | 33717582 |
Age | 18617.26 | 406345.7 | 0.045816 | 0.96376 | -811251 | 848485.9 | -811251 | 848485.9 |
There are still some limitations in this report. First of all, some rookies have great performances in their first season in the NBA, and the limitations of rookie contracts result in players not being able to get higher-priced contracts. Also due to the NBA’s salary cap, there is a limit to the top salary of each team, which cause players with shinning game stats are not able to get a higher salary. Finally, this report only lists the amount of Instagram fans and the value of endorsement contracts to reflect an NBA player’s market value; in fact, there are many other factors that affect the value of a player's market value.
5. Conclusion
This report started by raising the query of whether it is necessary to play well to get a higher salary, with the aim of analyzing what factors influence players who are well-paid to perform well and those who are well-paid to perform poorly respectively. The paper was found through data analysis in Excel. Both types of players' salaries are positively correlated with the number of players' Instagram followers, while on-court performance (points per game, minutes played per game) is even more influenced by highly paid, high-performing players. In our research, we still have some problems not solved. We analyzed about 110 players' game data in one season, which may not convincing enough. Also, we didn’t do any research on players who get poorly paid, so we cannot find out what factor made the player's salary drop. In the NBA, they have a complex contract law; we put all the rookies out because their contract was signed before they played in the league, which needs further study. To summarize, NBA players who want to boost their salaries, especially those who are already receiving higher salaries, should not only focus on performing well on the court but also boost their social media attraction, which may bring more revenue to themselves and their teams and will, in turn, boost their own revenue as well.
References
[1]. The 10 most overpaid NBA players for the 2023-24 season. (2023, July 22). https://fadeawayworld.net/the-10-most-overpaid-nba-players-for-the-2023-24-season
[2]. Stathead. (2023). Stathead: Your all-access ticket to the Sports Reference Database. Stathead.com. https://stathead.com
[3]. ESPN. (2022). ESPN. https://www.espn.com/nba/salaries/_/year/2023/seasontype/4
[4]. Sisneros, R. (2013). Expanding plus-minus for visual and statistical analysis of NBA box ... https://users.ncsa.illinois.edu/sisneros/papers/15_expanding_sisneros13.pdf
[5]. ESPN. (2023). Serving sports fans. anytime. anywhere. ESPN. https://www.espn.com/
[6]. Instagram. (2023). Login Instagram. Login Instagram. https://www.instagram.com/
[7]. Yang, C.-H., & Lin, H.-Y. (2010). Is there salary discrimination by nationality in the NBA? Journal of Sports Economics, 13(1), 53–75. https://doi.org/10.1177/1527002510391617
[8]. Stice, Z. (2020, August 6). Athlete branding: Does Social Media Presence Impact NBA players’ on-court salaries? Samford University. https://www.samford.edu/sports-analytics/fans/2020/Athlete-Branding-Does-Social-Media-Presence-Impact-NBA-Players-On-Court-Salaries
[9]. Starjacki, W. (2022, September 8). MSN. https://www.msn.com/en-us/sports/nba/shaquille-oneal-believes-nba-players-today-are-overpaid-i-wish-i-was-playing-now-against-these-little-cupcakes/ar-AA11Yasd
Cite this article
Zhang,Z.;Zheng,Y.;Wang,Y. (2024). Is It Necessary to Play Well to Get a Higher Salary?. Advances in Economics, Management and Political Sciences,106,1-9.
Data availability
The datasets used and/or analyzed during the current study will be available from the authors upon reasonable request.
Disclaimer/Publisher's Note
The statements, opinions and data contained in all publications are solely those of the individual author(s) and contributor(s) and not of EWA Publishing and/or the editor(s). EWA Publishing and/or the editor(s) disclaim responsibility for any injury to people or property resulting from any ideas, methods, instructions or products referred to in the content.
About volume
Volume title: Proceedings of the 3rd International Conference on Business and Policy Studies
© 2024 by the author(s). Licensee EWA Publishing, Oxford, UK. This article is an open access article distributed under the terms and
conditions of the Creative Commons Attribution (CC BY) license. Authors who
publish this series agree to the following terms:
1. Authors retain copyright and grant the series right of first publication with the work simultaneously licensed under a Creative Commons
Attribution License that allows others to share the work with an acknowledgment of the work's authorship and initial publication in this
series.
2. Authors are able to enter into separate, additional contractual arrangements for the non-exclusive distribution of the series's published
version of the work (e.g., post it to an institutional repository or publish it in a book), with an acknowledgment of its initial
publication in this series.
3. Authors are permitted and encouraged to post their work online (e.g., in institutional repositories or on their website) prior to and
during the submission process, as it can lead to productive exchanges, as well as earlier and greater citation of published work (See
Open access policy for details).
References
[1]. The 10 most overpaid NBA players for the 2023-24 season. (2023, July 22). https://fadeawayworld.net/the-10-most-overpaid-nba-players-for-the-2023-24-season
[2]. Stathead. (2023). Stathead: Your all-access ticket to the Sports Reference Database. Stathead.com. https://stathead.com
[3]. ESPN. (2022). ESPN. https://www.espn.com/nba/salaries/_/year/2023/seasontype/4
[4]. Sisneros, R. (2013). Expanding plus-minus for visual and statistical analysis of NBA box ... https://users.ncsa.illinois.edu/sisneros/papers/15_expanding_sisneros13.pdf
[5]. ESPN. (2023). Serving sports fans. anytime. anywhere. ESPN. https://www.espn.com/
[6]. Instagram. (2023). Login Instagram. Login Instagram. https://www.instagram.com/
[7]. Yang, C.-H., & Lin, H.-Y. (2010). Is there salary discrimination by nationality in the NBA? Journal of Sports Economics, 13(1), 53–75. https://doi.org/10.1177/1527002510391617
[8]. Stice, Z. (2020, August 6). Athlete branding: Does Social Media Presence Impact NBA players’ on-court salaries? Samford University. https://www.samford.edu/sports-analytics/fans/2020/Athlete-Branding-Does-Social-Media-Presence-Impact-NBA-Players-On-Court-Salaries
[9]. Starjacki, W. (2022, September 8). MSN. https://www.msn.com/en-us/sports/nba/shaquille-oneal-believes-nba-players-today-are-overpaid-i-wish-i-was-playing-now-against-these-little-cupcakes/ar-AA11Yasd