


1. Introduction
According to Shiller [1], the concept of behavioral finance encompasses the field of finance from a more comprehensive social science standpoint, incorporating disciplines such as psychology and sociology. One of the primary features of behavioral finance is its divergence from the efficient markets theory. The efficient markets hypothesis posits that investors behave rationally [2], while behavioral finance contends that investors do not always exhibit rationality and seek to elucidate their behavior through psychological and social lenses. Among the diverse range of concepts explored in the field of behavioral finance, a specific concept has attracted considerable interest: the relationship between investor sentiment and stock market dynamics [3].
1.1. Literature Review
Findings of studies in the economics and finance realm suggest that investor sentiment significantly impacts stock market activity. Other than indicating a positive outlook, the introduction of investor sentiment as an analytical indicator can lead to negative status quo conclusions such as misplaced expectations of stock value and noise trading [4]. Moreover, the analysis of investor sentiment by Yang and Zhou can provide insights into various anomalies in the stock market, including over and under-reaction to market price, which leads to inefficient investor behavior, such as dump stocks and limited arbitrage [5]. Hence, it can be observed from empirical research that there is a correlation between investor attitude and various actions examined in behavioral finance, as well as market anomalies. It is noteworthy that sentiment expressed on social networks could also serve as a robust predictor of stock market activity. This integration and analysis of social media sentiment would establish a potentially powerful correlation between the influence of daily social media use and stock prices using data analysis, presenting an effective and prospective methodology for comprehending the connection between expression on modern virtual networks and classic financial notions. Makrehchi et al. have demonstrated that social network sentiment can forecast fluctuations in stock prices [6]. The utilization of social media sentiment has been identified as a potential risk factor within asset pricing frameworks in some studies [7]. Nevertheless, the absence of a universally accepted method for quantifying emotion in microblogging remains challenging. Some research focused on assessing the cumulative sentiment expressed in Twitter messages. In contrast, Logunov and Panchenko conducted a separate study but did not find any significant influence of their emoticon-based index on stock returns as derived from Twitter messages [8]. Due to the potential debate about the method of quantifying microblogging emotion, the sentiment analysis of the combination of news and opinions, instead of microblogging, would be used to construct the model used in this paper. The method reviewed and the related works will be discussed below.
1.2. Method Review
In the last few years, deep learning has become an important tool in prediction and recognition. This section describes research related to stock price prediction using LSTM networks, as well as sentiment analysis conducted with models such as BERT. Li et al. conducted a study on the Chinese stock market's investor sentiment forecast capability [9]. They utilized user-generated online content to assess sentiment levels and explored a range of text classification methods, price prediction models, varying time frames, and information update mechanisms for this purpose. Sousa et al. have shown that BERT outperforms both convolutional neural networks by 8.6% [10]. Economic news sentiment analysis is used to measure the decline or rise of a day. The proposed approach attained a prediction accuracy of 69% for fluctuations in the stock market. Wu et al. introduced an innovative variant of LSTM models [11], termed the S_I_LSTM model. Their research focused on examining the impact of both conventional data sources, like market pricing and technical indicators, and unconventional data sources, such as financial blogs, on predicting stock prices. Additionally, they explored the influence of the technology index on stock price forecasting. Prior research has used historical stock price data to predict stock price, with good results. However, some studies show that emotions conveyed by news are also an important factor affecting stock prices. Extensive literature research has revealed a notable gap in the combination of historical stock price analysis and sentiment analysis through deep learning models, an area that presents an opportunity for academic contribution. This innovative aspect of this paper is dedicated to making stock price forecasting more accurate by using the analyzed sentiment as a parameter for stock price forecasting.
2. Applying Deep Learning Models
2.1. LSTM network
The LSTM (Long Short-Term Memory) network, a derivative of the RNN (Recurrent Neural Network), enhances the long-term memory capabilities of RNN and effectively addresses the vanishing gradient issue. This LSTM neural network is adept at learning and determining whether to use an output in the subsequent iteration. The basic flow of each LSTM memory block could be briefly introduced by Figure 1. And because of the retention of important information, this paper provides a good reference for the establishment of the prediction model of this research.
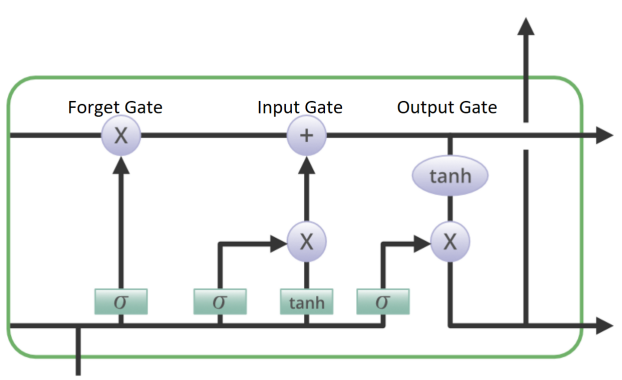
Figure 1: Illustration of the Structure of a Single LSTM Layer.
2.2. BERT model
The BERT (Bidirectional Encoder Representations from Transformers) model is a sophisticated deep-learning framework [12], consisting of multiple layers of bidirectional transformer encoders. Unlike traditional models that utilize a combination of encoder and decoder, BERT exclusively leverages the encoder component of the transformer architecture. Illustrated in Figure 2, this model represents a significant evolution from previous methods like word2vec, which assigned a constant vector to a word regardless of its contextual use. BERT, through its multi-layer bidirectional transformer encoder, assigns varying vectors to a word, adapting to its specific contextual environment. In essence, BERT excels in generating contextually nuanced word vectors, enhancing the accuracy of word representation in NLP applications.
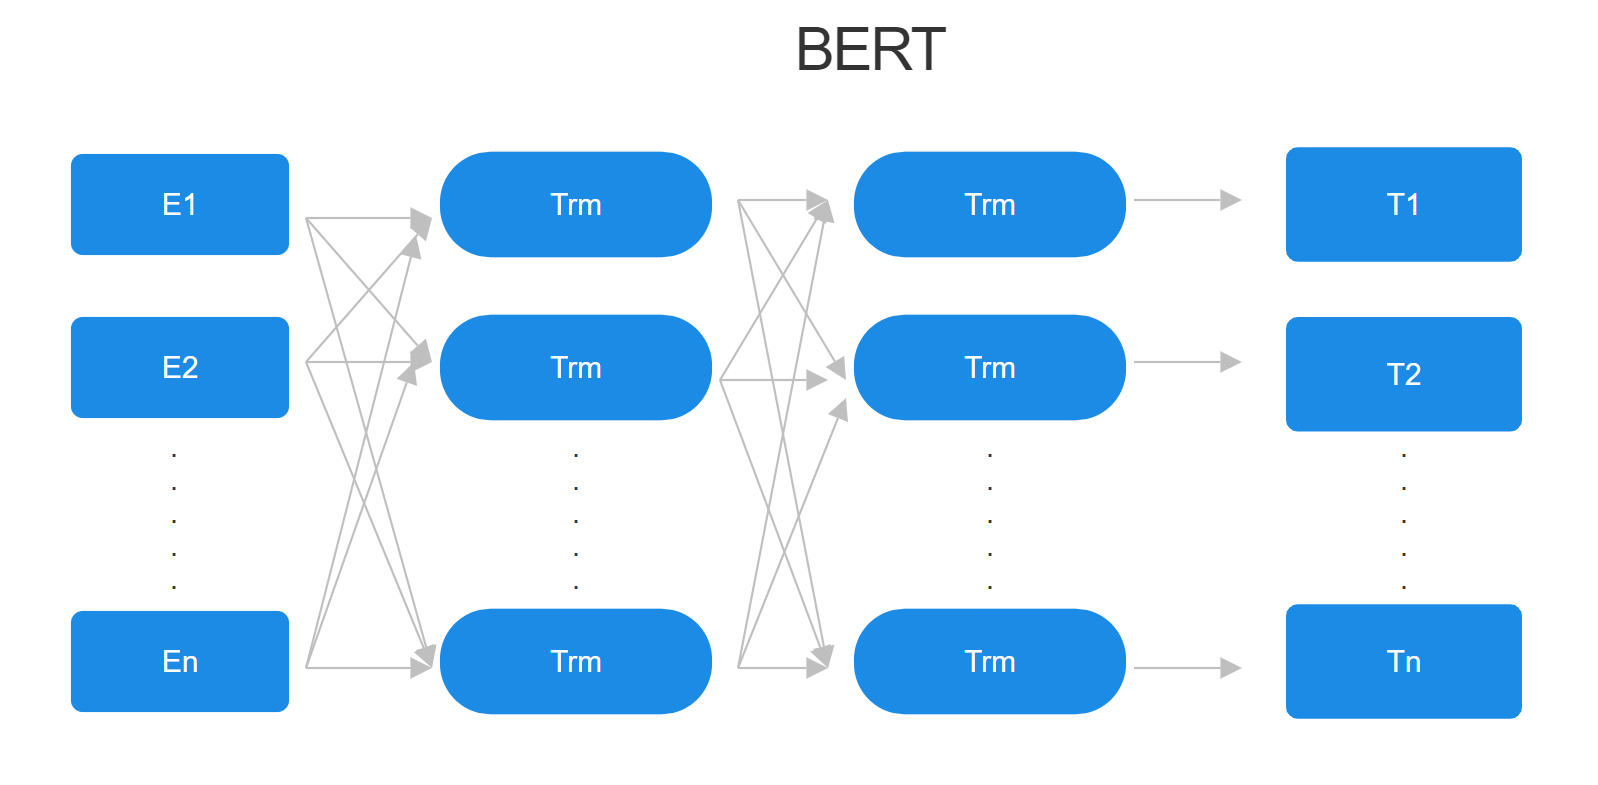
Figure 2: Illustration of the Structure of BERT Model.
3. Data Overview
Overall, two datasets were selected. There is one dataset from Kaggle named ‘Yahoo Stock Prediction by News’, which contains 15974 pieces of data. One column that requires extra attention is the ‘content’ column, which has removed punctuations in the original data. This column would be treated as the data input for paper’s following sentiment analysis. Table 1 illustrates the data acquired from the Kaggle dataset, starting on July 23, 2012, and ending on January 27, 2020, totaling 15,974 items. This table includes stock ticker, date and category of the information released, title of the texts and the specific content.
Table 1: Dataset From Kaggle, sentiment texts related to Apple Inc. on a specific date.
Name | Description | Example |
Ticker | The stock symbol of the company | AAPL |
Date | The date of information release in yyyy/mm/dd | 2020/1/27 |
Category | Whether this information belongs to opinions or news | opinion |
Title | The title of the news or opinion texts | Tech Daily |
Content | The specific news or opinions tokenized context included the dataset | The top stories in this digest are Intel's NYSE T earnings Netflix's NASDAQ NFLX surging share price... |
Table 2: Dataset From Yahoo_Finance, historical information about Apple Inc.
Name | Description | Example |
Date | The date for stock price, in yyyy/mm/dd | 2020/1/27 |
Open | The open price of the Apple Stock on the date of extracted information | 77.51 |
High | The highest price reached on the date of extracted information | 77.94 |
Low | The lowest price reached on the date of extracted information | 76.22 |
Close | The open price of the Apple Stock on the date of extracted information | 77.24 |
Adj Close | The close price adjusted according to specific company actions like new offerings, or dividends paid | 75.25 |
Volume | The volume quantifies the total amount of shares transacted in a stock | 161,940,000 |
Secondly, the Apple stock price data from Yahoo Finance's official website was adopted in Table 2, including the opening price, closing price, adjusted close price, high price, low price, and volume with detailed explanations and examples. Figure 3 is the graph plotted using the actual AAPL historical data from Yahoo Finance. With date on the x-axis and open price($, dollar) on y-axis, it demonstrates how stock prices have changed over the past decade.
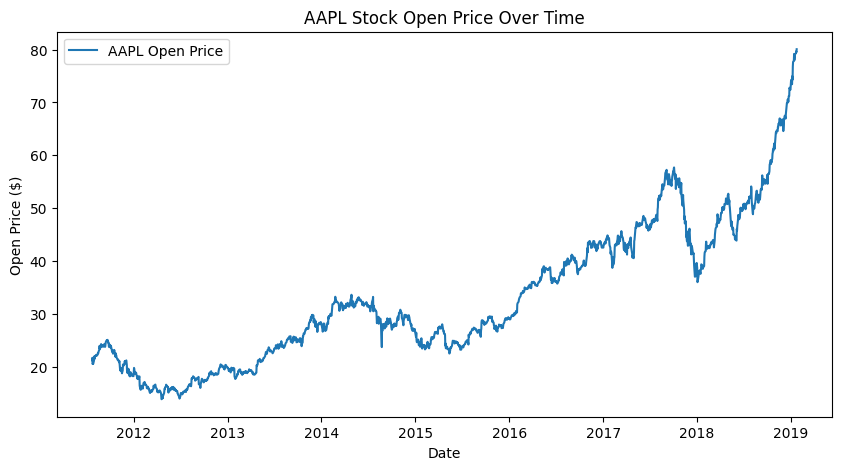
Figure 3: Illustration of the AAPL Stock Open Price Over Time from Yahoo Finance.
4. Methodology
4.1. System Architecture
In this section, an attempt will be proposed in this work to analyze emotions conveyed by news releases and opinions as a basis for analysis. Through illustration in figure 4, searches of news and opinion texts from Kaggle were carried to go through sentiment analysis with two models, VADER and FinBERT. Both models give the probability that the sentiment implied by the input text is positive, negative, or neutral. However, exclusion of neutral results was taken to make the conclusions more constructive and illuminating. Historical information on stocks from Yahoo Finance were also obtained and merged into a new dataset, followed by stock prediction using the LSTM neutral model. The final dataset is 9 dimensions of data, with 2 dimensions from news sentiment analysis, 2 dimensions from opinion sentiment analysis, and the left 5 dimensions from historical stock prices. The LSTM neural model would be used for stock price prediction on the original 5-dimensional data and the new 9-dimensional data. Then their respective results would be compared.
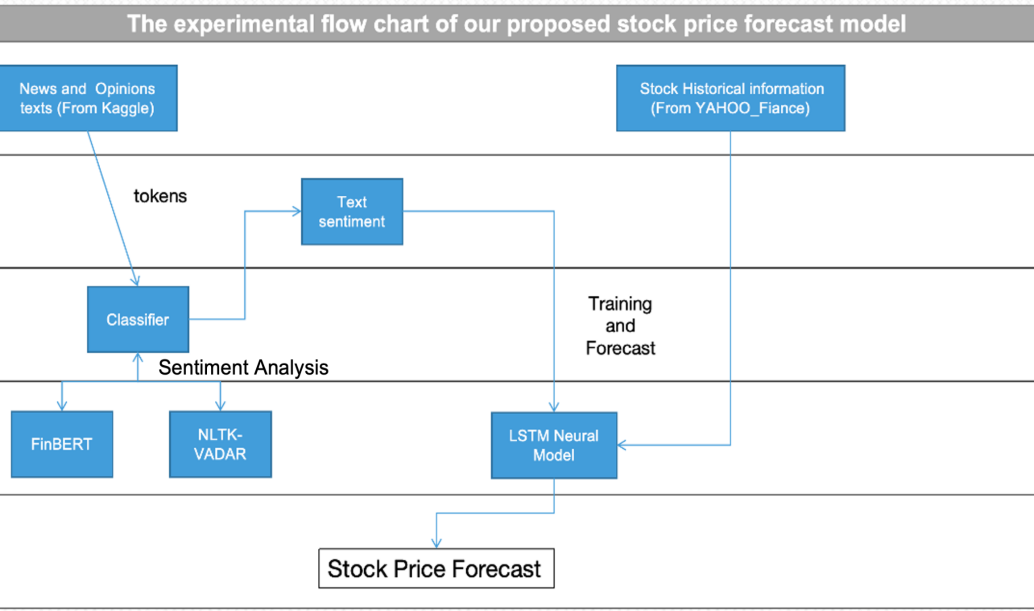
Figure 4: The basic system architecture using a lane diagram.
4.2. STEP 1: Sentiment Analysis
The overview of the sentiment analysis process is shown in Figure 5. The procedure for one piece of news and one piece of opinion would be used as examples to demonstrate how NLTK-VADER and the FinBERT model treat the original data differently in this work.
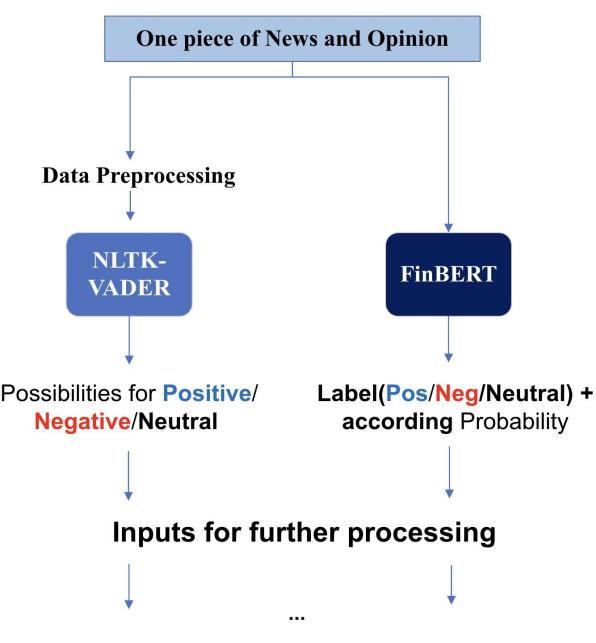
Figure 5: Text sentiment recognition process of texts from news and opinions.
4.2.1. VADER
Cleaning up unnecessary and potentially interfering items in the collected text is a critical step in ensuring reliable results. The first step is to restore common words, such as the abbreviations of is and not. Since the text of the dataset is tokenized, there is no need to do word segmentation. When utilizing VADER (Valence Aware Dictionary for Sentiment Reasoning) [13], which conducts sentiment analysis that focuses on words, numerical values are restored as the results. Stopwords specific to the language are retrieved using NLTK and subsequently eliminated. Simultaneously, the parts of speech and morphology of words are extracted to ensure that the words are precise.
VADER operates as a rule-based sentiment analysis tool, where terms are systematically categorized based on their semantic orientation, typically classifying them as either positive or negative. VADER model is used to predict the emotion of content.
\( {P_{pos}}= \frac{1}{n}\sum _{i=1}^{n}{P_{{pos_{i}}}} (1) \)
\( { P_{neg}}= \frac{1}{n}\sum _{i=1}^{n}{P_{{neg_{i}}}} (2) \)
For any content, there will be four output results after VADER’s analysis, which are "pos", "neg", "neu" and "compound". Taking opinions as an example, the Eqs. (1) and (2) will be used, averaging all the opinion results of the day to get the final result columns P_opinion_pos and P_opinion_neg. And apply the same method to the news. The four columns P_news_pos, P_news_neg, P_opinion_pos, and P_opinion_neg are the results that will be used as new features for sentiment inputs for the stock price prediction.
4.2.2. FinBERT
FinBERT (BERT for Financial Text Mining) is the second model utilized for sentiment analysis. The inputs are the preprocessed news and opinions tokens. This transforms unstructured natural language text into structured numerical data. VADER is a method based on predefined dictionaries, while FinBERT is a variant of the BERT model [14]. FinBERT is a pre-trained model on financial texts with a corpus of 4.9B tokens, which performs better in understanding financial natural language. Specifically, based on the FinBERT model, a fine-tuned version is used [15], which was adjusted for downstream tasks of financial sentiment analysis and showed promising performance. It generates sentiment labels as well as probability; and here, only sentiment labels were considered. In contrast, the VADER model generates some probabilities rather than explicit labels, therefore handling results from various models requires different approaches.
\( {P_{pos}}= \frac{{N_{pos}}}{{N_{total}}} \) (3)
\( {P_{neg}}= \frac{{N_{neg}}}{{N_{total}}} \) (4)
The texts in the dataset are divided into two categories: news and opinions. There are often multiple news or opinion texts within one day. It is necessary to process multiple text analysis results further, which is critical for constructing new feature columns reflecting overall market sentiments that day. Take news pieces as an example. When processing news text, Eqs. (3) and (4) were applied to calculate the proportion of positive- or negative-sentiment texts that day where \( {P_{pos}} \) , in the formula, represents the ratio of positive texts( \( {N_{pos}} \) ) to total number( \( {N_{total}} \) ), while \( {P_{neg}} \) stands for negative ones( \( {N_{neg}} \) )'s share in \( {N_{total}} \) . Similar calculation methods were also applied to opinions. As previously mentioned, the sentiment analysis approach based on FinBERT adopts a ternary classification (positive-neutral-negative) for single-text content categorization. Subsequently, by applying Eqs (3) and (4) and calculating daily proportions occupied by both texts (news and opinions), we're able to generate a brand-new dataset. In this dataset, every entry carries consolidated information collected throughout each day, including trading data plus four new features reflecting sentiment analysis results.
4.3. STEP 2: Stock prediction by Implementing LSTM
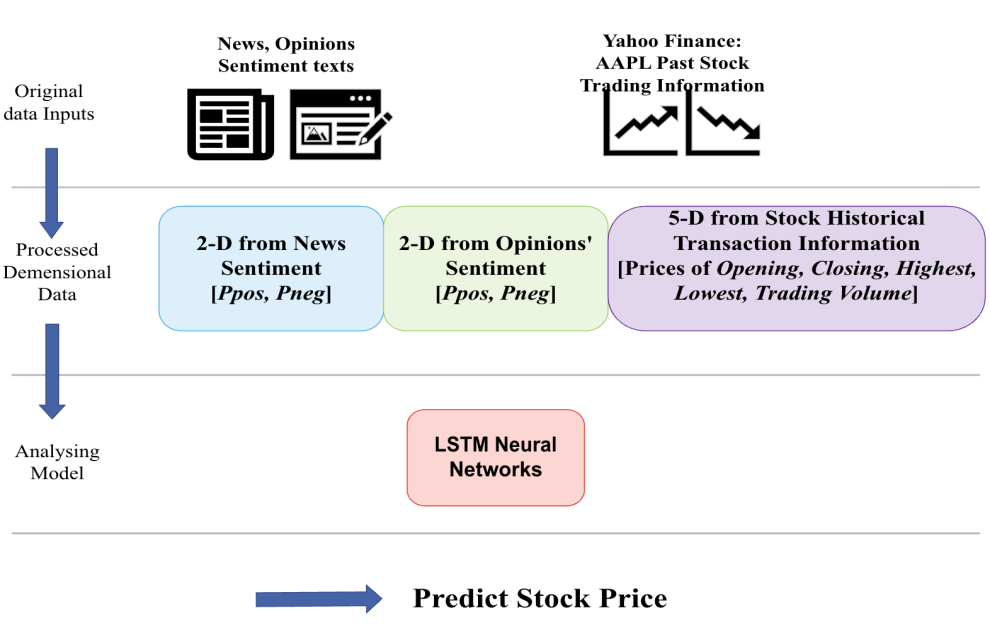
Figure 6: The data flow of our stock price prediction method which integrates historical stock transaction data with sentiment ratios from news and opinions.
Figure 6 shows the procedure of the combination of emotional data from news and opinions with historical data from the five dimensions of opening, closing, highest, lowest, and trading volume over the chosen timing window. This 9-dimensional data is used as the input feature of the LSTM network to predict the stock price.
5. Experiment and Result
5.1. Experimental Methodology
Based on the methodologies discussed above, experiments are conducted by performing sentiment analysis on news and opinions using VADER and FinBERT. These sentiment analysis results were then combined with historical stock trading data to form input feature vectors. This work aimed to assess whether this approach could achieve better outcomes than solely relying on technical analysis using trading data. The two sentiment analysis methods, VADER and FinBERT, have been previously detailed. For the LSTM-based stock price prediction, a network is utilized with four LSTM layers, each with a hidden size of 100, and incorporated a dropout rate of 0.2 to reduce overfitting. The adopted model was trained for 50 epochs using the aforementioned dataset, and the best-performing model on the validation set during training was saved as the optimal model for subsequent testing.
5.2. Result of Sentiment Analysis
As the first step of the experiment, the sentiment analysis outcomes from VADER and FinBert methodologies were gathered for a five-day testing dataset. Utilizing a heatmap, as demonstrated through figure 7, 8, 9, 10, each map has varying magnitudes of values which were correlated with distinct color shades. The prevailing observation from both models’ analysis is the predominance of positive sentiment inclinations within the populace. Differences should also be noted. From the aspect of outcomes, FinBERT's text analysis performs better and is more hierarchical.
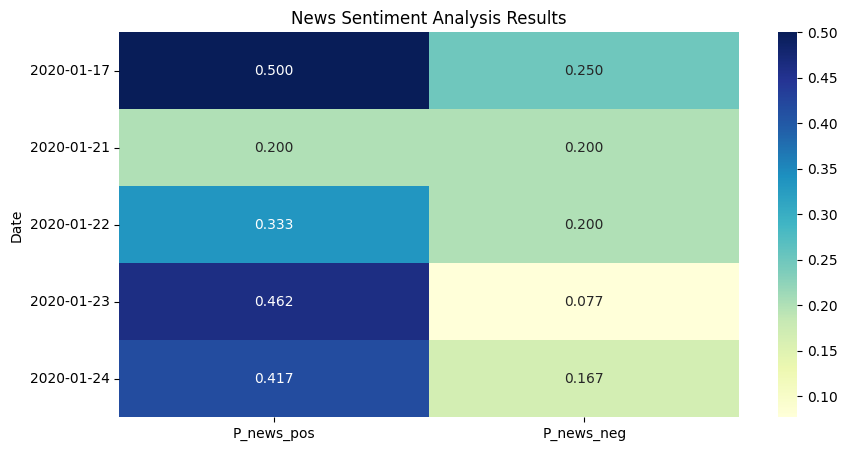
Figure 7: News Sentiment Analysis Result by FinBERT.
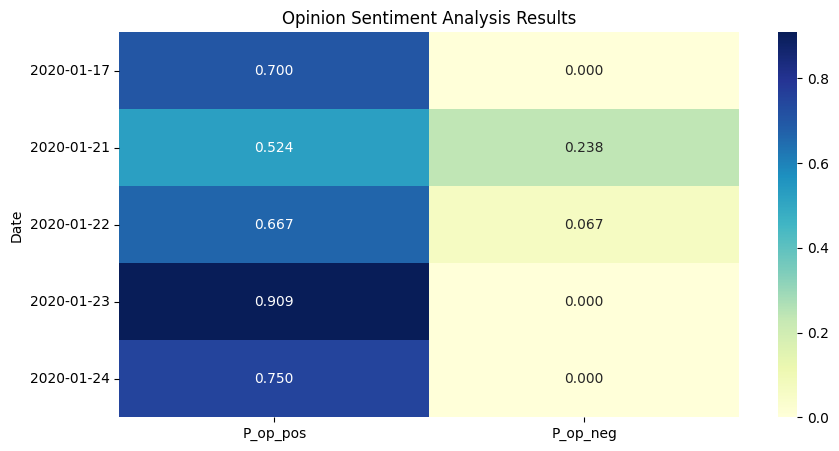
Figure 8: Opinion Sentiment Analysis Result by FinBERT.
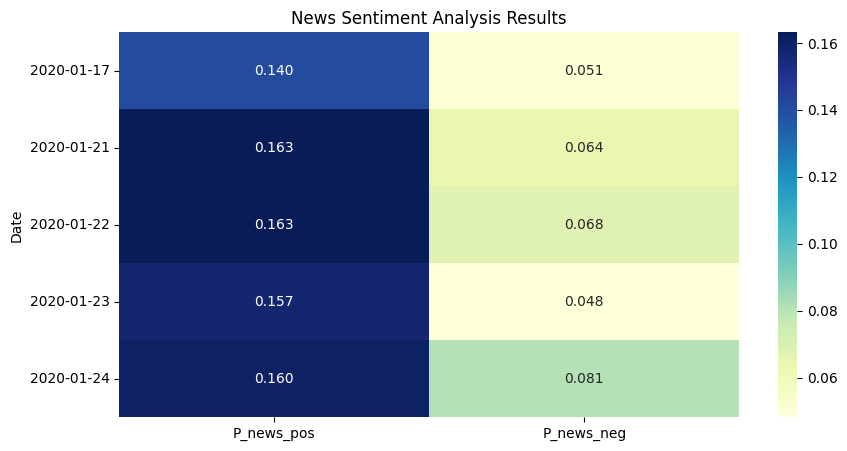
Figure 9: News Sentiment Analysis Result by VADER.
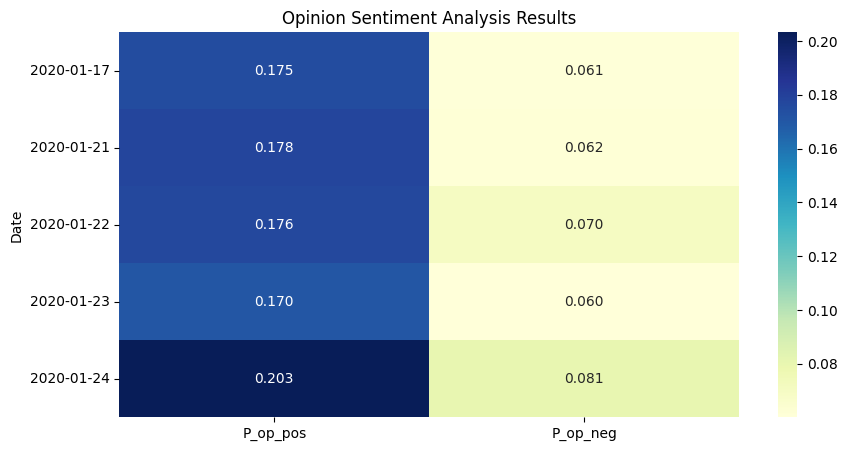
Figure 10: Opinion Sentiment Analysis Result by VADER.
The VADER-based method uses rather coarse processing, which allows a large portion of the text to be estimated likely as neutral, implying that the sentiment analysis parameters are rather insensitive to the extent that sentiment cannot be judged properly in many cases. However, in terms of the remaining valid analysis results, it converges with FinBERT's view that the market reaction on those days was largely optimistic. According to the characteristics of FinBERT, the positive and negative sentiment of the day will be clear as a result in the following cases: Firstly, some days have only news but no opinion. If so, the news will be counted normally, and opinion_pos and opinion_neg will automatically become NaN, which would be set to zero manually. Secondly, some days have very little news and opinion, so FinBERT would likely determine them to be neutral, and then positive and negative will be counted as 0 automatically.
5.3. Result of Stock Price Prediction
To estimate the error between the predicted and true values, RMSE were used to calculate the error between the actual value and predicted value, the smaller it is, the more accurate the prediction. The calculation formula for RMSE is as follows.
\( RMSE = \sqrt[]{\sum _{i=1}^{n}\frac{{({\hat{y}_{i}}-{y_{i}})^{2}}}{n}} (5) \)
Once the values are obtained, the next step is to plot a line graph of the actual stock opening price and the predicted value over a period to visualize the predictive performance of the model. Outcomes are specifically demonstrated in the figures. Note that figure 11 demonstrates a strong alignment between the train loss and validation loss, indicating a favourable fit in this model. This alignment further supports later predictive analysis. In the subsequent illustrations, the alteration of distinct inputs yielded diverse outcomes. Figure 12 shows the results obtained from using unprocessed input consisting of only stock history data, which yielded a RMSE of 0.9793. When employing sentiment analysis from FinBert and VADER on figure 13 and 14, it became evident that the RMSE decreased and the consistency between the predicted and actual outcomes improved.
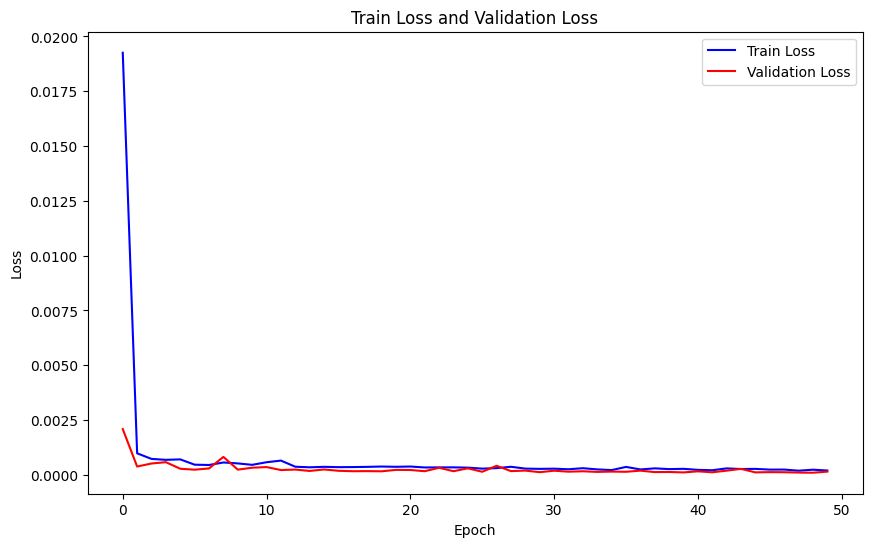
Figure 11: Train Loss and Validation Loss.
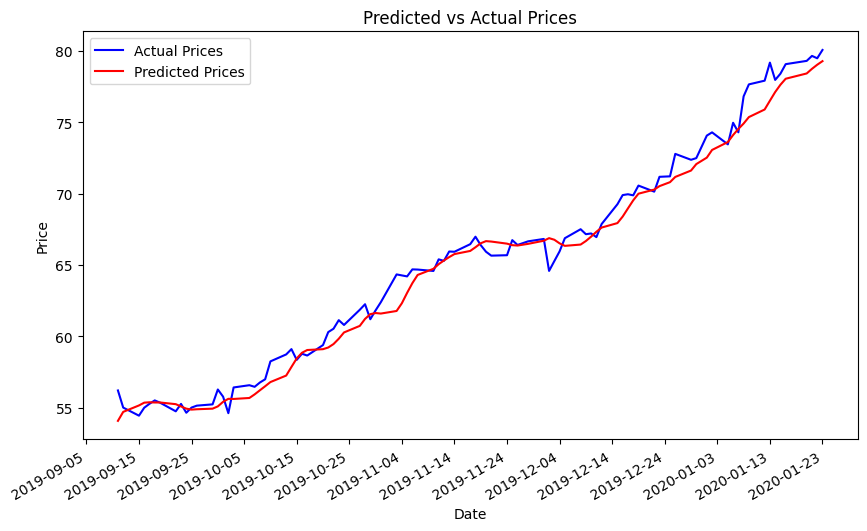
Figure 12: Prediction by Solely Historical Transaction Information (5-dimensional input features, Test RMSE: 0.9793).
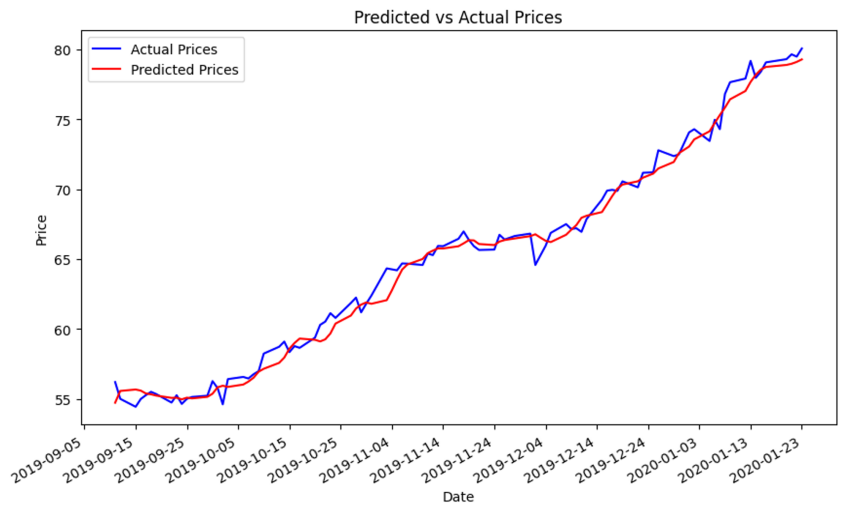
Figure 13: Prediction by sentiment-historical trading mixed information based on FinBERT (9-dimensional input features, Test RMSE: 0.7546).

Figure 14: Prediction by sentiment-historical trading mixed information based on VADER (9-dimensional input features, Test RMSE: 0.7899).
The experimental results are summarized in Figure 15. Based on the findings, the method relying solely on historical transaction information demonstrated the highest Root Mean Square Error (RMSE) among the three evaluated approaches. This method was established as a baseline for comparison with methods incorporating sentiment analysis. The approach combining FinBERT sentiment analysis with historical trading data exhibited the smallest RMSE, indicating an improvement of 22.94% compared to the method using only historical transaction information. The method integrating VADER sentiment analysis with historical trading data ranked second with a relatively higher RMSE, yet still represented a 19.34% enhancement over the baseline.
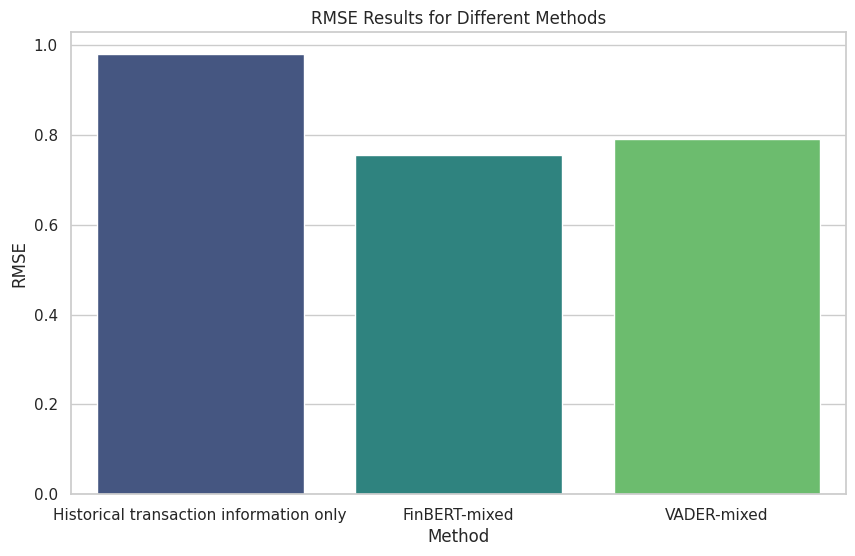
Figure 15: RMSE Inaccuracies Results for Different Methods.
6. Conclusion
The formentioned experimental findings indicate that both VADER and FinBERT have their own advantages in real-life applications. The rule-based VADER employs a user-friendly and training-free methodology to produce commendable outcomes while minimizing computational expenses. On the other hand, the FinBERT model, which is built on the Transformer architecture, effectively captures the underlying market dynamics present in texts through pre-training and fine-tuning on enormous datasets. The methodology of this paper revolves around analyzing shifts in traders' sentiment by interpreting internet news and opinionated material using VADER and FinBERT. And the results were promising and supported some valuable insights into the predictability of the stock market through analyzing market ‘mood’. This technique would possess distinctive relevance in the swiftly changing realm of business.
The lesson taught by the data collection part is that to enhance stock price accuracy, employing two separate datasets for sentiment texts and historical stock prices could be advantageous. Sentiment text is the unstructured data used for the fundamental analysis mentioned above, and historical price information is the structured data applied for the technical analysis. The integration of these two analyses did great work in capturing market dynamics. For future improvement in the data, more preprocessing methods would be needed to improve the accuracy of prediction. Like applying ARIMA on stock prices to extract higher-dimensional information or other models doing preprocessing on sentiment texts to improve accuracy.
Then following the sentiment analysis, FinBERT, being a pre-trained model, could perform better if fine-tuned the model parameters specifically for the targeted datasets. Nevertheless, the experiment refrained from fine-tuning the model in this project due to the disproportionate correlation between the complexity of the task required and the marginal enhancement in the outcomes. This serves as a mere reminder for forthcoming works that are connected. In addition, adopting more sophisticated sentiment analysis techniques and approaches other than VADER and FinBERT might enhance the accuracy of capturing market sentiment reactions. In this project, sentiments are categorized as positive, negative, and neutral; nevertheless, human emotions are complex and multifaceted. Future research could benefit from analyzing additional emotional facets embedded in sentences.
References
[1]. R. J. Shiller (2003) From Efficient Markets Theory to Behavioral Finance. J. Econ. Perspect., 17: 83–104.
[2]. E. F. Fama (1998) Market efficiency, long-term returns, and behavioral finance. J. Financ. Econ., 49: 283–306.
[3]. N. Barberis, A. Shleifer, and R. Vishny (1998) A model of investor sentiment. J. Financ. Econ., 49: 307–343.
[4]. T. Renault (2017) Intraday online investor sentiment and return patterns in the U.S. stock market. J. Bank. Finance., 84: 25–40.
[5]. C. Yang and L. Zhou (2015) Sentiment approach to underestimation and overestimation pricing model. Econ. Model., 51: 280–288.
[6]. M. Makrehchi, S. Shah and W. Liao (2013) Stock Prediction Using Event-Based Sentiment Analysis. In: 2013 IEEE/WIC/ACM International Joint Conferences on Web Intelligence (WI) and Intelligent Agent Technologies (IAT). Atlanta. pp. 337-342.
[7]. P. Houlihan and G. G. Creamer (2017) Can Sentiment Analysis and Options Volume Anticipate Future Returns? Comput. Econ., 50: 669–685.
[8]. A. Logunov and V. Panchenko (2011) Characteristics and predictability of Twitter sentiment series. In: 19th International Congress on Modelling and Simulation. Perth. pp. 1617–1623.
[9]. Y. Li, H. Bu, J. Li, and J. Wu (2020) The role of text-extracted investor sentiment in Chinese stock price prediction with the enhancement of deep learning. Int. J. Forecast., 36: 1541–1562.
[10]. M. G. Sousa, K. Sakiyama, L. d. S. Rodrigues, P. H. Moraes, E. R. Fernandes and E. T. Matsubara (2019) BERT for Stock Market Sentiment Analysis. In: 2019 IEEE 31st International Conference on Tools with Artificial Intelligence (ICTAI). Portland. pp. 1597-1601.
[11]. S. Wu, Y. Liu, Z. Zou, and T.-H. Weng (2022) S_I_LSTM: stock price prediction based on multiple data sources and sentiment analysis. Connect. Sci., 34: 44–62.
[12]. J. Devlin, M.-W. Chang, K. Lee, and K. Toutanova (2019) BERT: Pre-training of Deep Bidirectional Transformers for Language Understanding. http://arxiv.org/abs/1810.04805.
[13]. C. Hutto and E. Gilbert (2014) Vader: A parsimonious rule-based model for sentiment analysis of social media text. Proceedings of the international AAAI conference on web and social media. 8: 216–225.
[14]. D. Araci (2019) FinBERT: Financial Sentiment Analysis with Pre-trained Language Models. http://arxiv.org/abs/1908.10063.
[15]. A. H. Huang, H. Wang, and Y. Yang (2023) FinBERT: A Large Language Model for Extracting Information from Financial Text. Contemp. Account. Res., 40: 806–841.
Cite this article
He,S.;Meng,Q.;Chen,B.;Jiang,X.;Gao,S. (2024). Sentiment to Stocks: Rule-Based and Deep Learning Sentiment Analysis for LSTM-Driven Stock Prediction. Advances in Economics, Management and Political Sciences,100,90-103.
Data availability
The datasets used and/or analyzed during the current study will be available from the authors upon reasonable request.
Disclaimer/Publisher's Note
The statements, opinions and data contained in all publications are solely those of the individual author(s) and contributor(s) and not of EWA Publishing and/or the editor(s). EWA Publishing and/or the editor(s) disclaim responsibility for any injury to people or property resulting from any ideas, methods, instructions or products referred to in the content.
About volume
Volume title: Proceedings of the 2nd International Conference on Management Research and Economic Development
© 2024 by the author(s). Licensee EWA Publishing, Oxford, UK. This article is an open access article distributed under the terms and
conditions of the Creative Commons Attribution (CC BY) license. Authors who
publish this series agree to the following terms:
1. Authors retain copyright and grant the series right of first publication with the work simultaneously licensed under a Creative Commons
Attribution License that allows others to share the work with an acknowledgment of the work's authorship and initial publication in this
series.
2. Authors are able to enter into separate, additional contractual arrangements for the non-exclusive distribution of the series's published
version of the work (e.g., post it to an institutional repository or publish it in a book), with an acknowledgment of its initial
publication in this series.
3. Authors are permitted and encouraged to post their work online (e.g., in institutional repositories or on their website) prior to and
during the submission process, as it can lead to productive exchanges, as well as earlier and greater citation of published work (See
Open access policy for details).
References
[1]. R. J. Shiller (2003) From Efficient Markets Theory to Behavioral Finance. J. Econ. Perspect., 17: 83–104.
[2]. E. F. Fama (1998) Market efficiency, long-term returns, and behavioral finance. J. Financ. Econ., 49: 283–306.
[3]. N. Barberis, A. Shleifer, and R. Vishny (1998) A model of investor sentiment. J. Financ. Econ., 49: 307–343.
[4]. T. Renault (2017) Intraday online investor sentiment and return patterns in the U.S. stock market. J. Bank. Finance., 84: 25–40.
[5]. C. Yang and L. Zhou (2015) Sentiment approach to underestimation and overestimation pricing model. Econ. Model., 51: 280–288.
[6]. M. Makrehchi, S. Shah and W. Liao (2013) Stock Prediction Using Event-Based Sentiment Analysis. In: 2013 IEEE/WIC/ACM International Joint Conferences on Web Intelligence (WI) and Intelligent Agent Technologies (IAT). Atlanta. pp. 337-342.
[7]. P. Houlihan and G. G. Creamer (2017) Can Sentiment Analysis and Options Volume Anticipate Future Returns? Comput. Econ., 50: 669–685.
[8]. A. Logunov and V. Panchenko (2011) Characteristics and predictability of Twitter sentiment series. In: 19th International Congress on Modelling and Simulation. Perth. pp. 1617–1623.
[9]. Y. Li, H. Bu, J. Li, and J. Wu (2020) The role of text-extracted investor sentiment in Chinese stock price prediction with the enhancement of deep learning. Int. J. Forecast., 36: 1541–1562.
[10]. M. G. Sousa, K. Sakiyama, L. d. S. Rodrigues, P. H. Moraes, E. R. Fernandes and E. T. Matsubara (2019) BERT for Stock Market Sentiment Analysis. In: 2019 IEEE 31st International Conference on Tools with Artificial Intelligence (ICTAI). Portland. pp. 1597-1601.
[11]. S. Wu, Y. Liu, Z. Zou, and T.-H. Weng (2022) S_I_LSTM: stock price prediction based on multiple data sources and sentiment analysis. Connect. Sci., 34: 44–62.
[12]. J. Devlin, M.-W. Chang, K. Lee, and K. Toutanova (2019) BERT: Pre-training of Deep Bidirectional Transformers for Language Understanding. http://arxiv.org/abs/1810.04805.
[13]. C. Hutto and E. Gilbert (2014) Vader: A parsimonious rule-based model for sentiment analysis of social media text. Proceedings of the international AAAI conference on web and social media. 8: 216–225.
[14]. D. Araci (2019) FinBERT: Financial Sentiment Analysis with Pre-trained Language Models. http://arxiv.org/abs/1908.10063.
[15]. A. H. Huang, H. Wang, and Y. Yang (2023) FinBERT: A Large Language Model for Extracting Information from Financial Text. Contemp. Account. Res., 40: 806–841.