


1. Introduction
1.1. Overview
Due to the overspread use of computer and the internet, the amount of data that be generated, captured, and copied witnessed rapid growth. In the last dozen years, social media and networking platforms such as Twitter and YouTube have generated huge amounts of data [1]. As of the third quarter of 2017, there were 330 million monthly active users and 157 million daily active users as of the second quarter of 2017 [1]. Let us take the business industry as an example. The data analysts in the firm would collect and scrutinize the historical data and performance to transpire data-driven decision-making analytics for a corporation's future direction and investment plans, by building model to predicting the plausibility of a particular event happening, forecast future trends or outcomes utilizing on-hand data with the final objective of improving the performance of the corporation [2]
1.2. Predictive Analytics
Analysis as an independent subject was created in the 17th century during the scientific revolution, and predictive analytics, which is a branch of analytics, was not until the end of the 20th century that it attracted widespread attention [2,3]. The process of predictive analytics analyzes the current and historical data by using techniques from statistics, data mining, machine learning, and artificial intelligence [4]. The first and most important part of predictive analytics is collecting data. Literally have to say, “the effectiveness of the predictive model totally depends on the quality of data” [5]. Over time and as technology has improved, there have been many different predictive analytics approaches for different situations. Probability theory and regression analysis are the most important techniques that are popularly used in analytics. Probability theory and regression analysis is some of the most important analysis technologies [5]. Machine learning tools such as artificial neural networks, decision trees, and support vector machines are widely used in many predictive analysis tasks [5]. People then use these techniques and example datasets to build models and finally test them [5].
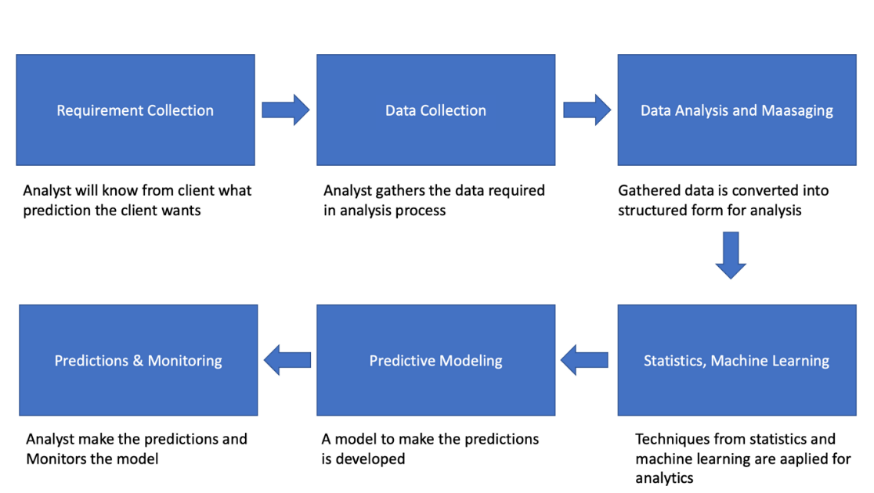
Figure 1: Predictive Analytics Process [5]
Figure 1 shows the process of predictive analytics. At the first stage, researchers need to collect data from experiments or literature. These data can be divided into four types: categorical, binary, continuous, and discrete. So, we also need to transform categorical predictors into dummy variables. The data analyst in the business industry needs accurate and relevant first-hand information gathered from data sources to create a complete picture of the customers' interactions [2]. This is followed by data preparation, where the data is examined or transformed before statistical analysis is performed to uncover important information [2]. Then, specialists would use some techniques such as machine learning, data mining, machine learning and so on to build a model. Last but not least, after getting the data we want, we still need to keep observing and comparing records to ensure the accuracy of our model.
The purpose of this paper is to summarize several predictive analyses and analyze them. It will be divided into 5 chapters. The first chapter is the introduction, which explains the importance of predictive analytics to us, and generally introduces the tools and processes used in predictive analytics. The second chapter will introduce consumer behavior from the definition and the prediction of consumer behavior. The third chapter will list several predictive analysis methods insert the model to introduce the characteristics of different analysis and prediction methods and the use process. In Chapter 4, examples will be introduced to illustrate the optimal methods adopted in different situations. In Chapter 5, we compare these approaches and select the analytics and forecasting approach that is most appropriate for predicting consumer behavior.
2. Consumer Behaviour
Consumer behavior means the action of obtaining, using and handling something such as time, products, ideas and services by people or households [6]. There is a subtle relationship between factors such as time, age or advertising and consumer choice, sometimes people purchase things like instant noodles to save time for cooking and choose to ignore the cost of time, while people may pray that the time will pass slowly during the happy shopping time [7]. Moreover, income and wealth can also be a prominent factor in purchasing [7]. For people who are rich, when “the price per unit of additional information is less than the opportunity cost of acquiring it and less than the marginal revenue resulting from it”, they would like to buy it with money instead of spend time working for it [8]. In addition, a successful advertising may have a big influence on consumer choice. To be more specific, Zufryden et al found that the zapped ads are more effective than uninterrupted ads in affecting the appetence to buy the products [9]. Thus, people started to find the relationship between memory of advertising and product choice [10]. Facts have proved that the sharpness of consumers' memory is different for advertisements with different times and different types of language, such as Chinese which is based on a system of ideographs and western language that is based on an alphabet, the differences on memorability or persuasiveness may promote different attitudes towards goods [11]. Another factor influencing consumer behavior is personality [10]. For instance, a materialist is more likely to buy luxury products or services think of attaining their imagined social status and praise [12]. In the eyes of materialistic folks, possessions such as expensive clothing can make a different first impression [13].
Collecting and analyzing the historical data and considering curial factors to predict consumer behavior is a very useful and effective way to maintain competitiveness and increase profit for business enterprises. The data analytics have to use some of the most suitable variables to find the relationships. The process of predictive has to illustrate previous demand behavior and explain the reasons. The model has to predict future demand [14]. There are plenty of sources to collect the data. For example, enterprises could check the historical data through rudimentary of point-of-sales systems after recording sales data and stock quantity, and then, “effectively, an understanding of customers’ inherent demands for different products and their willingness to substitute between them” [15]. What’s more, due to the popularity of the Internet, using google trends and gleaning the information from social media to track consumers' search data is also an effective way [15]. Some specialists mentioned that even though these methods may have minor problems, enterprises can not only understand the current hot products and customer needs but also can find out their own problems in time to quickly adjust to market conditions.
3. Methods of Predictive Analytics
3.1. Decision Tree
This is a classification model which can give the name of the class that we predicted. For an enterprise, the dendrograms systematically provide the choices to be made at different stages and also clearly list the problems faced by the company's managers, including but not limited to exogenous events such as wars and natural disasters [16]. The internal node is the question we need to solve; each branch represents the different strategies and possible options you can take, and each leaf, the external node, represents the outcome of a particular probability corresponding to that choice [5]. Uncertainty will always accompany in any business decision, in some cases, we cannot know the probability of the outcome caused by different decisions. This situation is defined as ambiguity or second-order uncertainty [17]. In addition to this feature, the decision tree also has flexibility and adaptability as it can add new possible scenarios, can also, according to need and other decision-making model integration [5]. Compared with another forecasting models, its prediction accuracy is not high, and calculation is very complex when using uncertain data [5].
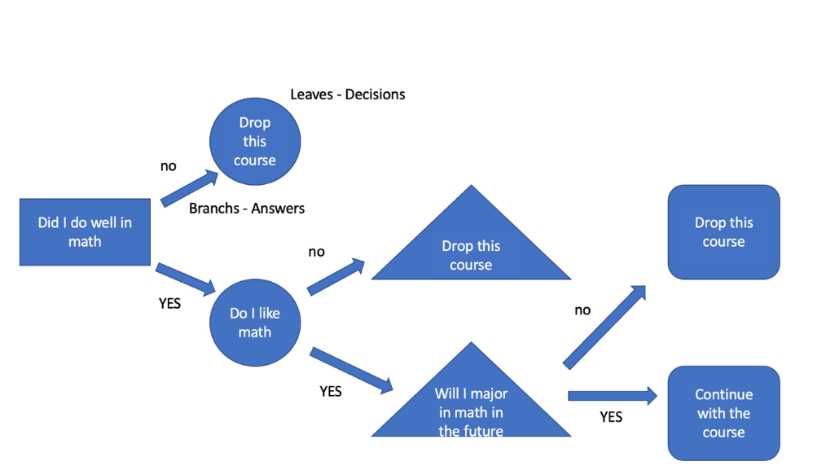
Figure 2: Decision Tree
Figure 2 illustrates what the decision tree model looks like when a high school student discusses whether he should drop out of his math class. In this case, the decision is not that complicated, and thus the tree is not very “dense” – it only has four levels. At the beginning, we need to ask if you did well in math. If you answered "no," then you drop the math course; if you answered “yes”, keep thinking about the next question: do you like math or not? If you answered "no," then clearly you should drop it. If “yes”, you'll enter the next level: whether you are going to major in math in college. Still the same, “no” for drop and “yes” means continue. This is the basic logic for how a decision tree works.
3.2. Regression Model
The regression model is widely used to estimate relationships between variables and look for the most effective influence factors on the existing results. The prediction that applies this model is the most effective when processing a small number of variables and a large number of reliable and effective data [18]. There are some mistakes that reduce prediction accuracy, such as, complexity illusion, the illusion that regression models are sufficient, the illusion of control, the illusion that regressions provide the best linear unbiased estimators and so on [19]. let us take the “fit implies accuracy” illusion as an example. Data analysts mistakenly believe that better-fitting models provide more accurate predictions. Several experts have found that the goodness of fit is not a good measure of predictive power and as complexity increases, the fit improves, and the accuracy of prior predictions decreases [20,21]. But we can still do something to avoid it, like relying on a priori analysis, combining forecasts, and adjusting dependent variables with evidence from experimental studies.
3.2.1. Linear Regression Model
3.2.1.1. Simple Linear Regression
As the name suggests, when the relationship of a dependent and an independent variable is linear, we can apply a linear regression model to illustrate it. This model can predict a continuous variable, such as a house price, which can take any value within a certain range.
\( Y=aX+b \) (1)
3.2.1.2. Multiple Regression Model
This regression model can explain the relationship between the dependent variable and one or more independents variables. You can R or excel to create the model.
Equation 2 is a linear regression with multiple independent variables is.
\( Y={a_{1}}{X_{1}}+{a_{2}}{X_{2}}+{a_{3}}{X_{3}}+…+b \) (2)
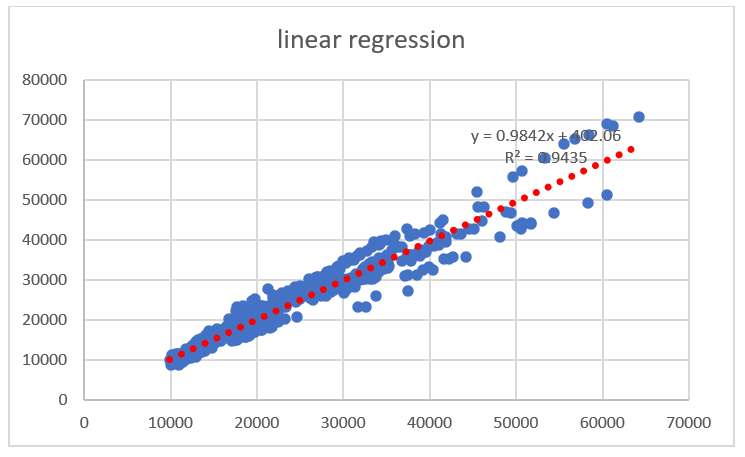
Figure 3: Linear Regression
Figure 3 is a basic structure of the linear regression made by excel. The purpose of this model is to estimate the retail price of used cars, based on a variety of vehicle characteristics, like brands, numbers of doors, miles traveled… After selecting suitable variables by p-value, we combine the number of features and their coefficients to obtain one linear function. The x range represents the ln of the number of characteristics times its strength of impact, the y range represent the corresponding price. In conclusion, this graph illustrate the linear relationship between ln (Price) and characteristics.
3.2.2. Logistic Regression Model
Logistic regression model can be considered as one of machine leaning model (ML) which is a computer algorithm that automatically learns and improves from training data. Also, it can help to find the importance of each variable in prediction process.
Unlike linear regression, linear regression takes a set of data and uses a function to classify it, the Sigmoid function was selected as the best fit one which can help saving time when applying large amount of data. To be more specific, logistic regression can be used to solve binary classification problems which divide the input results into class 1 and class 2 (which usually be classified as 1 and 0 in the programming.
\( Y=\frac{1}{1+{e^{1-x}}} \) (3)
The formula 3 is a function of Sigmoid function
\( Y=\frac{1}{1+{e^{-a{X_{1}}+b}}} \) (4)
The formula 4 is a function of the logistic regression
4. Application and Comparison
In some cases, due to time cost and technical reasons, the effective data we collect is very limited. For example, in medical research, for the study and prediction of chronic disease risk, we cannot obtain a large amount of data to analyze a certain cause. However, logistic regression performed well in predicting the risk of common chronic diseases around 6 years compared to other models [22]. However, unless you use a recursive decision tree or a Markov process to break down the complex branches, the decision tree falls short when dealing with long-duration events like this, where too much information leaves the tree with too many branches [23].
5. Case Study of Consumer Behavior
In December 2019, the first case of COVID-19 was detected in Wuhan, Hubei Province, China. The new respiratory virus claimed thousands of lives in a short period and the World Health Organization declared a global pandemic on 12 March 2020 [24]. Governments began to respond with measures such as city lockdowns and drug control. During this period, people's work and life have changed dramatically, including people's consumption habits. Safara use five machine learning methods with two ensemble methods, Boosting and Bagging. After comparing the four important criteria for evaluating the classification performance, namely accuracy, precision, recall and F-measure, the conclusion is drawn that the decision tree is the best classification model for this case with an accuracy of 94.6%. And Bagging improves its accuracy to 95.3% accuracy, still ranked the first among others [25].
Ropuszyńska-Surma and Węglarz compared two models, the decision tree method and the logit model, to find characteristics of energy consumers and predict their likelihood of making an investment and becoming energy prosumers. Both methods select the same significant variables and differ slightly in the selection of insignificant variables. The decision tree splits the samples according to a certain class, such as living area, whether use a water boiler and so on, the entropy of all the leaves is equal to 0 or close to that value. This way, the model does a good job of distinguishing potential customers from those who are not considering the item. However, to avoid overfitting, the decision tree is limited to four levels, so the individual classes are not perfectly distinguished [25]. When constructing the logistic regression model, experts removed variables with p-values greater than 0.05 in stages. To ensure a high likelihood ratio, some variables with p-values greater than 0.05 were retained [26].
6. Conclusion
The exponential growth of data makes predictive analysis technology occupy an unshakable position in people's lives and work. With the development of computer languages, one can use many different models to classify data and predict the future.
The two models mentioned in this paper play important roles in the business industry. Enterprises use these techniques to make better decisions in allocating resources. We can't make a general statement about which one is better. Both of the models can filter for the most effective variables, and they both give a good but slightly different accuracy. However, for logistic regression, it can only give binary outcomes. And for decision tree models, overfitting would be a concern.
Different models may give slightly different results. However, due to the complexity of the actual situation, it seems difficult for people to rely on a simple model for various operations. In this case, many experts will use other auxiliary measures, such as limiting the classification depth or combining the model with some wrapping technique. Aksu & Keceoglu also proposed in their study that the study of predictor variables should not be limited to one method, and that more powerful evidence could be obtained by combining different methods serving the same purpose. In many papers dealing with real-world problems, the authors use these techniques to optimize the selection of variables. For example, the findings form Rahmadani et al. seem consistent with this point of view and they proposed that using genetic algorithms can improve the accuracy of decision trees [26].
In the future, new models can be created to add the helper functions directly to the prediction model so as to make the predictive analysis process more concise and accurate. Moreover, developing more powerful systems that allow programs themselves to choose the best predictive analysis techniques that are more appropriate for certain types of events would be an effective way can better help people deal with a large amount of complex information.
References
[1]. Kursuncu, U., Gaur, M., Lokala, U., Thirunarayan, K., Sheth, A., & Arpinar, I. B. (2019). Predictive Analysis on Twitter: Techniques and Applications. In N. Agarwal, N. Dokoohaki, & S. Tokdemir (Eds.), Emerging Research Challenges and Opportunities in Computational Social Network Analysis and Mining (pp. 67–104). Springer International Publishing.
[2]. Lee, C. S., Cheang, P. Y. S., & Moslehpour, M. (2022). Predictive analytics in business analytics: decision tree. Advances in Decision Sciences, 26(1), 1-29.
[3]. Jahnke, H. N. (2003). A history of analysis (No. 24). American Mathematical Soc.
[4]. Elkan, C. (2013). Predictive analytics and data mining (Vol. 600). San Diego: University of California.
[5]. Kumar, V., & Garg, M. L. (2018). Predictive analytics: a review of trends and techniques. International Journal of Computer Applications, 182(1), 31-37.
[6]. 14Jacoby, J. (1976). Consumer psychology: An octennium. Annual review of psychology, 27(1), 331-358.
[7]. Jacoby, J., Szybillo, G. J., & Berning, C. K. (1976). Time and consumer behavior: An interdisciplinary overview. Journal of consumer research, 2(4), 320-339.
[8]. Mincer, J. (1963). Market prices, opportunity costs, and income effects. Measurement in economics, 67-82.
[9]. Zufryden, F. S., Pedrick, J. H., & Sankaralingam, A. (1993). Zapping and its impact on brand purchase behavior. Journal of Advertising Research, 33(1), 58-67.
[10]. Jacoby, J., Johar, G. V., & Morrin, M. (1998). Consumer behavior: A quadrennium. Annual review of psychology, 49(1), 319-344.
[11]. Schmitt, B. H., Pan, Y., & Tavassoli, N. T. (1994). Language and consumer memory: The impact of linguistic differences between Chinese and English. Journal of consumer research, 21(3), 419-431.
[12]. Sundie, J. M., Pandelaere, M., Lens, I., & Warlop, L. (2020). Setting the bar: The influence of women’s conspicuous display on men’s affiliative behavior. Journal of Business Research, 120, 569–585.
[13]. Hunt, J. M., Kernan, J. B., & Mitchell, D. J. (1996). Materialism as social cognition: People, possessions, and perception. Journal of Consumer Psychology, 5(1), 65-83.
[14]. Değirmencioğlu, Y., & Akyurt, İ. Z. (2023). Forecasting. Smart and Sustainable Operations and Supply Chain Management in Industry 4.0.
[15]. Boone, T., Ganeshan, R., Jain, A., & Sanders, N. R. (2019). Forecasting sales in the supply chain: Consumer analytics in the big data era. International Journal of Forecasting, 35(1), 170–180.
[16]. Kamiński, B., Jakubczyk, M., & Szufel, P. (2018). A framework for sensitivity analysis of decision trees. Central European journal of operations research, 26, 135-159.
[17]. Borgonovo, E., & Marinacci, M. (2015). Decision analysis under ambiguity. European Journal of Operational Research, 244(3), 823-836
[18]. Armstrong, J. S. (2012). Illusions in regression analysis. International Journal of Forecasting, 28(3), 689–694.
[19]. 33Armstrong, J. S. (2012). Illusions in regression analysis. International Journal of Forecasting, 28(3), 689–694.
[20]. Pant, P. N., & Starbuck, W. H. (1990). Innocents in the forest: Forecasting and research methods. Journal of Management, 16(2), 433-460.
[21]. Zellner, A. (2001). 14 Keep it sophisticatedly simple. This page intentionally left blank, 242.
[22]. Nusinovici, S., Tham, Y. C., Chak Yan, M. Y., Wei Ting, D. S., Li, J., Sabanayagam, C., Wong, T. Y., & Cheng, 36C.-Y. (2020). Logistic regression was as good as machine learning for predicting major chronic diseases. Journal of Clinical Epidemiology, 122, 56–69.
[23]. Tom, E., & Schulman, K. A. (1997). Mathematical models in decision analysis. Infection Control & Hospital Epidemiology, 18(1), 65-73.
[24]. Ciotti, M., Ciccozzi, M., Terrinoni, A., Jiang, W. C., Wang, C. B., & Bernardini, S. (2020). The COVID-19 pandemic. Critical reviews in clinical laboratory sciences, 57(6), 365-388.
[25]. Safara, F. (2022). A computational model to predict consumer behaviour during COVID-19 pandemic. Computational Economics, 59(4), 1525-1538.
[26]. Ropuszyńska-Surma, E. (2020). The Behavioural Profiles of Energy Consumers: Comparison of the Decision Tree Method and the Logit Model. In W. Sroka (Ed.), & M. Węglarz (Trans.), Perspectives on Consumer Behaviour (pp. 211–239). Springer International Publishing.
Cite this article
Wang,R. (2024). Predictive Analytics in Consumer Behavior Forecasting: A Literature Review. Advances in Economics, Management and Political Sciences,106,34-41.
Data availability
The datasets used and/or analyzed during the current study will be available from the authors upon reasonable request.
Disclaimer/Publisher's Note
The statements, opinions and data contained in all publications are solely those of the individual author(s) and contributor(s) and not of EWA Publishing and/or the editor(s). EWA Publishing and/or the editor(s) disclaim responsibility for any injury to people or property resulting from any ideas, methods, instructions or products referred to in the content.
About volume
Volume title: Proceedings of the 3rd International Conference on Business and Policy Studies
© 2024 by the author(s). Licensee EWA Publishing, Oxford, UK. This article is an open access article distributed under the terms and
conditions of the Creative Commons Attribution (CC BY) license. Authors who
publish this series agree to the following terms:
1. Authors retain copyright and grant the series right of first publication with the work simultaneously licensed under a Creative Commons
Attribution License that allows others to share the work with an acknowledgment of the work's authorship and initial publication in this
series.
2. Authors are able to enter into separate, additional contractual arrangements for the non-exclusive distribution of the series's published
version of the work (e.g., post it to an institutional repository or publish it in a book), with an acknowledgment of its initial
publication in this series.
3. Authors are permitted and encouraged to post their work online (e.g., in institutional repositories or on their website) prior to and
during the submission process, as it can lead to productive exchanges, as well as earlier and greater citation of published work (See
Open access policy for details).
References
[1]. Kursuncu, U., Gaur, M., Lokala, U., Thirunarayan, K., Sheth, A., & Arpinar, I. B. (2019). Predictive Analysis on Twitter: Techniques and Applications. In N. Agarwal, N. Dokoohaki, & S. Tokdemir (Eds.), Emerging Research Challenges and Opportunities in Computational Social Network Analysis and Mining (pp. 67–104). Springer International Publishing.
[2]. Lee, C. S., Cheang, P. Y. S., & Moslehpour, M. (2022). Predictive analytics in business analytics: decision tree. Advances in Decision Sciences, 26(1), 1-29.
[3]. Jahnke, H. N. (2003). A history of analysis (No. 24). American Mathematical Soc.
[4]. Elkan, C. (2013). Predictive analytics and data mining (Vol. 600). San Diego: University of California.
[5]. Kumar, V., & Garg, M. L. (2018). Predictive analytics: a review of trends and techniques. International Journal of Computer Applications, 182(1), 31-37.
[6]. 14Jacoby, J. (1976). Consumer psychology: An octennium. Annual review of psychology, 27(1), 331-358.
[7]. Jacoby, J., Szybillo, G. J., & Berning, C. K. (1976). Time and consumer behavior: An interdisciplinary overview. Journal of consumer research, 2(4), 320-339.
[8]. Mincer, J. (1963). Market prices, opportunity costs, and income effects. Measurement in economics, 67-82.
[9]. Zufryden, F. S., Pedrick, J. H., & Sankaralingam, A. (1993). Zapping and its impact on brand purchase behavior. Journal of Advertising Research, 33(1), 58-67.
[10]. Jacoby, J., Johar, G. V., & Morrin, M. (1998). Consumer behavior: A quadrennium. Annual review of psychology, 49(1), 319-344.
[11]. Schmitt, B. H., Pan, Y., & Tavassoli, N. T. (1994). Language and consumer memory: The impact of linguistic differences between Chinese and English. Journal of consumer research, 21(3), 419-431.
[12]. Sundie, J. M., Pandelaere, M., Lens, I., & Warlop, L. (2020). Setting the bar: The influence of women’s conspicuous display on men’s affiliative behavior. Journal of Business Research, 120, 569–585.
[13]. Hunt, J. M., Kernan, J. B., & Mitchell, D. J. (1996). Materialism as social cognition: People, possessions, and perception. Journal of Consumer Psychology, 5(1), 65-83.
[14]. Değirmencioğlu, Y., & Akyurt, İ. Z. (2023). Forecasting. Smart and Sustainable Operations and Supply Chain Management in Industry 4.0.
[15]. Boone, T., Ganeshan, R., Jain, A., & Sanders, N. R. (2019). Forecasting sales in the supply chain: Consumer analytics in the big data era. International Journal of Forecasting, 35(1), 170–180.
[16]. Kamiński, B., Jakubczyk, M., & Szufel, P. (2018). A framework for sensitivity analysis of decision trees. Central European journal of operations research, 26, 135-159.
[17]. Borgonovo, E., & Marinacci, M. (2015). Decision analysis under ambiguity. European Journal of Operational Research, 244(3), 823-836
[18]. Armstrong, J. S. (2012). Illusions in regression analysis. International Journal of Forecasting, 28(3), 689–694.
[19]. 33Armstrong, J. S. (2012). Illusions in regression analysis. International Journal of Forecasting, 28(3), 689–694.
[20]. Pant, P. N., & Starbuck, W. H. (1990). Innocents in the forest: Forecasting and research methods. Journal of Management, 16(2), 433-460.
[21]. Zellner, A. (2001). 14 Keep it sophisticatedly simple. This page intentionally left blank, 242.
[22]. Nusinovici, S., Tham, Y. C., Chak Yan, M. Y., Wei Ting, D. S., Li, J., Sabanayagam, C., Wong, T. Y., & Cheng, 36C.-Y. (2020). Logistic regression was as good as machine learning for predicting major chronic diseases. Journal of Clinical Epidemiology, 122, 56–69.
[23]. Tom, E., & Schulman, K. A. (1997). Mathematical models in decision analysis. Infection Control & Hospital Epidemiology, 18(1), 65-73.
[24]. Ciotti, M., Ciccozzi, M., Terrinoni, A., Jiang, W. C., Wang, C. B., & Bernardini, S. (2020). The COVID-19 pandemic. Critical reviews in clinical laboratory sciences, 57(6), 365-388.
[25]. Safara, F. (2022). A computational model to predict consumer behaviour during COVID-19 pandemic. Computational Economics, 59(4), 1525-1538.
[26]. Ropuszyńska-Surma, E. (2020). The Behavioural Profiles of Energy Consumers: Comparison of the Decision Tree Method and the Logit Model. In W. Sroka (Ed.), & M. Węglarz (Trans.), Perspectives on Consumer Behaviour (pp. 211–239). Springer International Publishing.